Master Discusses Hot Topics:
I didn't update yesterday on 5.19, as there's no need to elaborate too much for those in the crypto circle. Bitcoin experienced a rollercoaster ride, peaking at 107k and dropping to 102k within 24 hours, going back and forth four times, leaving those holding positions and all-in players in a state of lament.
And it's not just Bitcoin that is going crazy; even the U.S. stock market is participating. Moody's downgraded the U.S. rating, causing everyone to panic and sell off. But this wave of panic is just child's play; the market wasn't really shaken.
Last night, U.S. stocks, gold, and Bitcoin all rose together. What does this indicate? The market's sensitivity to uncertainty is still very much alive. Regardless of the rating, money still wants to flow to safer places.
Moreover, how healthy the U.S. economy is has long been anticipated by analysts and fund managers; who still takes that seriously? The real powerhouse is Bitcoin, with a total market cap of $3.4 trillion, of which Bitcoin accounts for $2 trillion.
If, and I mean if, Bitcoin were to surge to $200,000, the market cap would reach $4 trillion. I advise you not to dream; you need to first see what the Federal Reserve is doing. Without interest rate cuts or liquidity injections, where's the good fortune in that?
Back to Bitcoin, the market has been oscillating at these high levels, leading retail investors by the nose. Yesterday's drop can only be seen as a correction, a crazy washout, causing altcoins to panic, but essentially, the bullish trend remains strong.
You can see the current sector differentiation: Bitcoin is consolidating while altcoins are plummeting. This proves a point: even if Bitcoin hits new highs, altcoins may not benefit, just look at Ethereum.
Speaking of bullish or bearish? Personally, I believe that to touch 120k, 130k, or even 150k, there needs to be solid backing. Interest rate cuts and liquidity easing are the real signals; otherwise, just reminisce about the recent range-bound trading.
Master Looks at Trends:
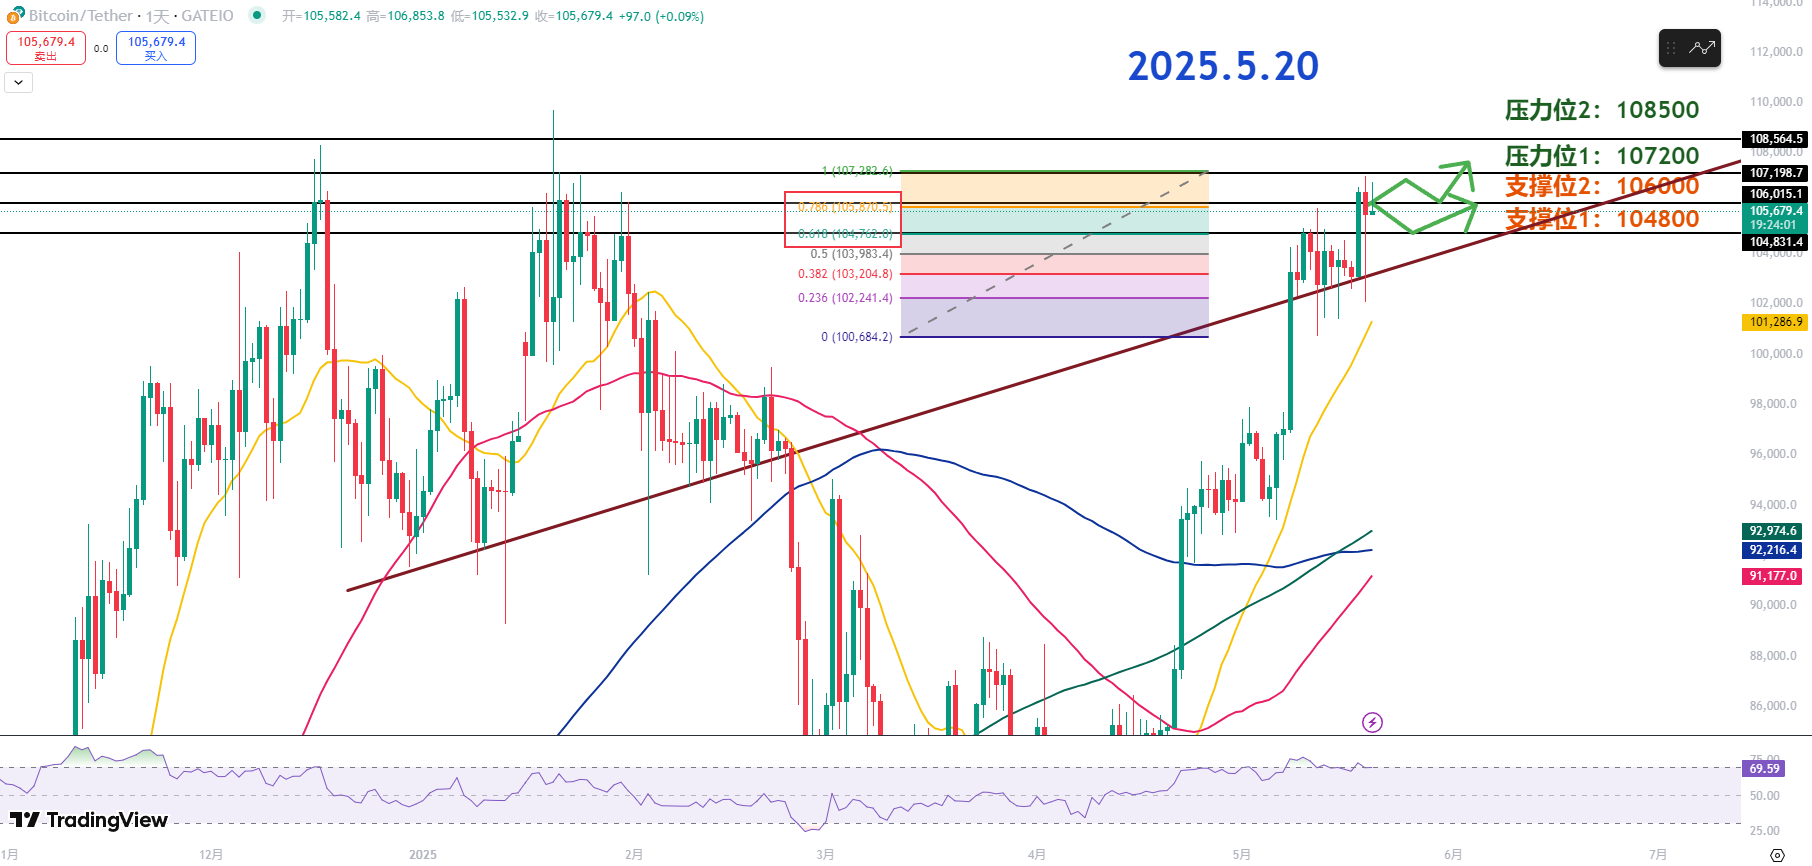
Resistance Levels Reference:
Second Resistance Level: 108500
First Resistance Level: 107200
Support Levels Reference:
Second Support Level: 106000
First Support Level: 104800
Today's Suggestions:
If the price can hold above 105.5K (retracing to the Fibonacci 0.786 level), we can expect further upward movement. If there is a moderate pullback to the secondary support, it could be seen at 104.8K (near Fibonacci 0.618), and further down at 104K (near 0.5).
The above levels correspond to previously broken highs and can serve as phased buying references. If the price consolidates in the current range, it is likely to challenge new highs again.
On the daily level, a solid bullish candle has appeared, indicating limited room for correction. Short-term traders can take advantage of the recent dip to enter at more favorable prices, waiting for the price to break upward. As trading volume increases, the probability of hitting a new high of 110K is also rising.
Currently, the range of 104.8K to 105.5K is a healthy pullback, so keep an eye on buying points in this area. For aggressive strategies, a pullback to around 104K can be expected; for conservative strategies, focus on the 104.8K–105.5K range.
The upward trend remains strong, and the main strategy for the day should be to maintain a bullish outlook. Key points to watch: the first and second support levels, as well as 104K and the rising trend line, as references for short-term entry.
5.20 Master’s Band Trading Plan:
Long Entry Reference: Buy in batches in the 104000-104800 range, Target: 107200-108500
Short Entry Reference: Not applicable for now
If you genuinely want to learn something from a blogger, you need to keep following them, rather than making hasty conclusions after just a few market observations. This market is filled with performers; today they show screenshots of long positions, tomorrow they summarize short positions, making it seem like they "always catch the tops and bottoms," but in reality, it's all hindsight. A truly worthy blogger has a trading logic that is consistent, coherent, and withstands scrutiny, rather than jumping in only when the market moves. Don't be blinded by flashy data and out-of-context screenshots; long-term observation and deep understanding are necessary to discern who is a thinker and who is a dreamer!
This content is exclusively planned and published by Master Chen (WeChat public account: Coin God Master Chen). For more real-time investment strategies, solutions, spot trading, short, medium, and long-term contract trading techniques, operational skills, and knowledge about candlesticks, you can join Master Chen for learning and communication. A free experience group for fans and community live broadcasts are now available!

Friendly Reminder: This article is only written by Master Chen on the official public account (as shown above). Any other advertisements at the end of the article or in the comments section are unrelated to the author!! Please be cautious in distinguishing between true and false, thank you for reading.
免责声明:本文章仅代表作者个人观点,不代表本平台的立场和观点。本文章仅供信息分享,不构成对任何人的任何投资建议。用户与作者之间的任何争议,与本平台无关。如网页中刊载的文章或图片涉及侵权,请提供相关的权利证明和身份证明发送邮件到support@aicoin.com,本平台相关工作人员将会进行核查。