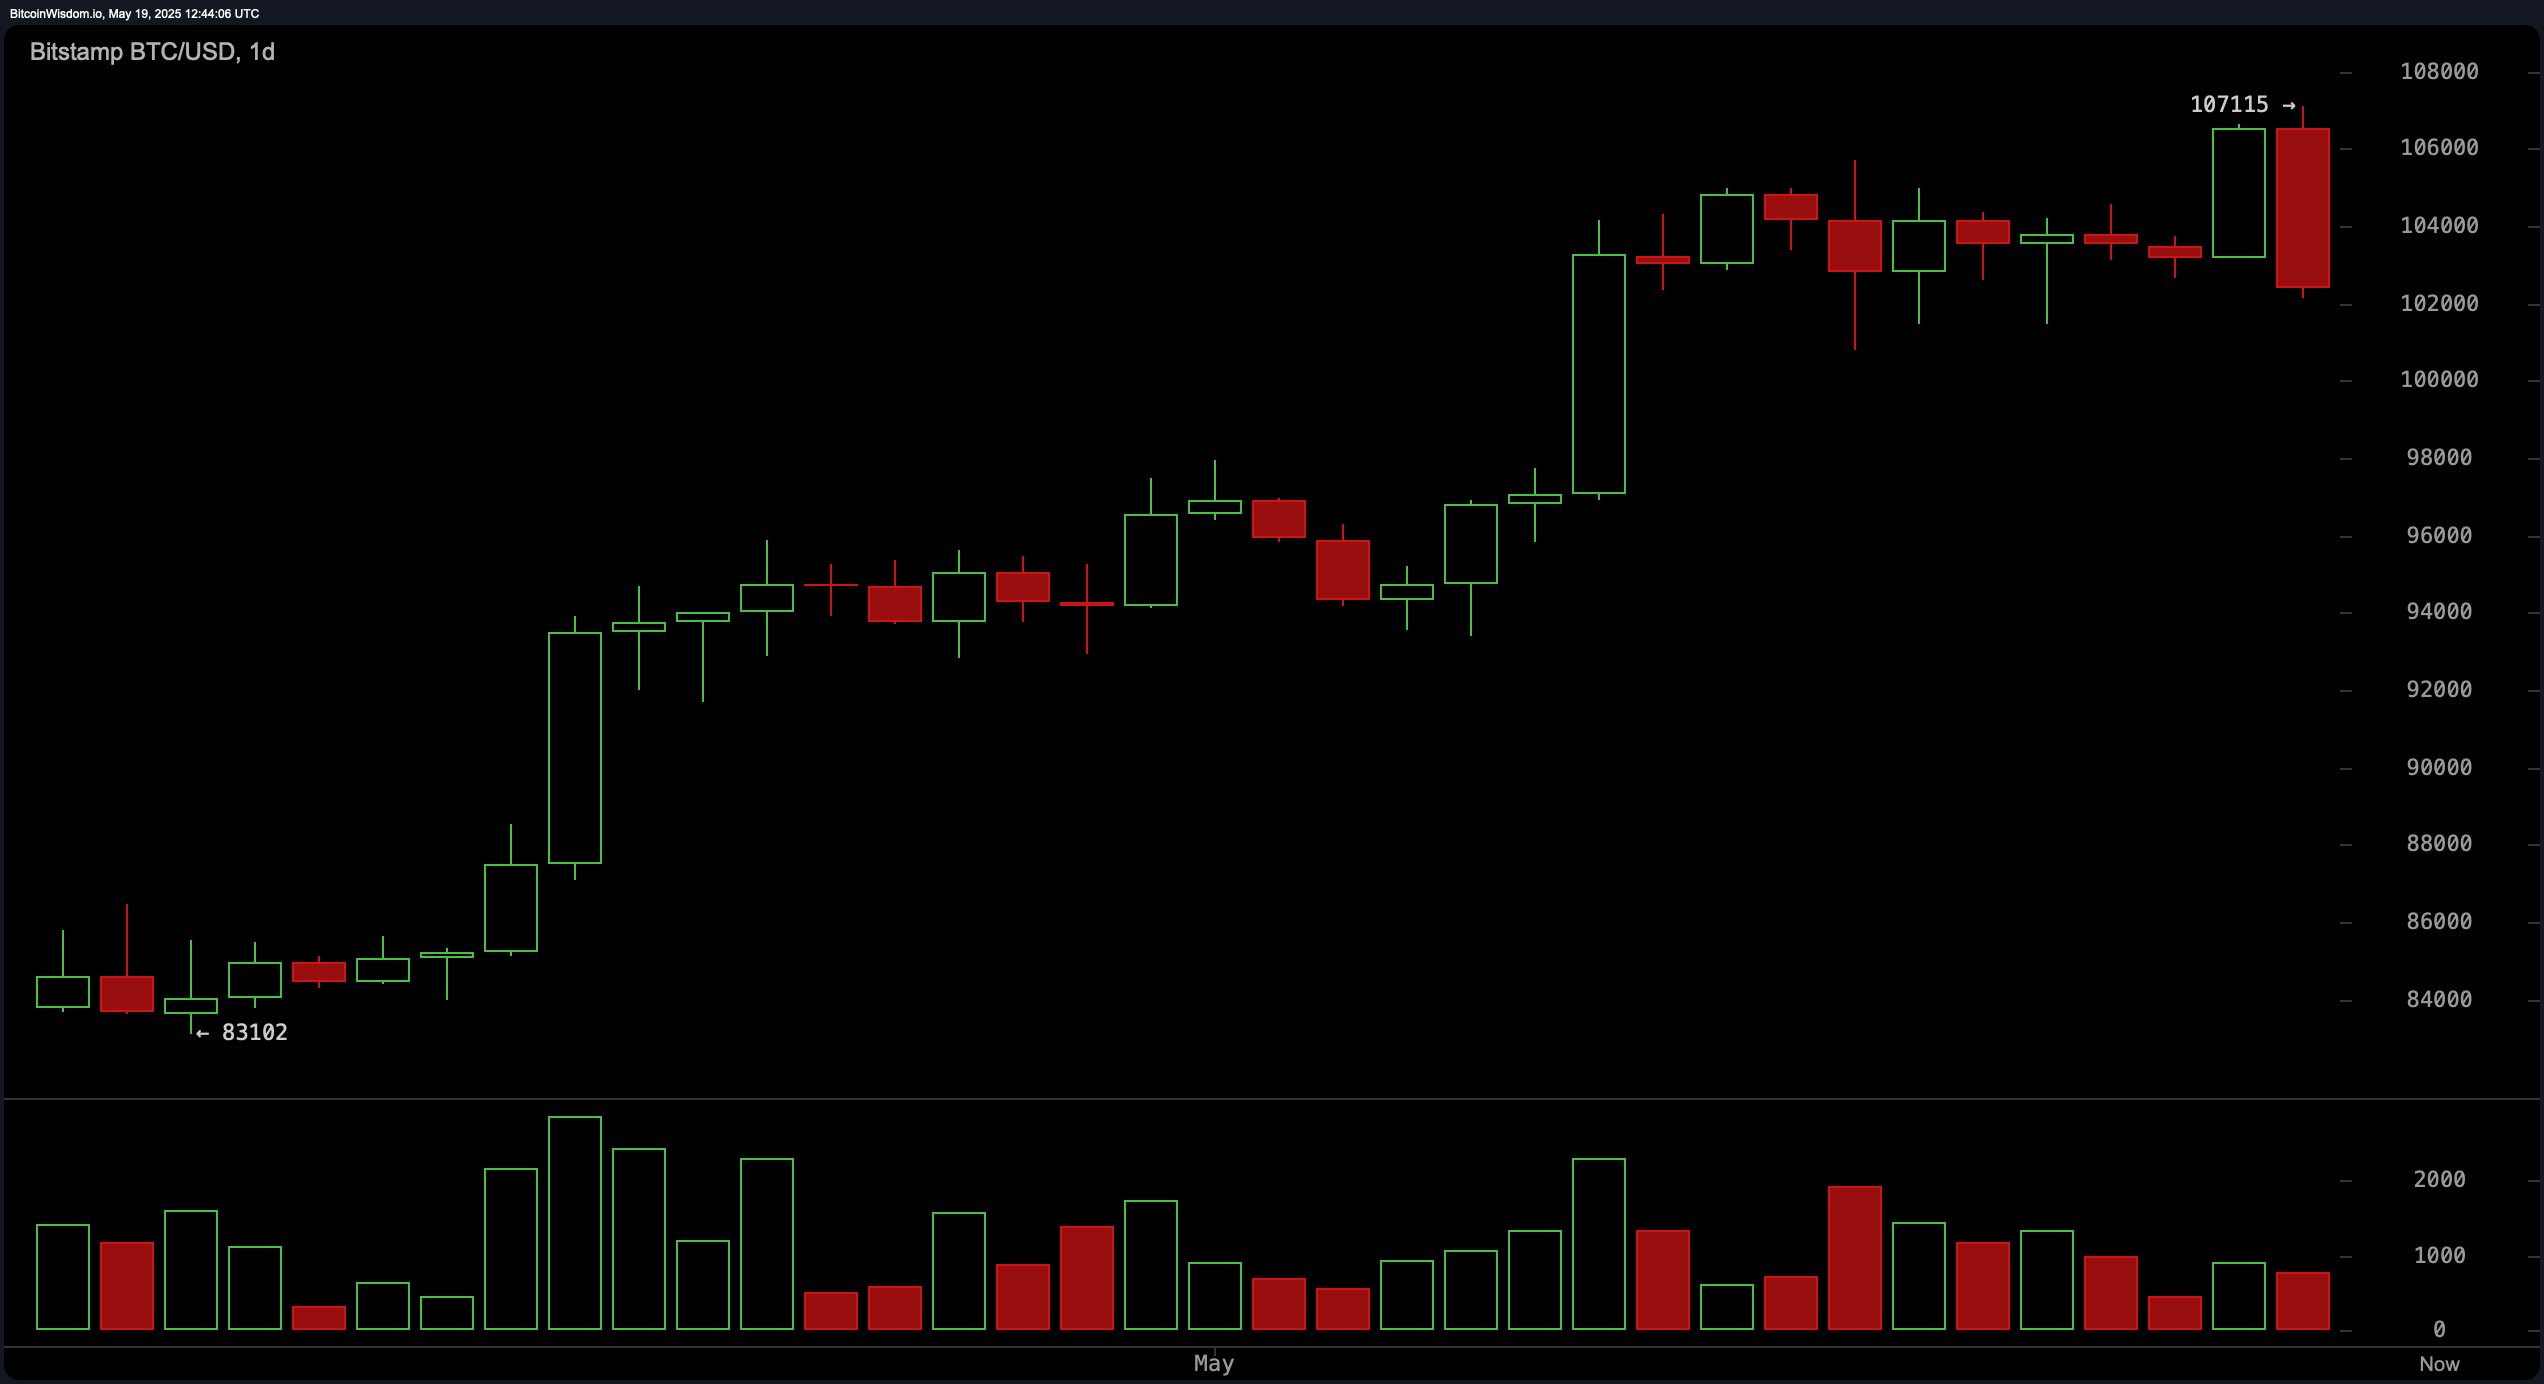
A recent rejection from the local high of $107,115 signals a significant turning point, especially with heightened selling pressure seen across all major timeframes. On the daily chart, bitcoin ( BTC) had been in a strong uptrend from approximately $83,000 to $107,000 before a notable reversal pattern emerged. Indicators point to the potential formation of a bearish engulfing or shooting star candlestick pattern, both signaling possible tops. Volume surged on the red daily candle, emphasizing the sell-off’s intensity. Traders are now eyeing the $101,500 to $102,000 support range as a potential re-entry point, although caution is warranted unless this base holds.

BTC/USD 1D chart via Bitstamp on May 19, 2025.
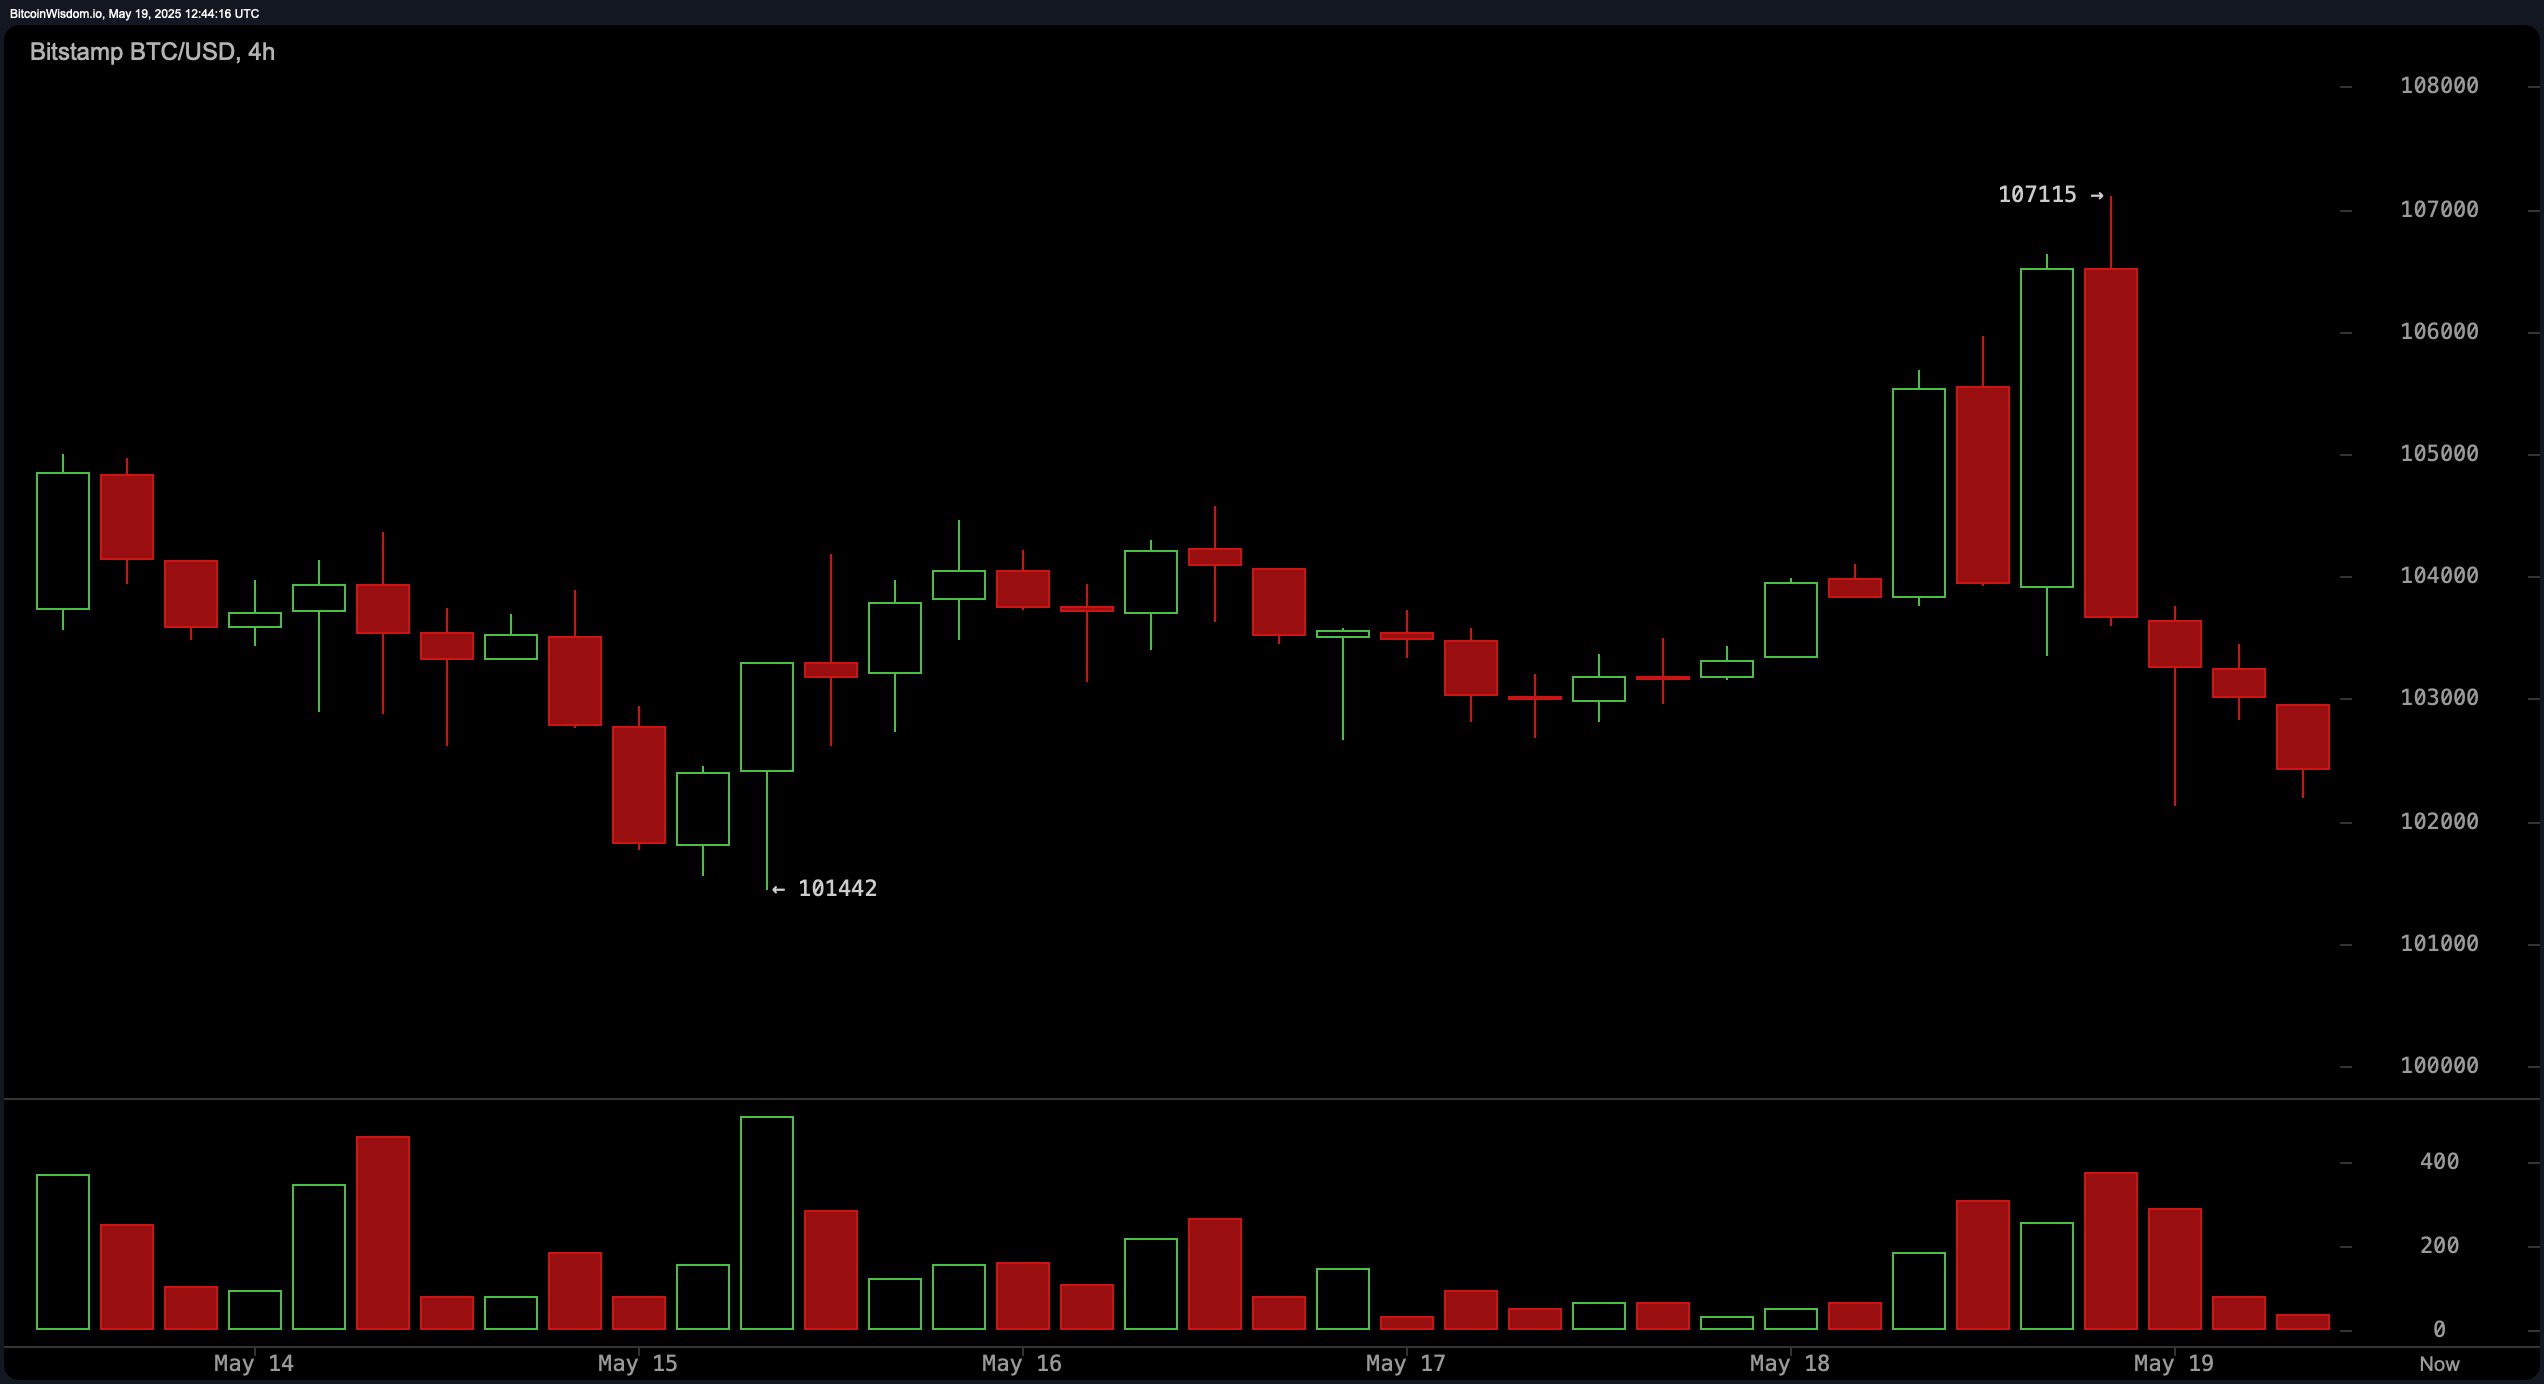
The four-hour chart paints a similarly bearish picture. Following the top at $107,115, bitcoin saw a sharp decline, with candle bodies shrinking after the drop—often a sign of slowing downward momentum. Volume analysis confirms a panic-driven sell-off, suggesting emotional exits by traders. The $102,000–$102,500 zone is being tested as a support base, but any breach below $101,000 may open the door to deeper losses. Until price action stabilizes in this zone, risk remains skewed to the downside.

BTC/USD 4H chart via Bitstamp on May 19, 2025.
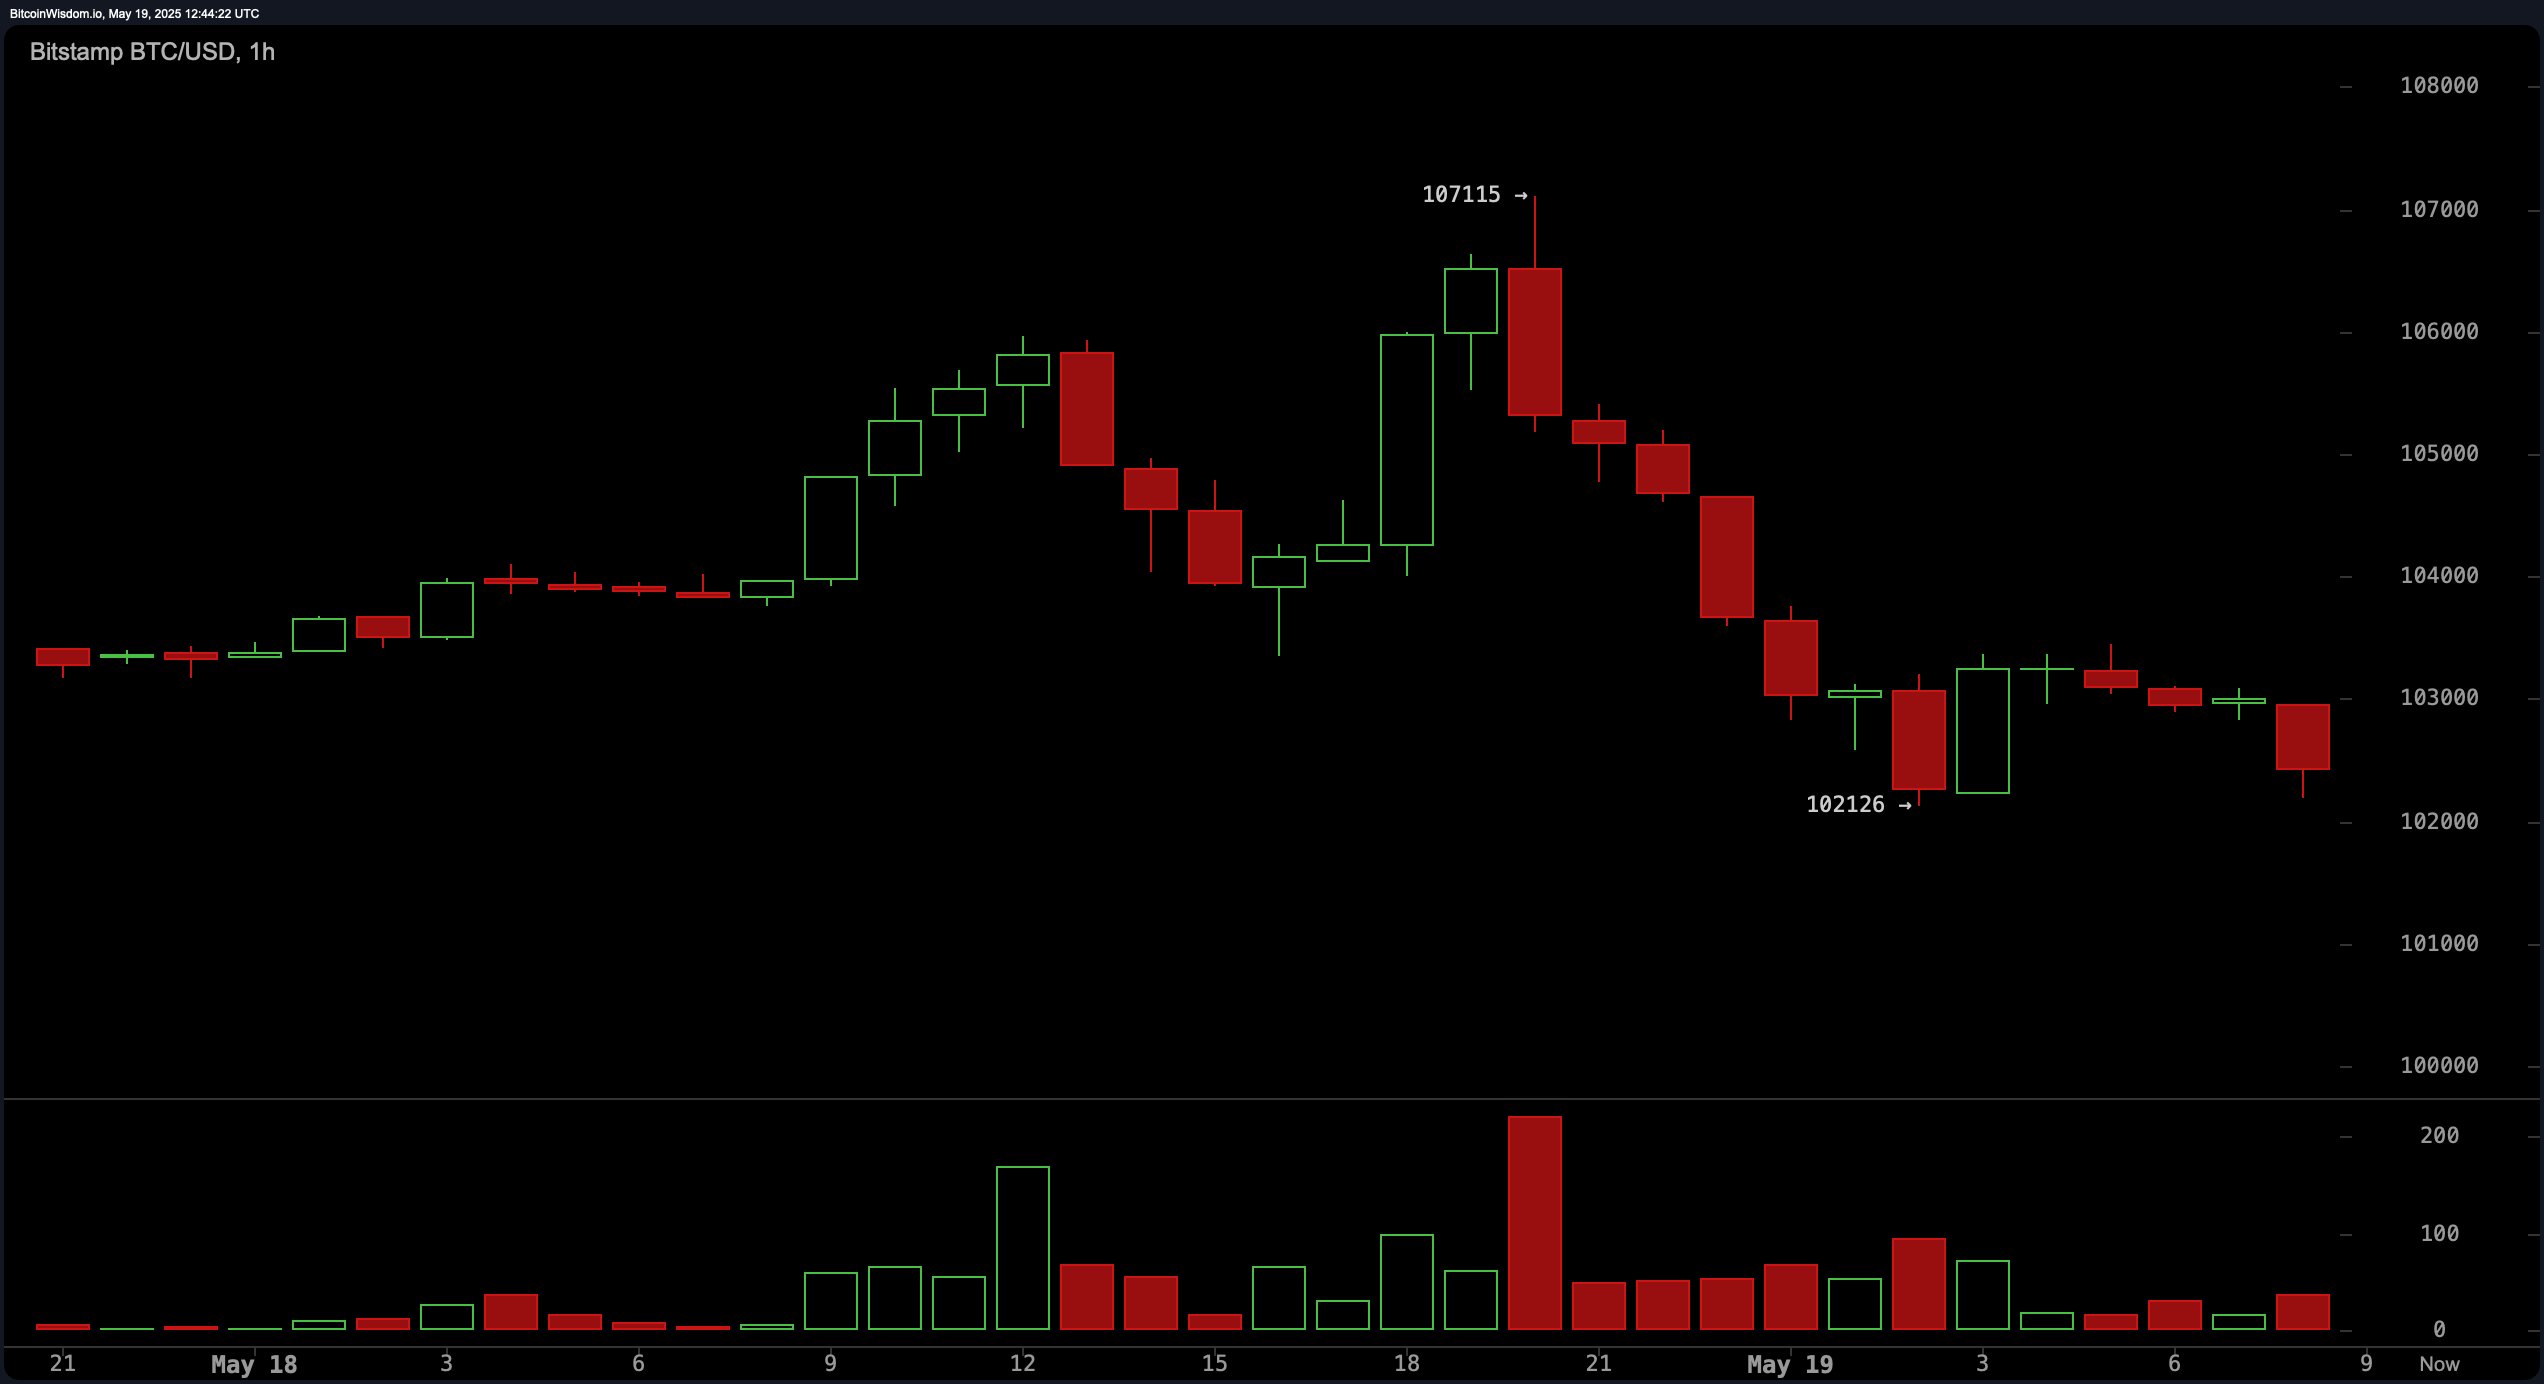
On the one-hour chart, the trend is decisively negative. Each recovery attempt has been short-lived, characterized by lower highs and lower lows. Currently, bitcoin is attempting to base around $102,126, but upward momentum is weak. Short-term scalping opportunities may arise if the price can convincingly reclaim the $103,000 level on rising green volume. However, any movement below $102,000 would likely invalidate such setups and signal a continuation of the bearish momentum.

BTC/USD 1H chart via Bitstamp on May 19, 2025.
Oscillator readings reinforce this cautious stance. The relative strength index (RSI) stands at 59, indicating a neutral momentum with room for downward movement. The stochastic oscillator at 81 issues a sell signal, while the commodity channel index (CCI) at 61 and the average directional index (ADX) at 33 remain neutral. The awesome oscillator reads 7,833, also neutral, whereas the momentum indicator at -663 and the moving average convergence divergence (MACD) level at 3,472 both suggest a bearish bias.
Moving average data offers mixed signals but tilts bullish on longer timeframes. Short-term indicators such as the 10-period exponential moving average (EMA) at 103,029 and the 10-period simple moving average (SMA) at 103,871 are both issuing sell signals. However, all moving averages from the 20-period up to the 200-period—both EMA and SMA—are in buy territory, highlighting an underlying strength in the broader trend. Despite this, the current price action below the short-term moving averages suggests a pullback phase that could extend unless key support levels hold.
Bull Verdict:
If bitcoin maintains support in the $102,000 to $101,500 range and reclaims the $103,000 level with increasing volume, the broader uptrend remains intact. Strength in longer-term moving averages and a solid base at current levels could offer a springboard for another attempt at $107,000 or higher.
Bear Verdict:
Should bitcoin breach the $101,000 level decisively, the recent top at $107,115 will likely mark a medium-term peak. Momentum indicators and short-term moving averages confirm a bearish bias, suggesting further downside toward the mid-$90,000 range is possible.
免责声明:本文章仅代表作者个人观点,不代表本平台的立场和观点。本文章仅供信息分享,不构成对任何人的任何投资建议。用户与作者之间的任何争议,与本平台无关。如网页中刊载的文章或图片涉及侵权,请提供相关的权利证明和身份证明发送邮件到support@aicoin.com,本平台相关工作人员将会进行核查。


