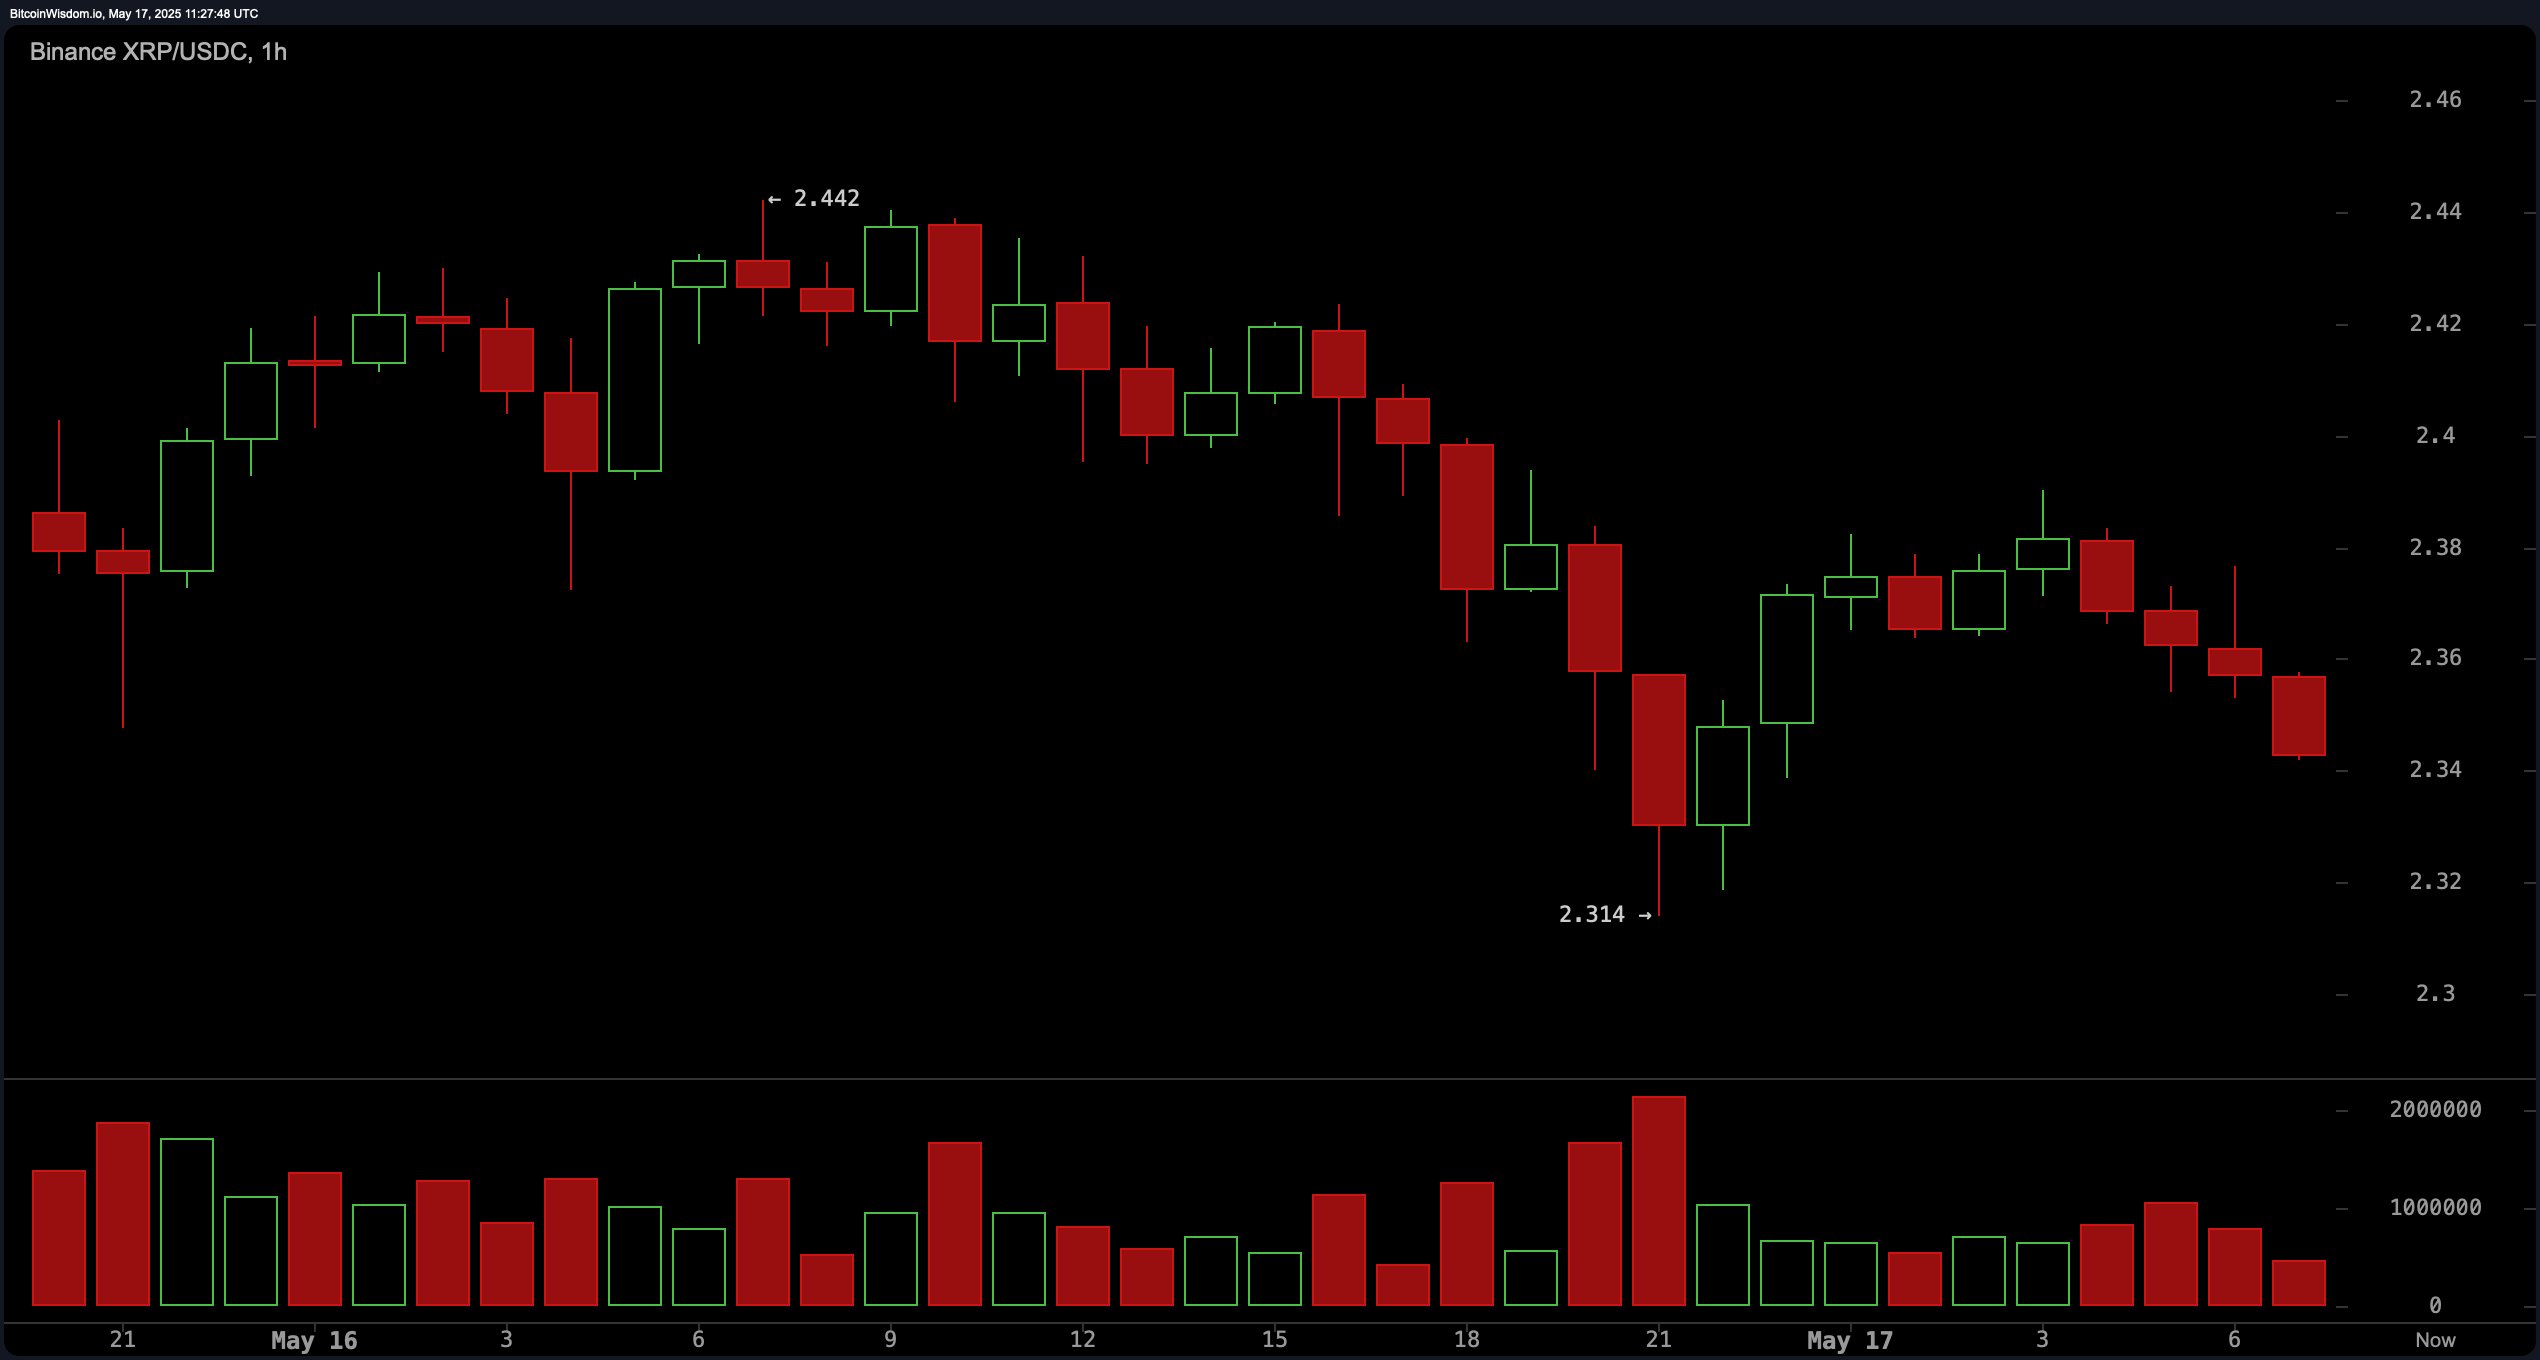
On the 1-hour chart, XRP shows signs of a clear pullback, with the price structure forming lower highs and lower lows. This short-term bearish trend indicates a weakening in bullish momentum, particularly as the $2.31 support level has been repeatedly tested. If this level fails to hold, XRP could drop toward the $2.20 zone. The volume profile supports this cautionary outlook, with red volume bars outweighing green in recent sessions, suggesting that sellers are dominating the current momentum.

XRP/USDC via Binance 1H chart on May 17, 2025.
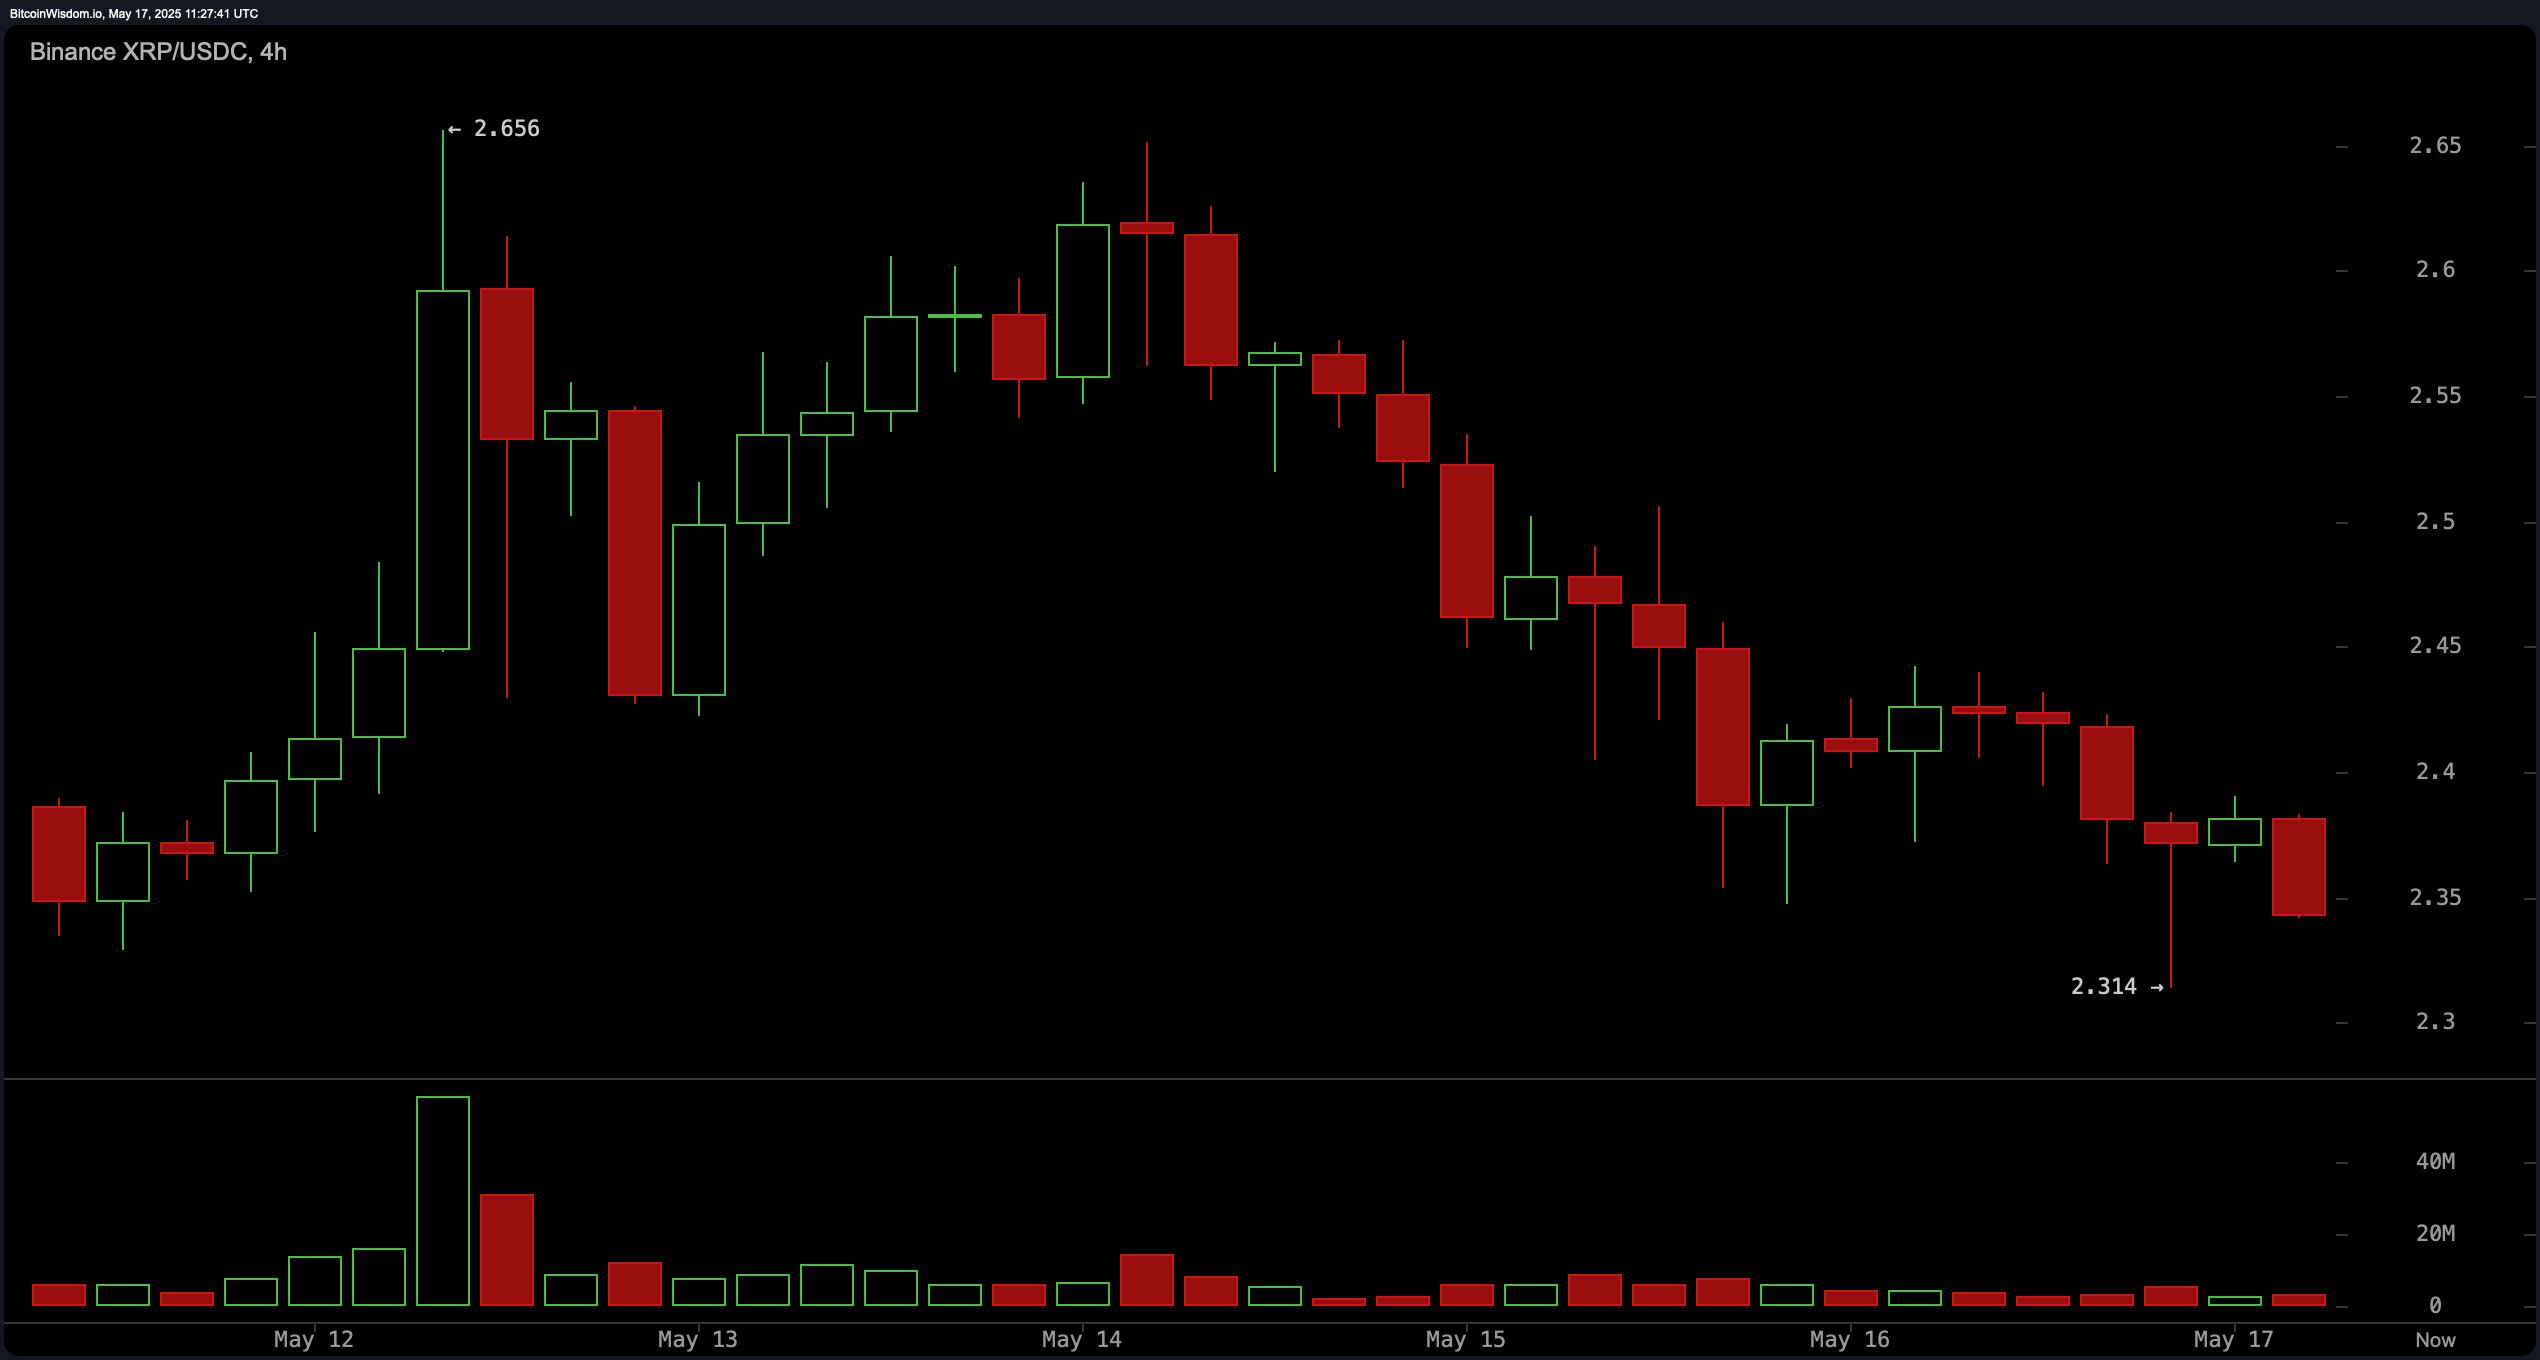
The 4-hour chart similarly paints a bearish picture, with XRP maintaining a downtrend below a critical resistance point of $2.44. This time frame reveals a potential lower high formation, underscoring continued short-term weakness. The pair previously peaked near $2.656 before entering a corrective phase. Although large green volume spikes preceded the drop—suggesting initial institutional interest—follow-through has been weak, with sellers pressing prices lower. If the price closes below $2.30, the next support to watch lies closer to $2.20.

XRP/USDC via Binance 4H chart on May 17, 2025.
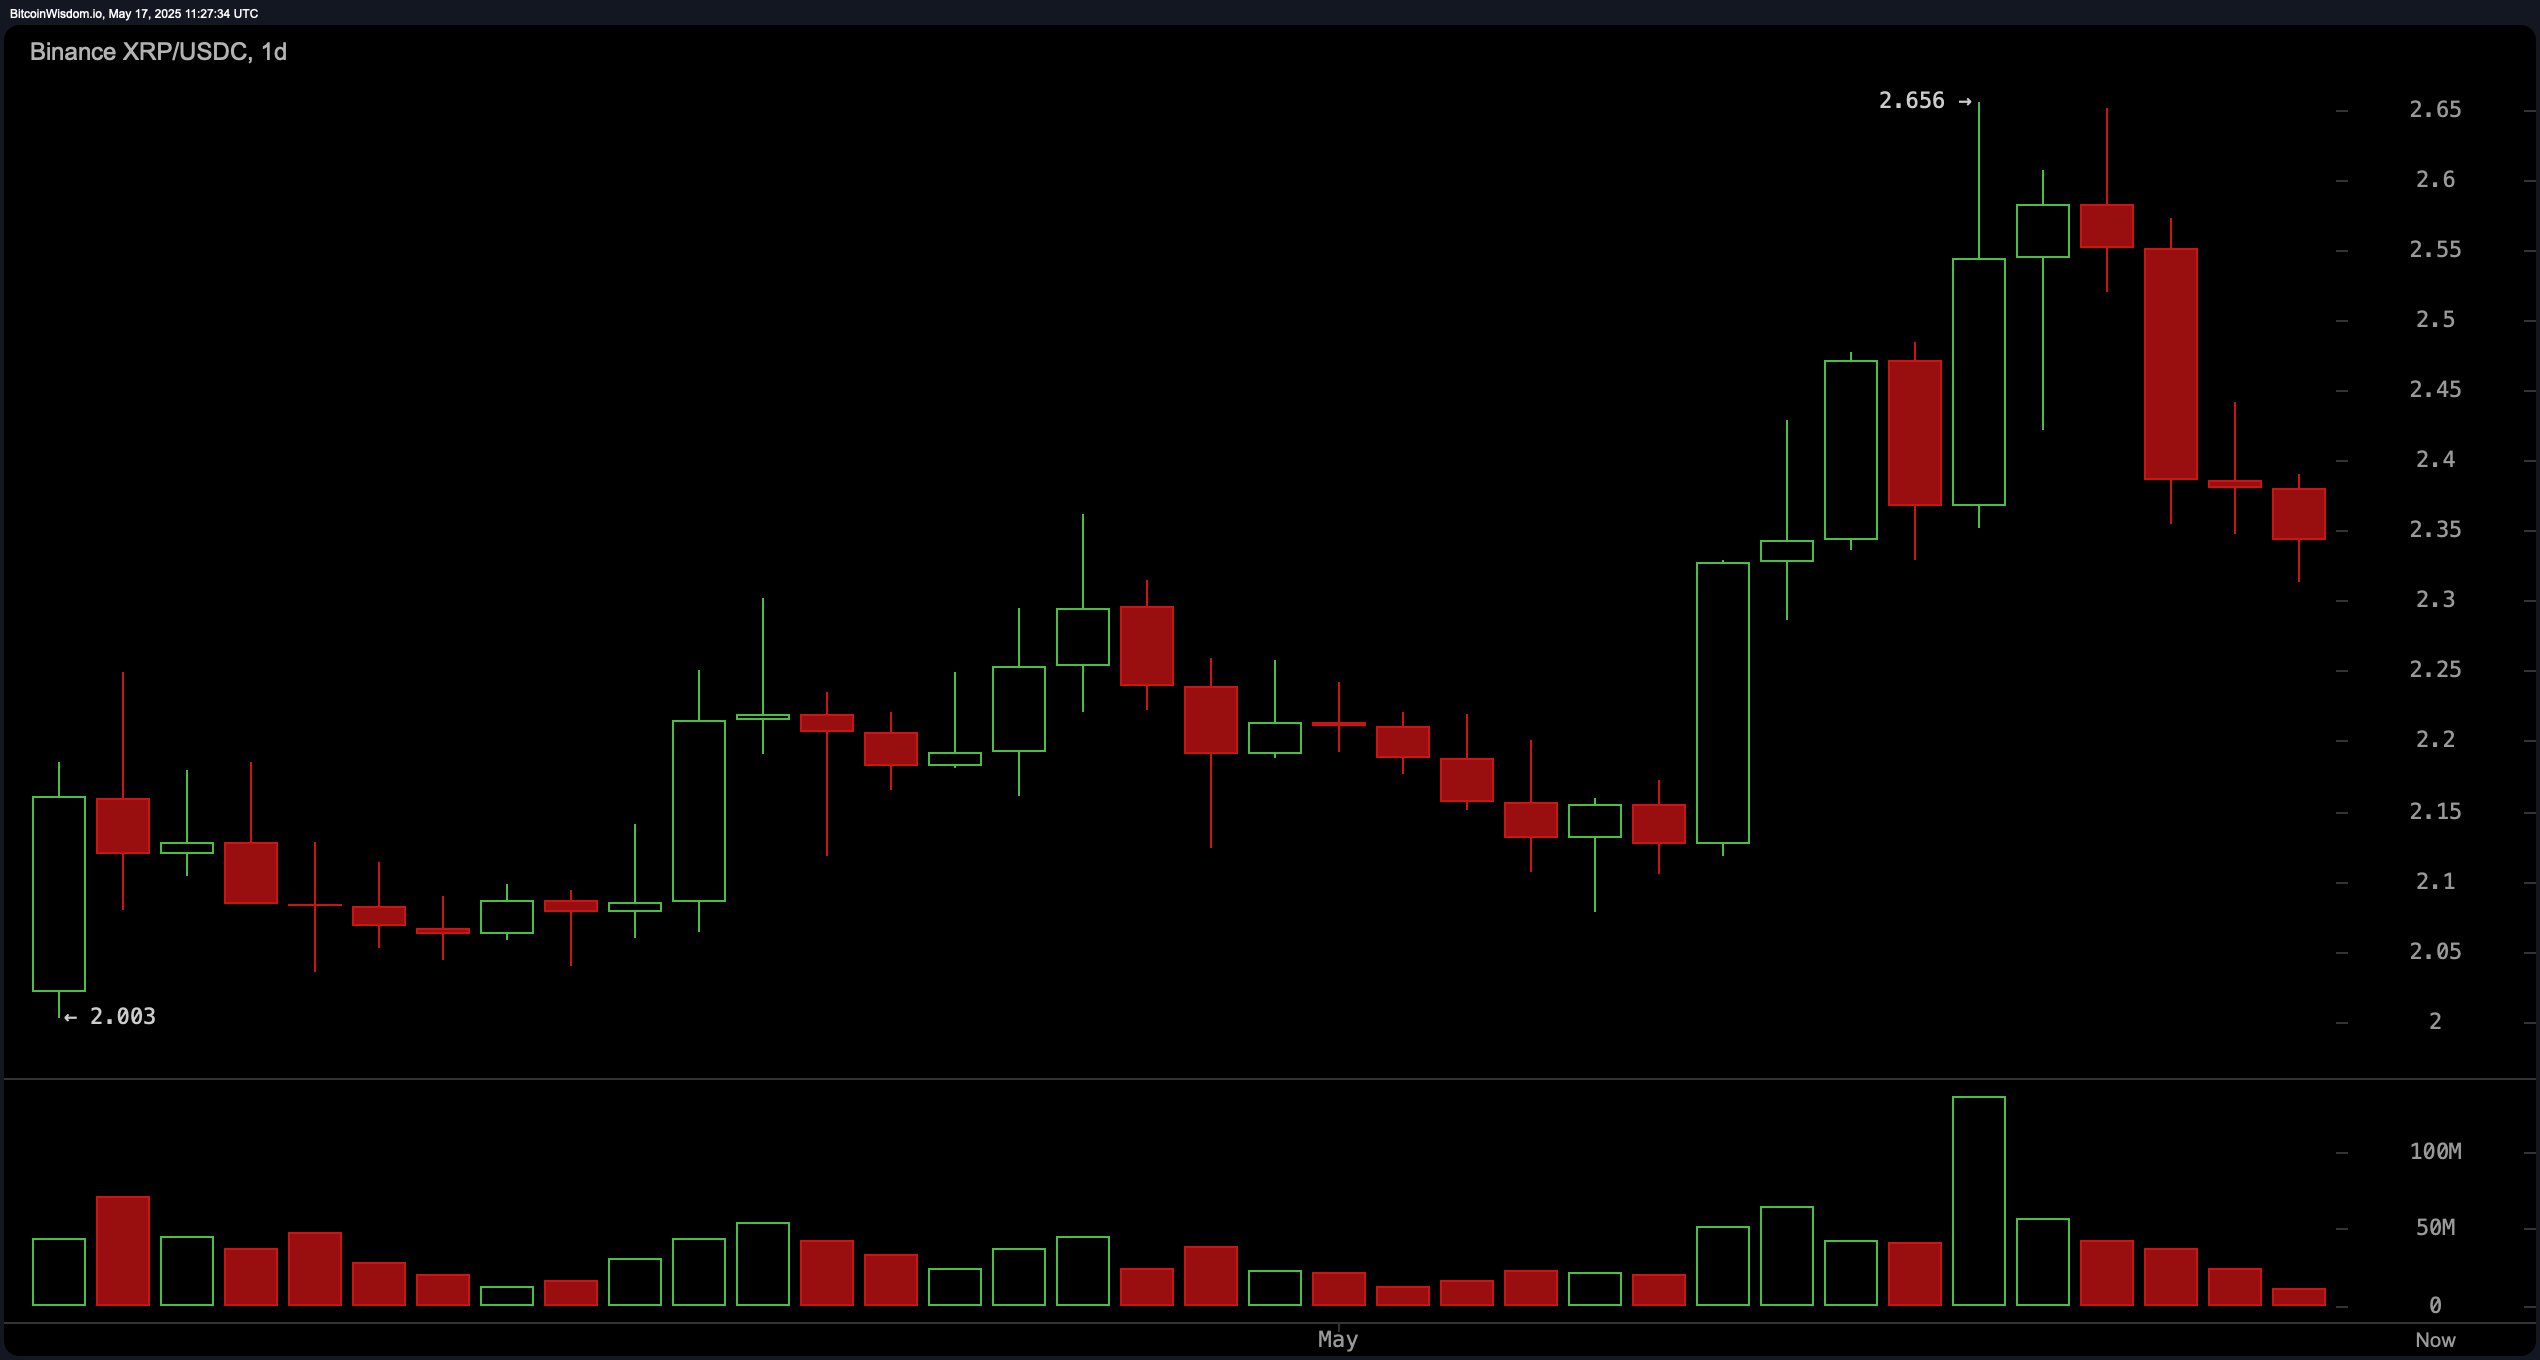
The daily chart, however, maintains a more structurally bullish outlook despite recent downward pressure. XRP has formed higher highs and higher lows over a broader time horizon, consistent with a weakening uptrend. A daily close above the $2.40–$2.45 resistance zone on significant volume would reinstate bullish confidence and open the door for a move toward previous highs near $2.60. Key to this scenario is the ability of buyers to hold the $2.30 support level, which remains a pivotal area for future price action.

XRP/USDC via Binance 1D chart on May 17, 2025.
Oscillators are showing a largely neutral stance, underscoring the current market indecision. The relative strength index (RSI) reads 52.73389, the Stochastic stands at 50.66967, and the commodity channel index (CCI) is at 22.90536—all indicating a balanced momentum profile. The average directional index (ADX) at 20.27480 suggests a weak trend strength. The Awesome oscillator registers 0.22143, also in neutral territory. The momentum, however, signals negativity, while the moving average convergence divergence (MACD) level at 0.07107 presents a bullish signal, hinting at a possible divergence between momentum and trend-following indicators.
Moving averages (MAs) present a mixed yet mildly bullish outlook. Both the exponential moving average (EMA) and simple moving average (SMA) for the 10-period frame show sell signals, with values at $2.39179 and $2.43053, respectively, indicating near-term weakness. Conversely, all other EMAs and SMAs from the 20-period to the 200-period offer buy signals. This alignment suggests that while short-term pressure is evident, the broader trend remains positive, provided key supports are maintained. The exponential moving average (200) at $2.03875 and simple moving average (200) at $2.17692 are particularly supportive of the longer-term bullish bias.
Bull Verdict:
XRP remains structurally bullish on the daily chart, with higher lows and institutional buying interest providing a foundation for recovery. If the asset holds the $2.30 support and reclaims the $2.40–$2.45 resistance zone on rising volume, it could resume its uptrend toward $2.60 and beyond, reinforcing longer-term bullish momentum.
Bear Verdict:
Despite a broader uptrend, short-term charts show significant weakness, with both the 1-hour and 4-hour timeframes in clear downtrends. Failure to defend the $2.30 support could trigger a deeper retracement toward $2.20 or even $2.10, confirming a bearish short-term scenario driven by fading momentum and growing sell volume.
免责声明:本文章仅代表作者个人观点,不代表本平台的立场和观点。本文章仅供信息分享,不构成对任何人的任何投资建议。用户与作者之间的任何争议,与本平台无关。如网页中刊载的文章或图片涉及侵权,请提供相关的权利证明和身份证明发送邮件到support@aicoin.com,本平台相关工作人员将会进行核查。


