
In April, the gentleman reminded Beautiful Valley and Big Cake that there was an opportunity to test the completion of the shark pattern at 0.886, which Big Cake has already reached. Beautiful Valley gapped up last night with a significant increase. On the 11th, it was noted that Beautiful Valley was nearing the end of its upward trend, very close to 0.886 and the rising trend line, so attention should be paid to whether a reversal will occur.
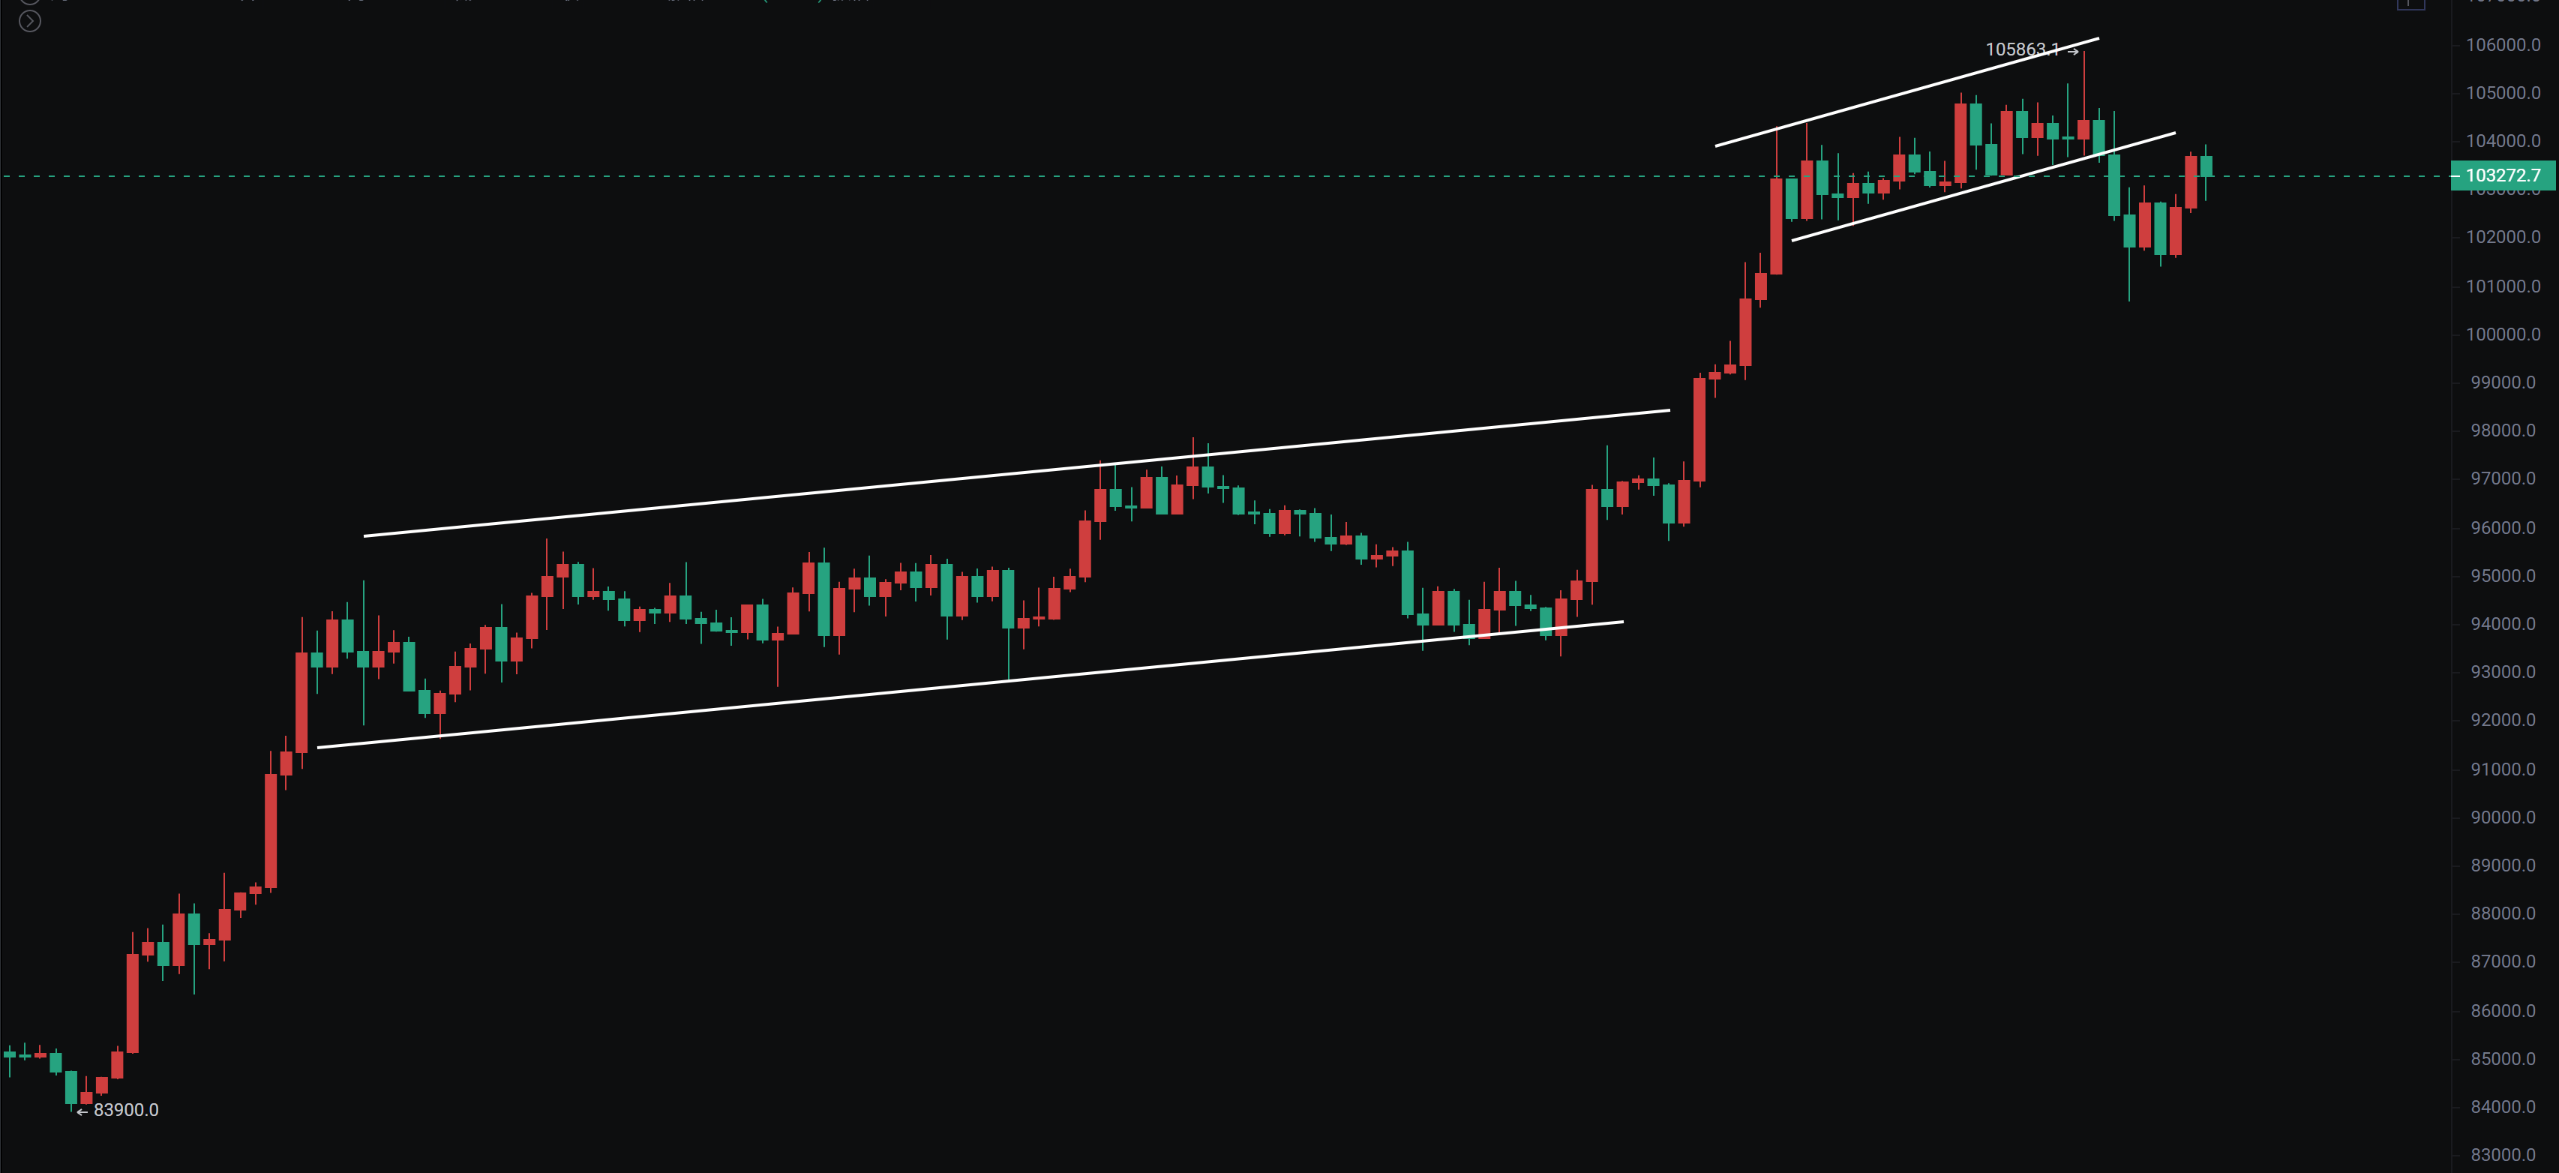
Big Cake's weekly chart has seen five consecutive bullish candles with an increase of over 40%. The MACD has crossed the zero line, and the fast and slow lines have intersected. A short-term pullback is still in a bullish trend. On the daily chart, the shark pattern has completed with a maximum touch of 105863, which is 4000 points away from the previous high of 110000, representing a potential increase of 3.76%. For swing traders, especially those in spot trading, there is no need to be overly rigid about bottom fishing or top picking; just aim to catch the good moves and consider reducing positions, then re-enter on a pullback.
Big Cake
Given that Beautiful Valley rebounded strongly yesterday, Big Cake is still affected. It has been pulled up ahead of the CPI announcement, so watch for any spikes around 106000; it may oscillate here for a few more days.
The 4-hour chart shows that the rising channel has been broken twice; if the rebound cannot return to the rising channel, there is a risk of continued decline. However, do not expect the pullback to be too deep unless an unexpected event occurs. Pay attention to the daily rising trend line.
Support: 92000—96500—100678
Resistance: 110000
Ethereum
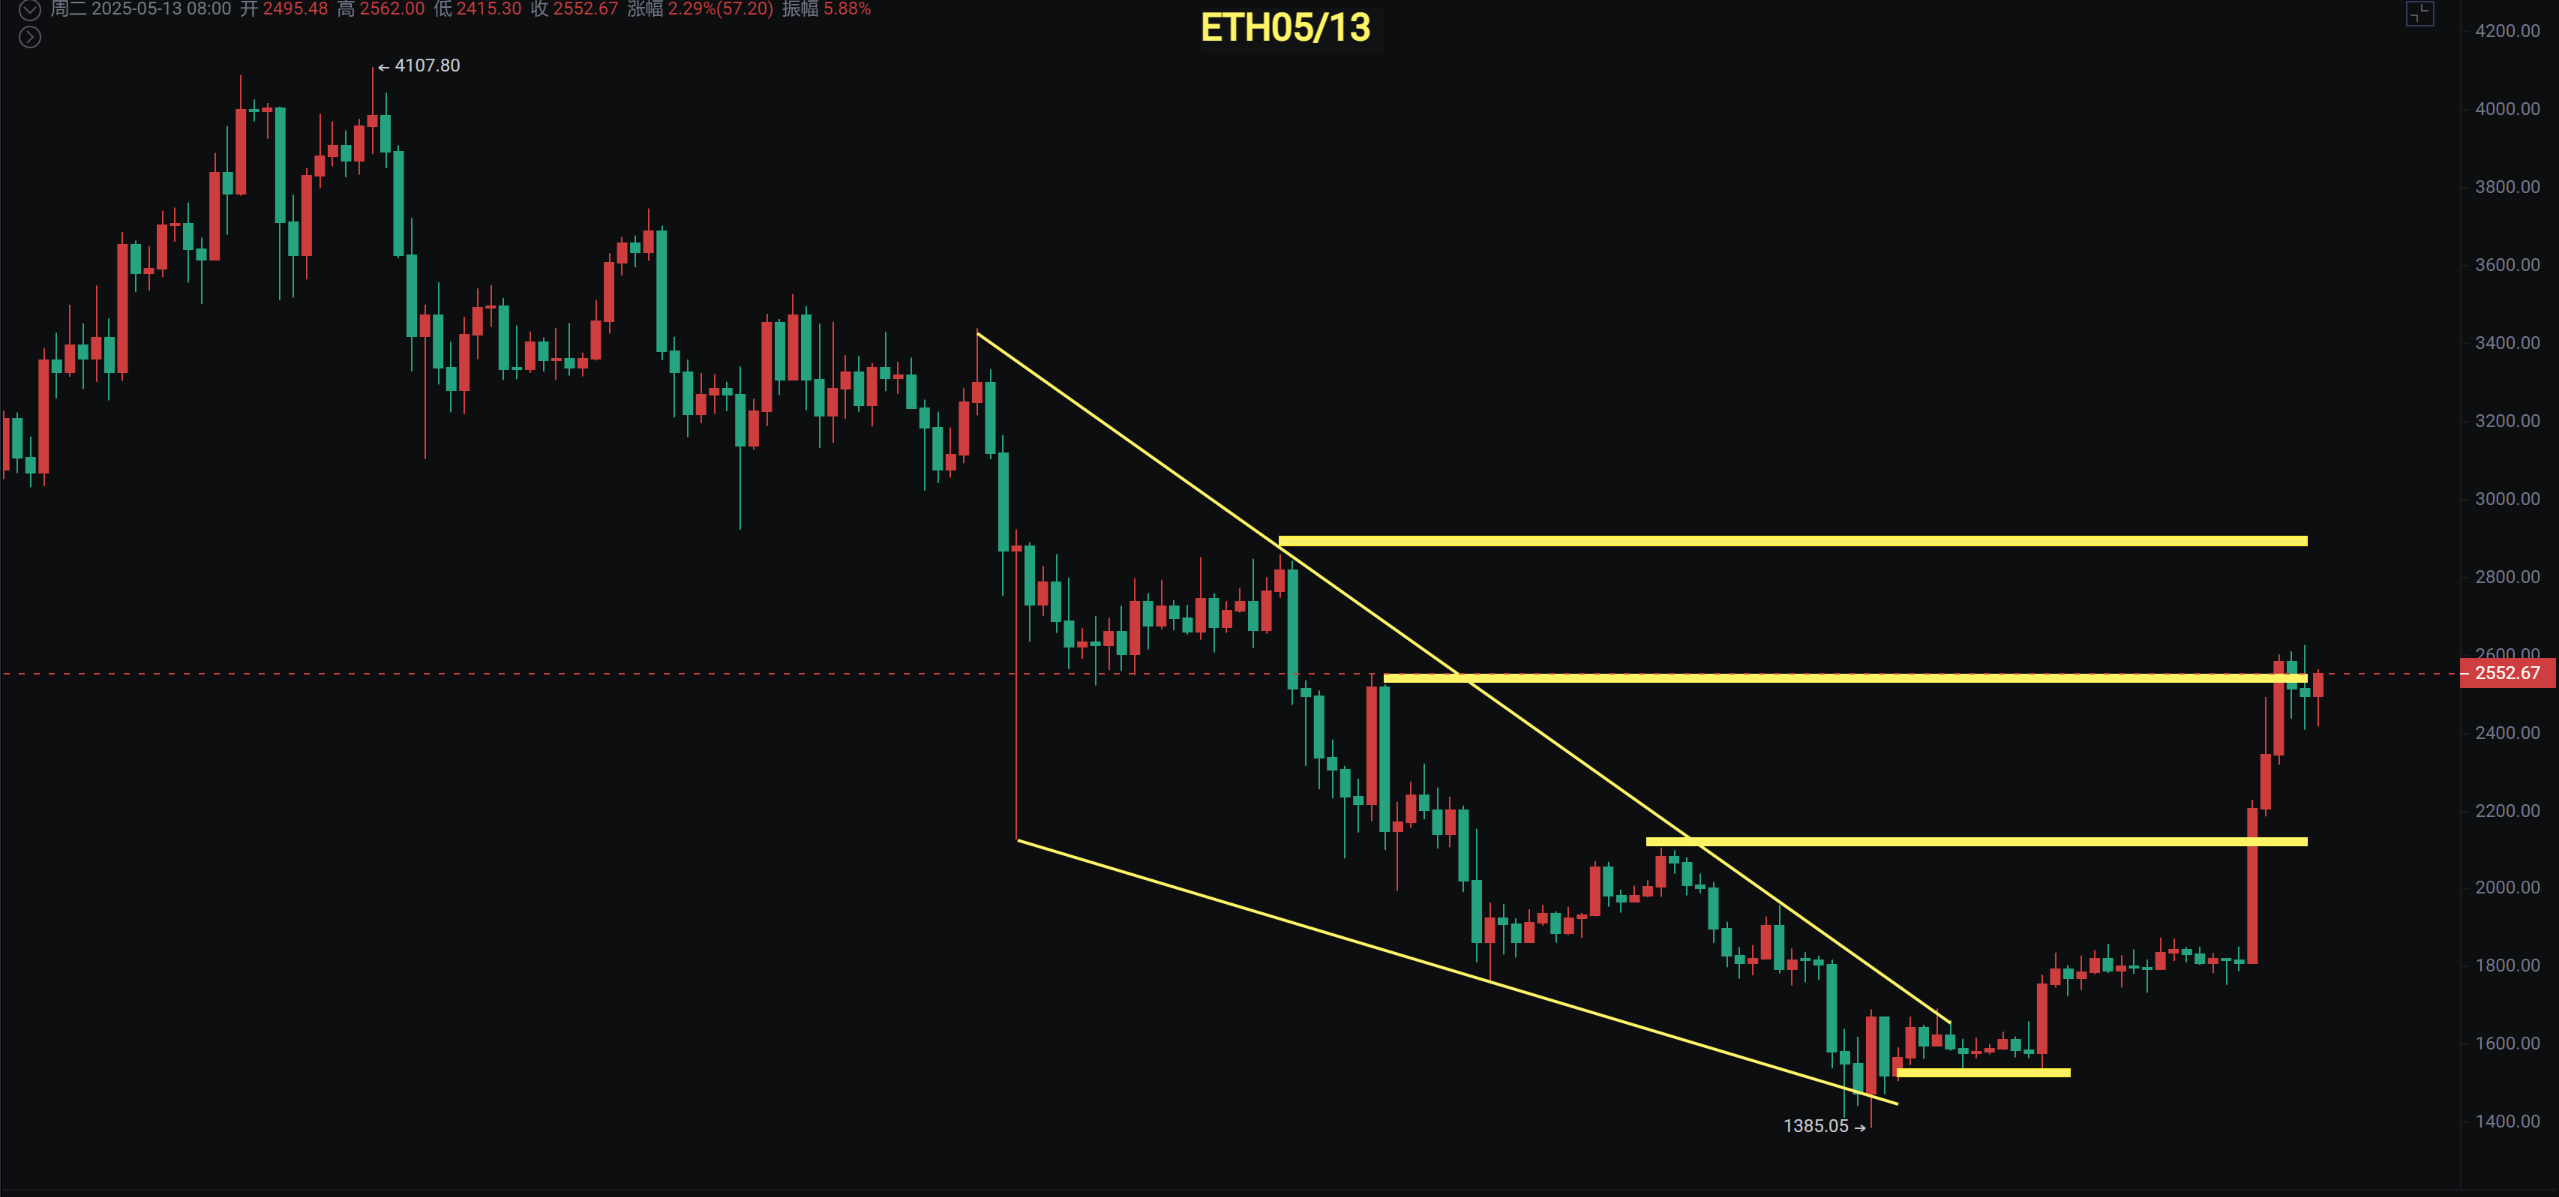
Ethereum and altcoins are still taking turns to rebound. Moving forward, continue to focus on short-term trades as they rebound. Many people see Ethereum rebound by dozens of points over a few days and think it’s doing well. Ethereum is still in a state of oversold rebound; note that in the past two years, the large fluctuations have been between 50—80%, with other times either oscillating or pulling back.
The daily chart has consistently found support around 2400, so first pay attention to this platform support and look for a pullback opportunity around 2100—2200.
Support: 2100—2200
Resistance: 2856—3200
If you like my views, please like, comment, and share. Let's navigate through the bull and bear markets together!!!
This article is time-sensitive and for reference only; it is updated in real-time.
Focusing on K-line technical research, sharing global investment opportunities. Public account: BTC Trading Gentleman Fusu

免责声明:本文章仅代表作者个人观点,不代表本平台的立场和观点。本文章仅供信息分享,不构成对任何人的任何投资建议。用户与作者之间的任何争议,与本平台无关。如网页中刊载的文章或图片涉及侵权,请提供相关的权利证明和身份证明发送邮件到support@aicoin.com,本平台相关工作人员将会进行核查。


