XRP’s short-term technical setup on the 1-hour chart exhibits a bullish trend, having steadily climbed from $2.03 to $2.14 since April 20. The pattern currently forming suggests a bullish flag, typically indicative of potential continuation in price movement, assuming volume aligns with the trend. Price action is consolidating just above the $2.11 level, where it has shown resilience amid minor pullbacks. Confirmation of support at $2.10 or a clean breakout above $2.14 would strengthen the bullish case. For traders managing risk, stops below $2.08 appear prudent while keeping exit targets between $2.20 and $2.25 in view.
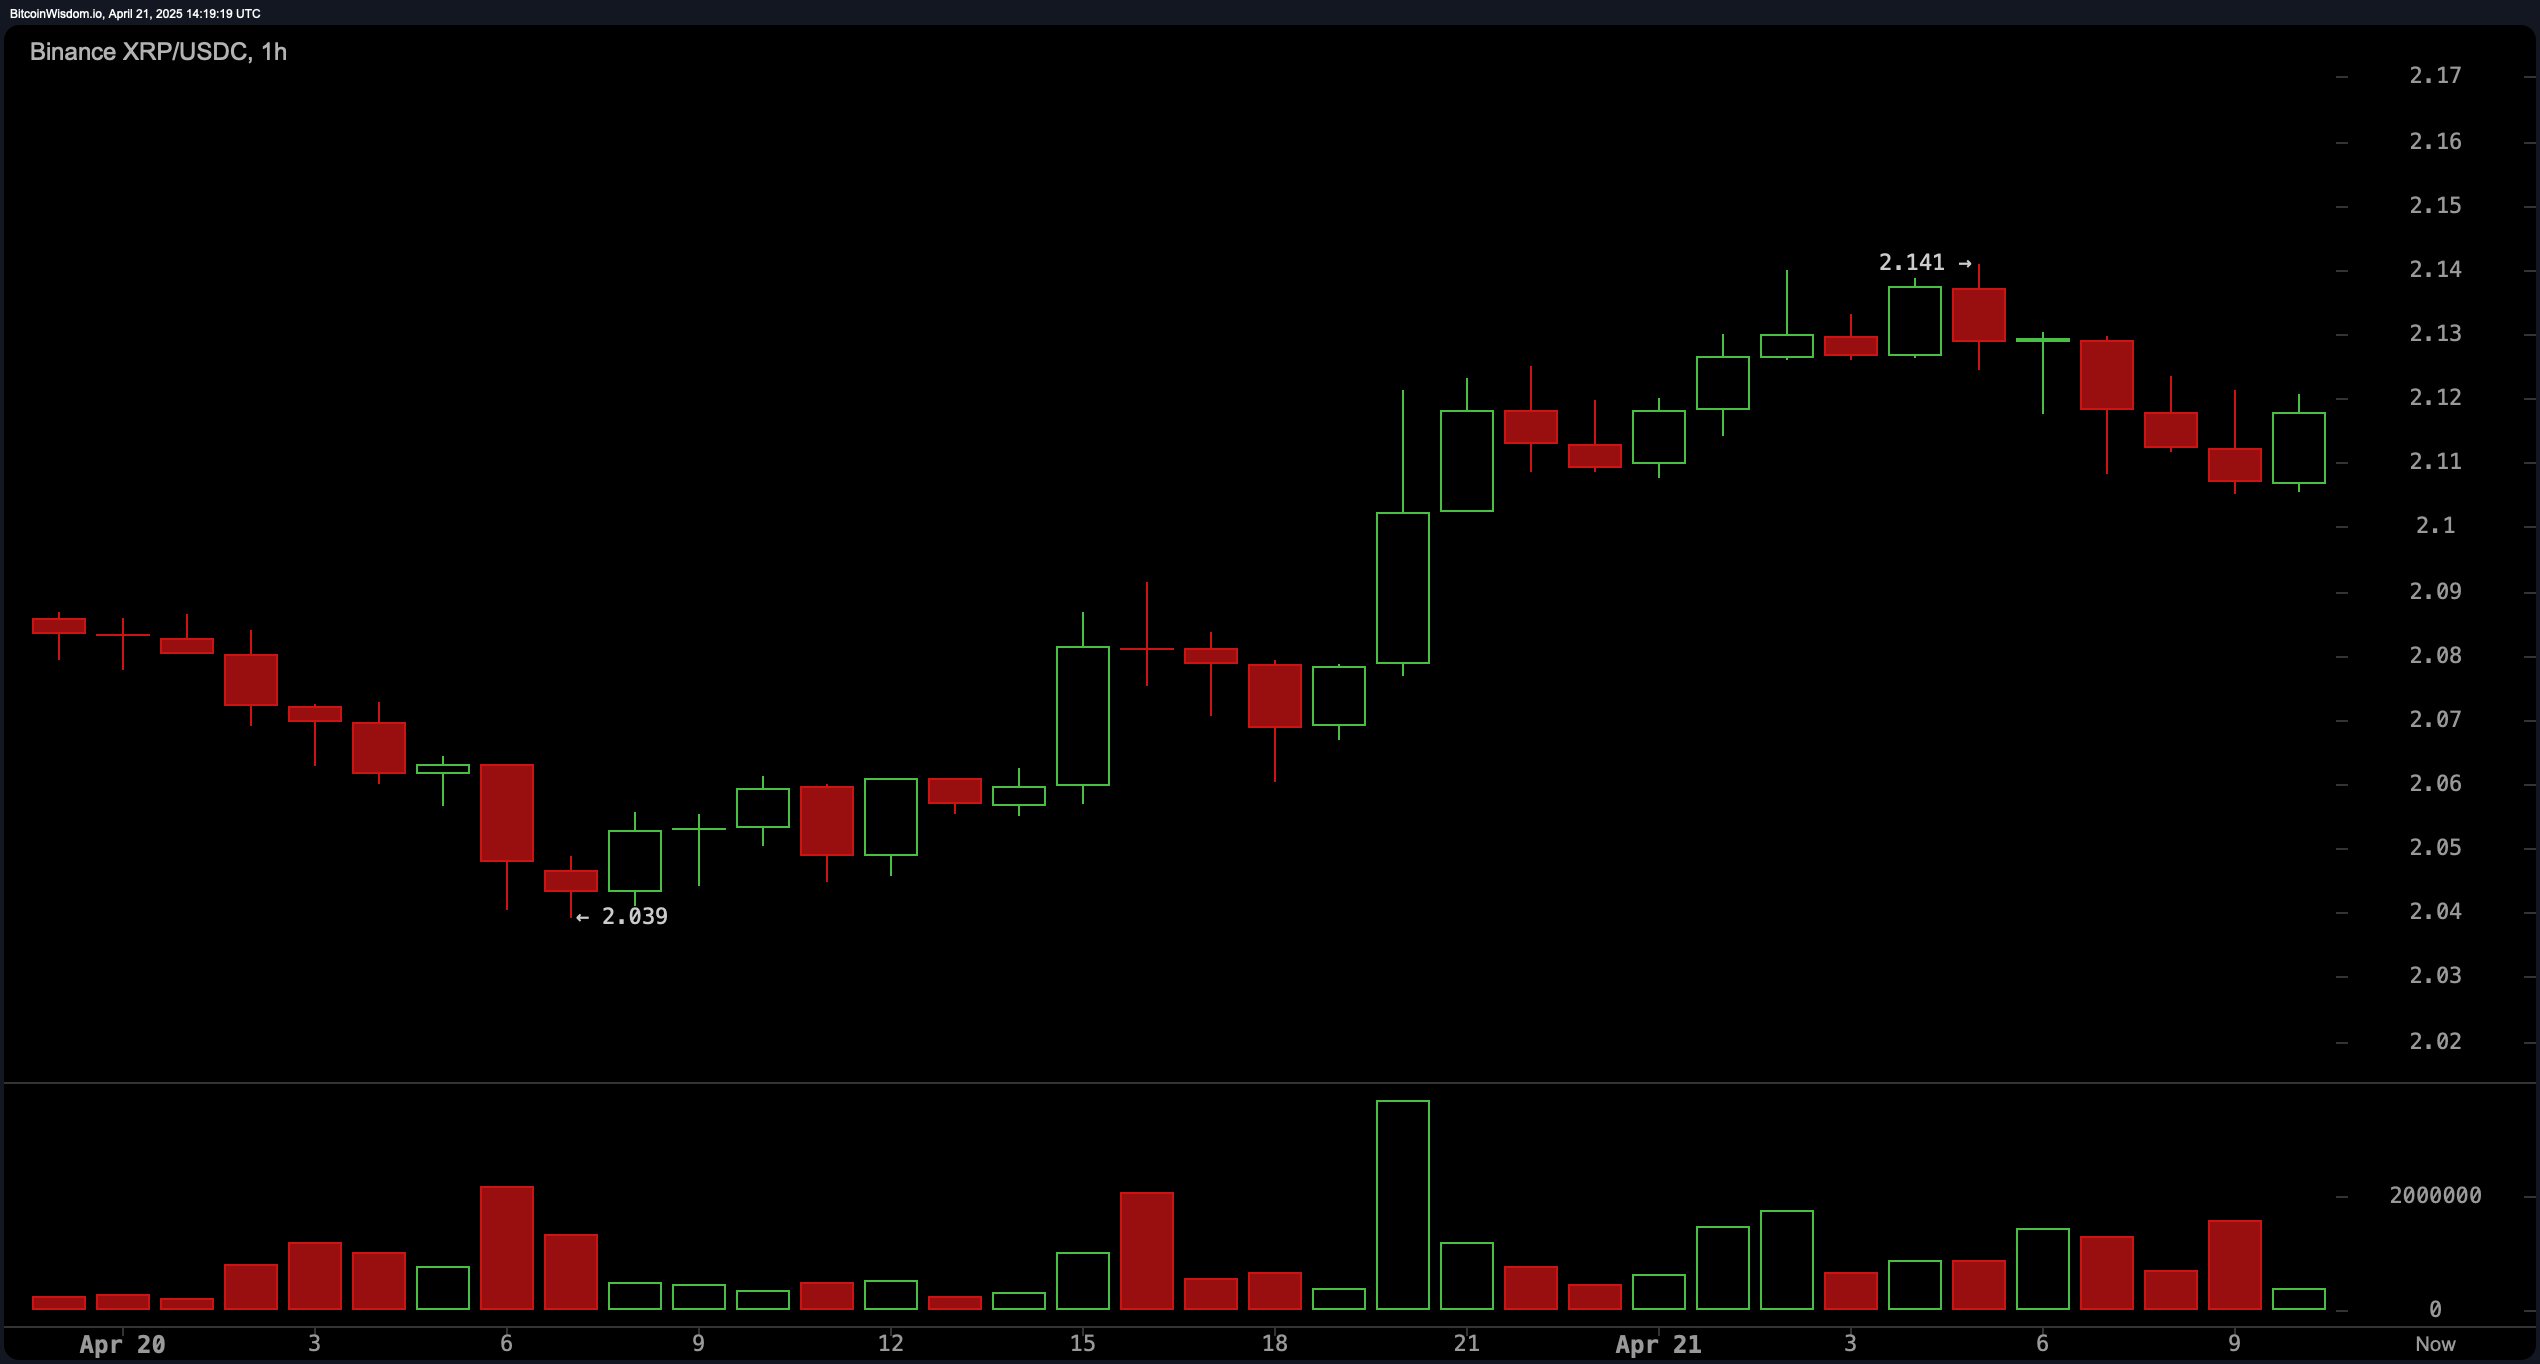
Binance XRP/USDC 1H chart on April 21, 2025.
On the 4-hour chart, XRP continues to consolidate within a broadening range from $2.03 to $2.14, underpinned by the formation of higher lows—a characteristic early indicator of accumulation. The slight upward bias in this time frame is reinforced by increasing volume on green candles, pointing to a potential bullish divergence. A recent wick testing $2.14 suggests market appetite is building, though a definitive breakout remains pending. Should the asset break and retest this upper boundary convincingly, a move toward $2.20–$2.25 could materialize, provided volume supports the breakout.
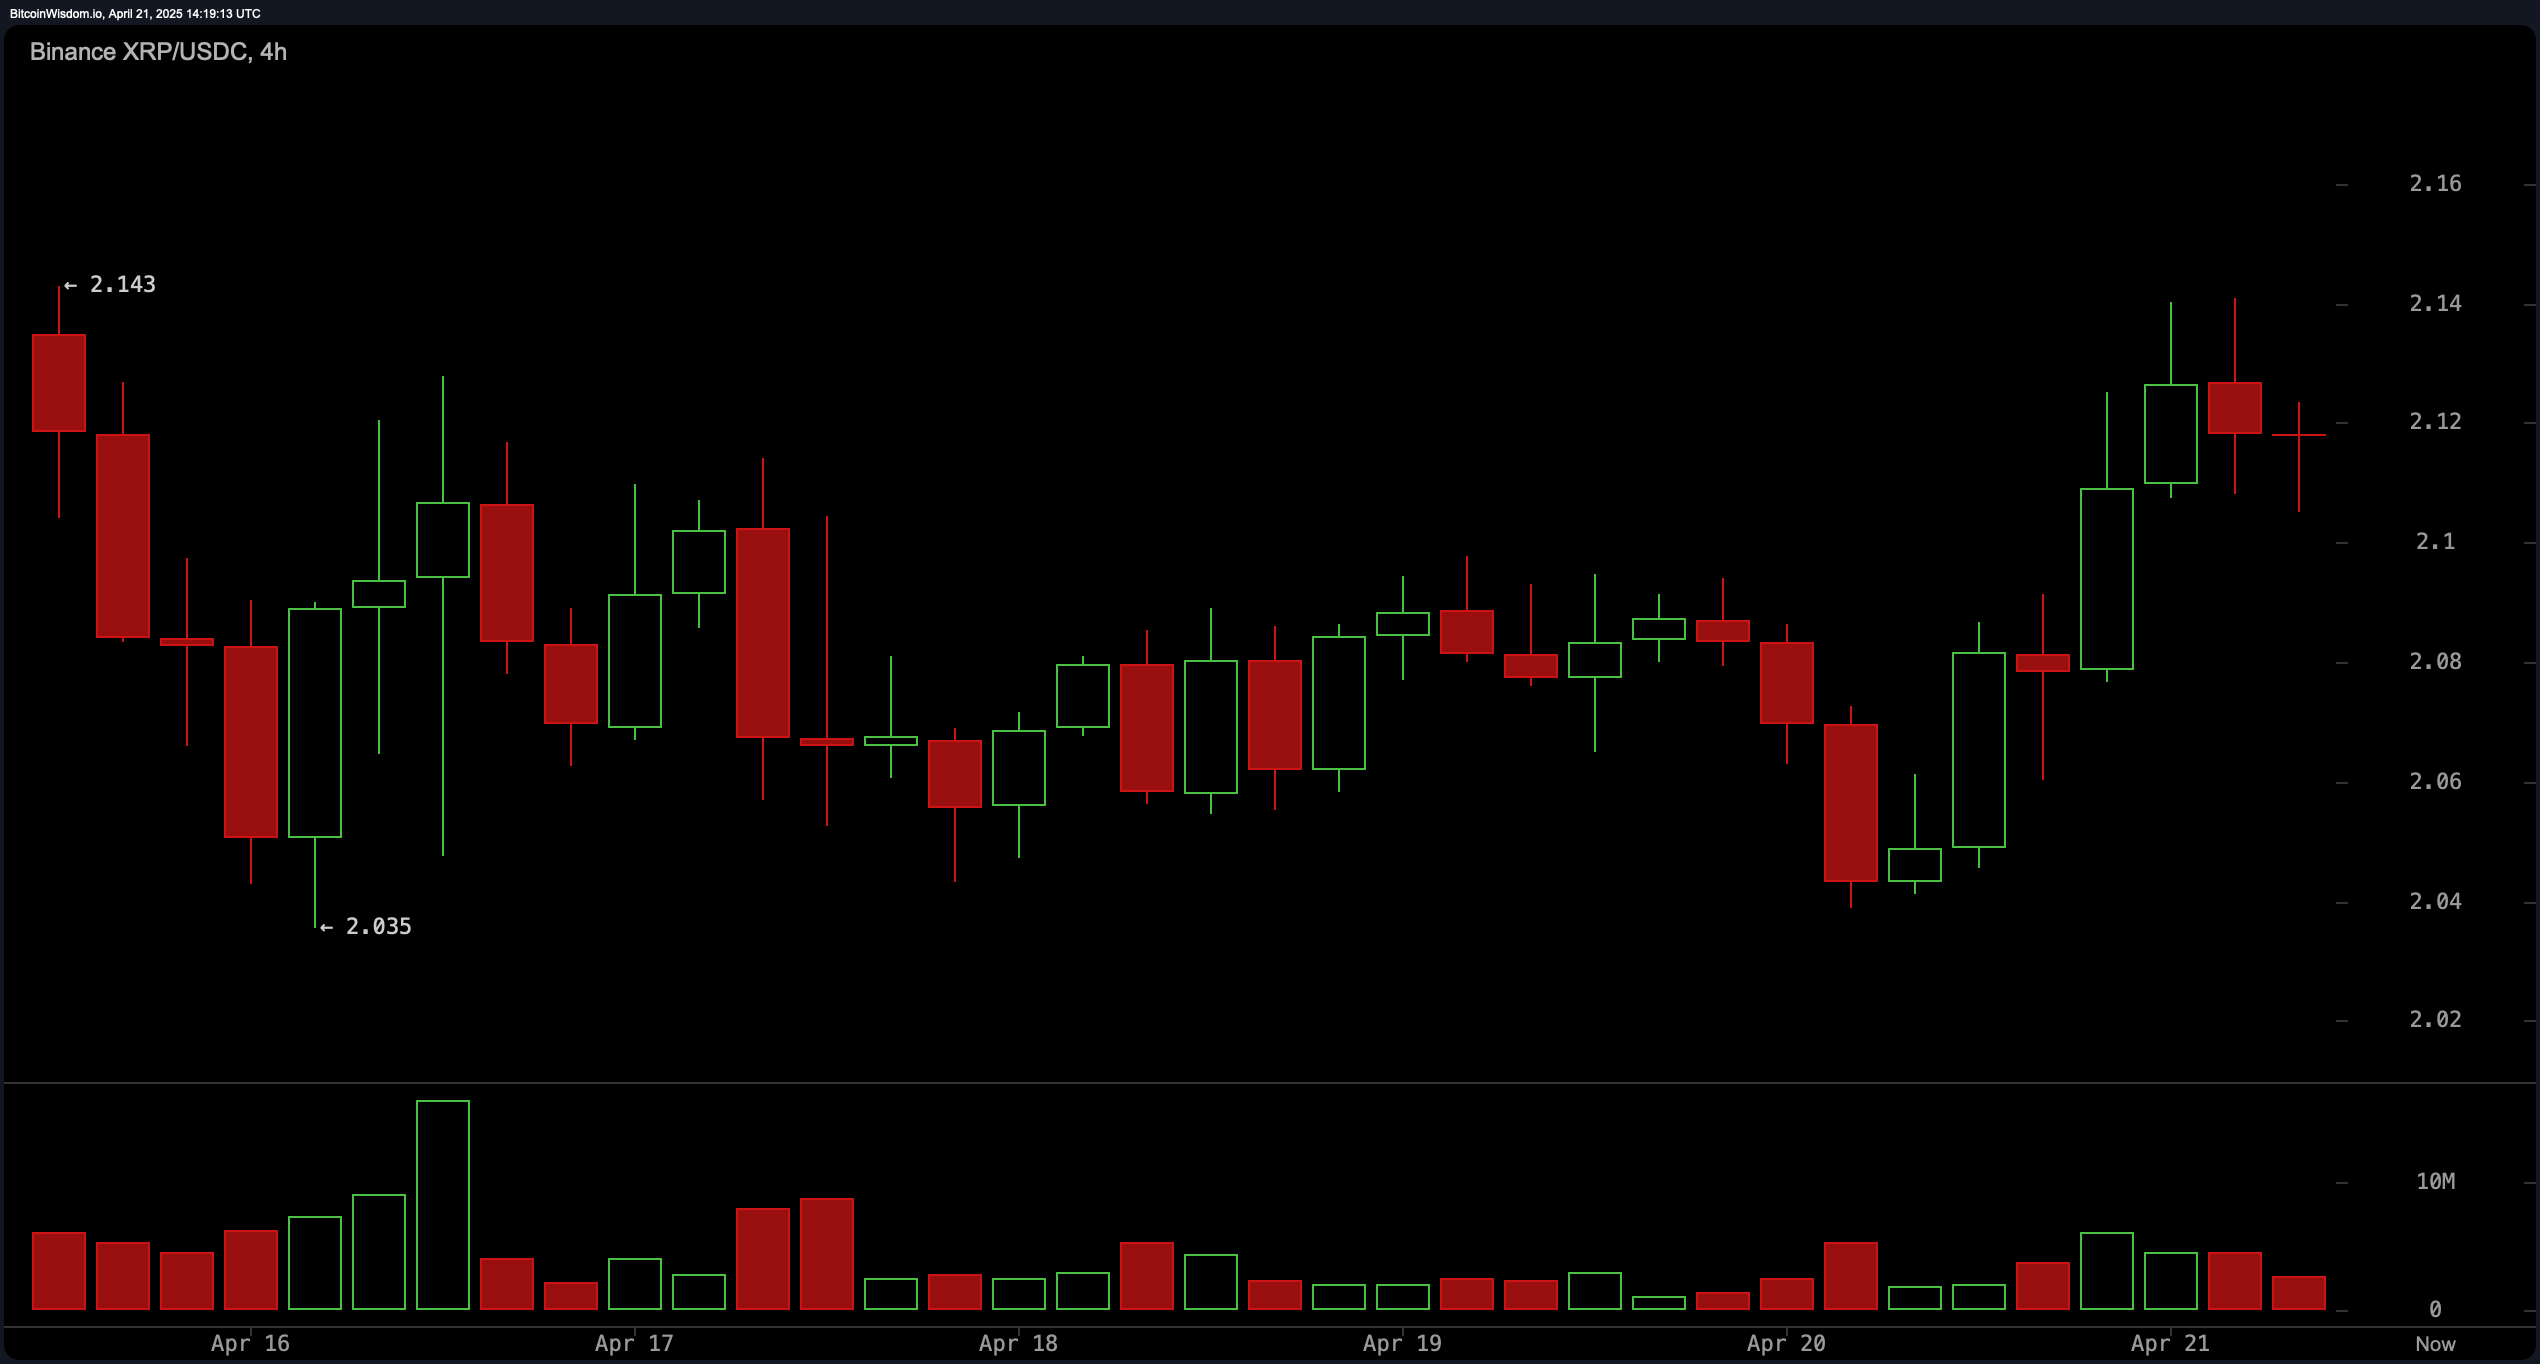
Binance XRP/USDC 4H chart on April 21, 2025.
The daily chart presents a broader perspective of a market recovering from its recent downtrend, having rebounded from a significant low of $1.61 after a prolonged bearish phase. XRP is currently trading in a range-bound consolidation between $2.10 and $2.12, suggesting a market in pause, possibly preparing for its next directional move. The support at $1.61 remains structurally significant, while resistance looms in the $2.20–$2.30 band. The price action indicates an accumulation phase, and if the $2.20 resistance is breached with convincing volume, the stage may be set for a more sustained upside.
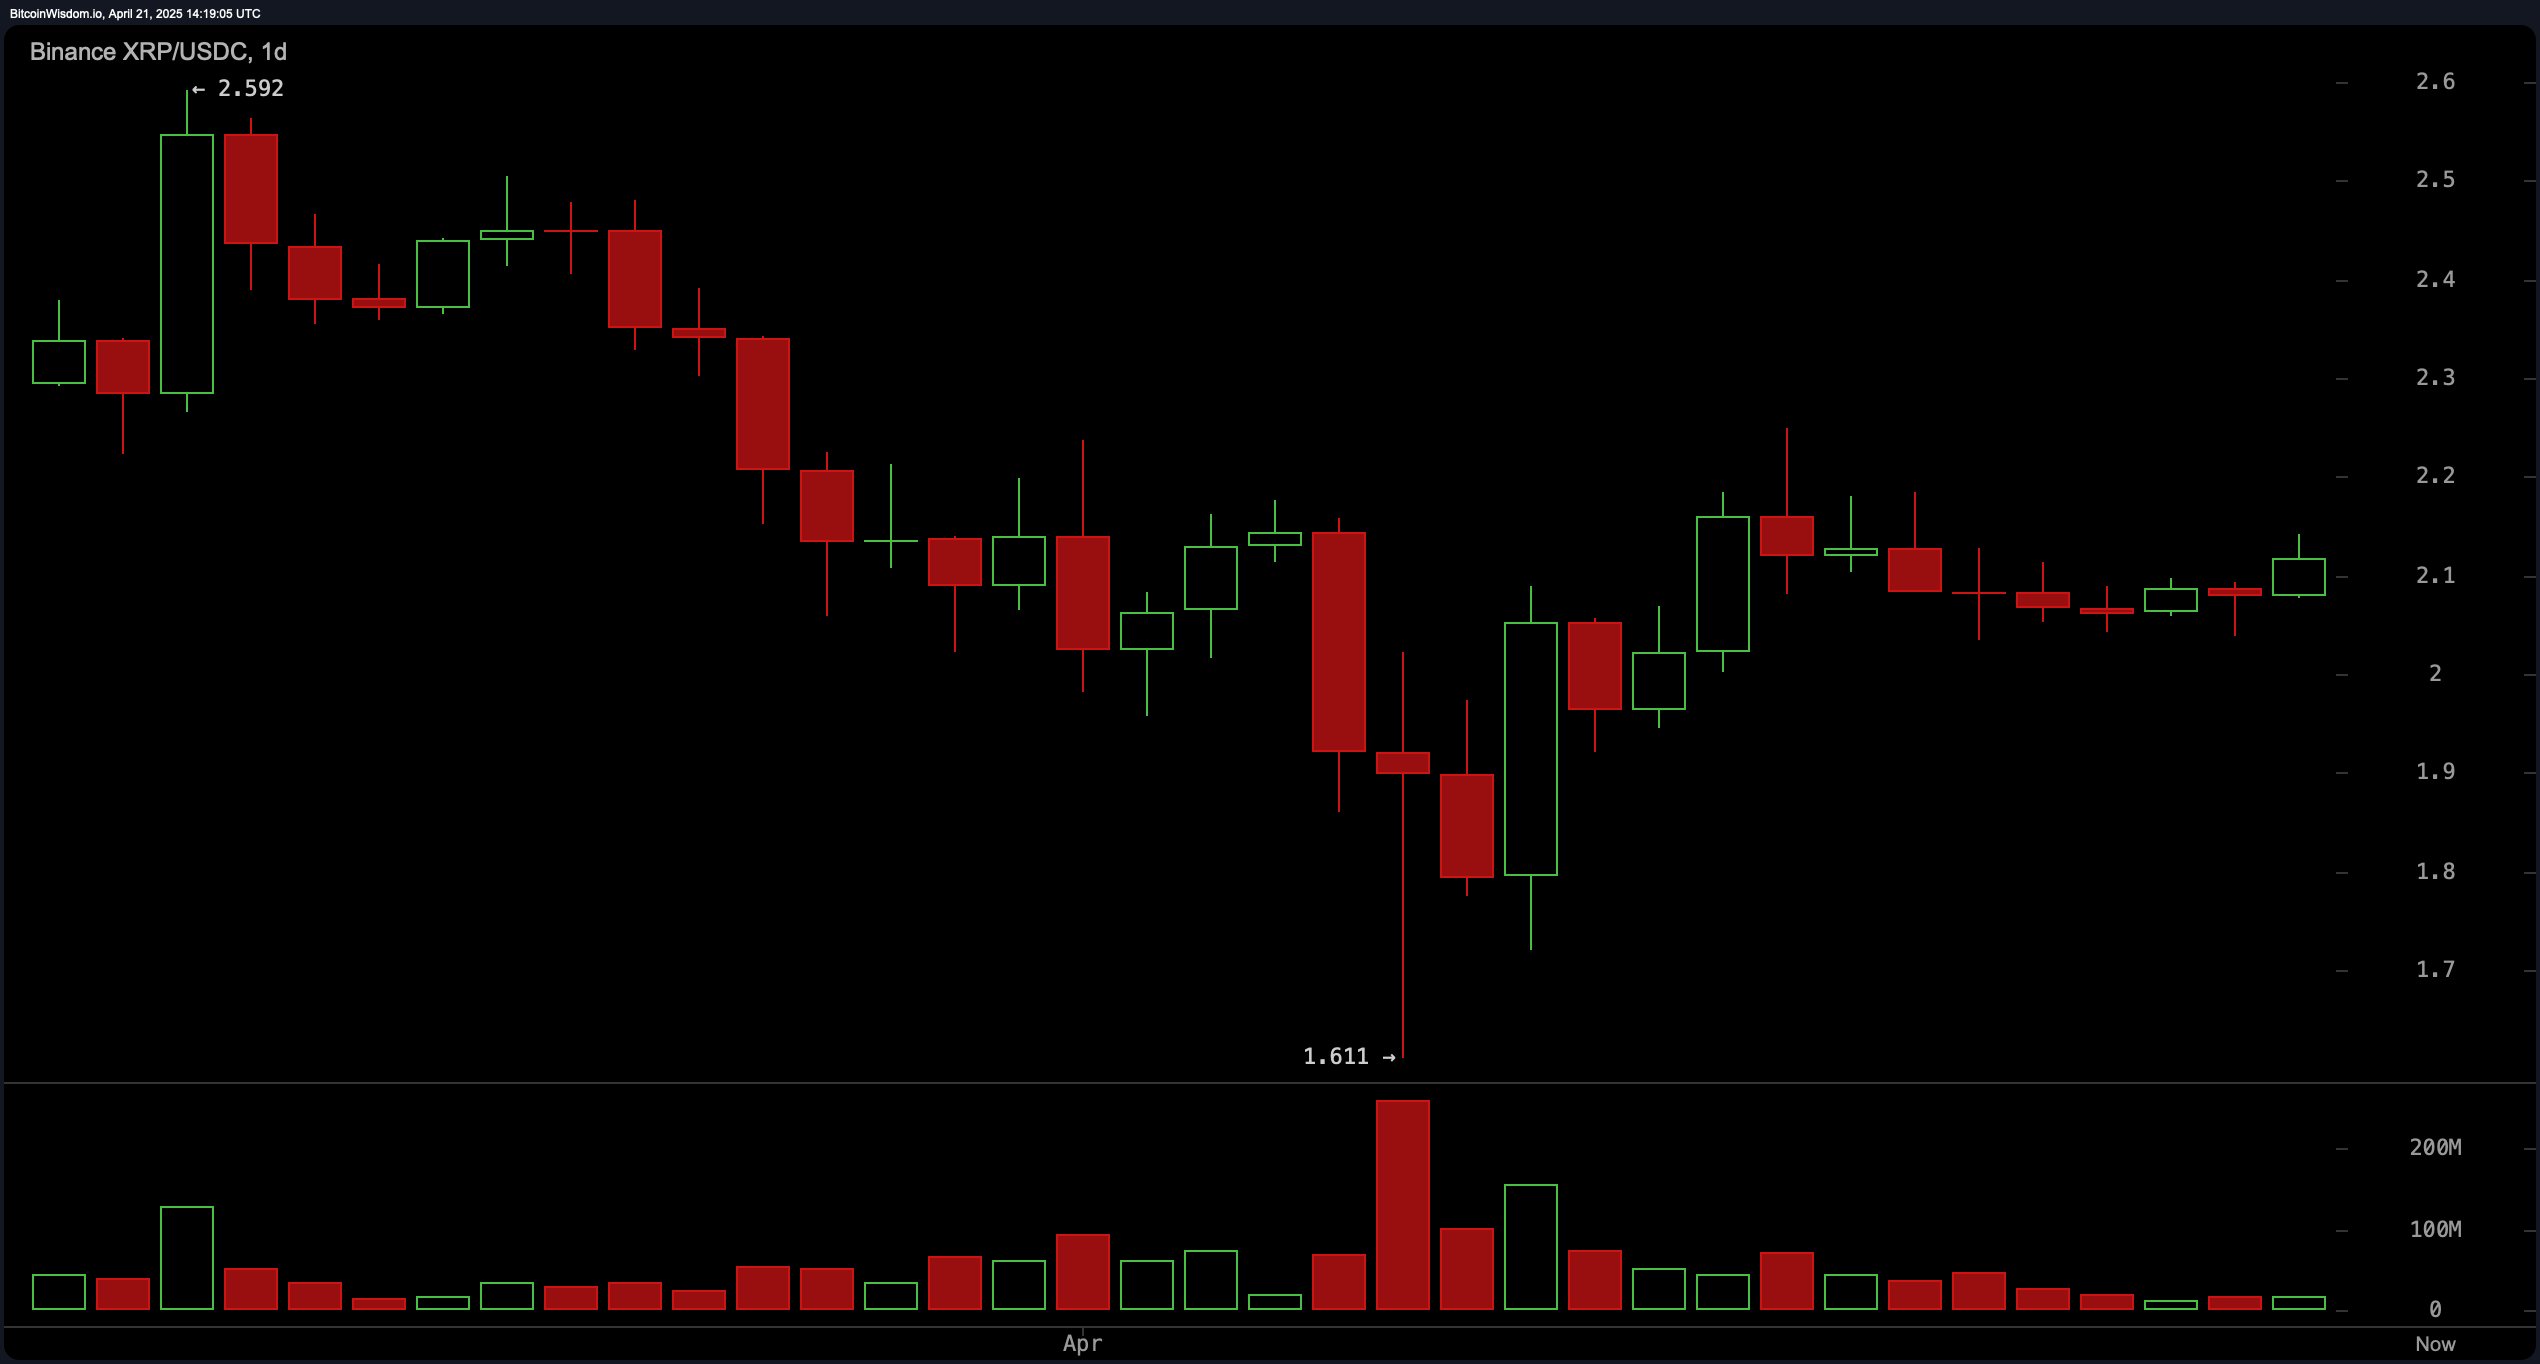
Binance XRP/USDC 1D chart on April 21, 2025.
Among oscillators, the relative strength index (RSI) stands at 49.84136, the Stochastic at 74.60660, the commodity channel index (CCI) at 59.93883, the average directional index (ADX) at 20.39190, and the Awesome oscillator at −0.08080, all reflecting neutral sentiment. Momentum at 0.09519 suggests a minor negative bias, whereas the moving average convergence divergence (MACD) level at −0.03369 flashes a bullish signal, highlighting market indecision with potential for direction once confirmation arrives.
Moving averages provide a nuanced picture: the 10-period exponential moving average (EMA) at $2.08240 and simple moving average (SMA) at $2.09834 signal positivity, as do the 20-period EMA and SMA. However, the 30-, 50-, and 100-period EMAs and SMAs all register bearish signals, suggesting mid-term negative overhang. Notably, the 200-period EMA and SMA, at $1.96321 and $1.94896, respectively, both signal bullishness—implying that long-term trend momentum remains constructive despite short-term volatility. This layered divergence across timeframes emphasizes the importance of volume as the next catalyst for directional clarity.
Bull Verdict:
If XRP maintains support above $2.10 and breaks through $2.14 with conviction and volume, the bullish flag on the 1-hour chart and ascending structure on the 4-hour chart could confirm a push toward $2.20–$2.30. Reinforced by long-term moving averages flashing buy signals, a sustained uptrend remains firmly on the table, especially if accumulation continues and market sentiment improves.
Bear Verdict:
Failure to hold the $2.10–$2.11 support zone could unravel the short-term bullish setup, opening the door to a retest of lower support near $2.05 or even $2.00. With mid-term moving averages still tilted bearish and oscillators largely neutral, XRP could slip into a corrective phase if buying momentum fails to materialize at current levels.
免责声明:本文章仅代表作者个人观点,不代表本平台的立场和观点。本文章仅供信息分享,不构成对任何人的任何投资建议。用户与作者之间的任何争议,与本平台无关。如网页中刊载的文章或图片涉及侵权,请提供相关的权利证明和身份证明发送邮件到support@aicoin.com,本平台相关工作人员将会进行核查。


