
1. Market Observation
Keywords: OM, ETH, BTC
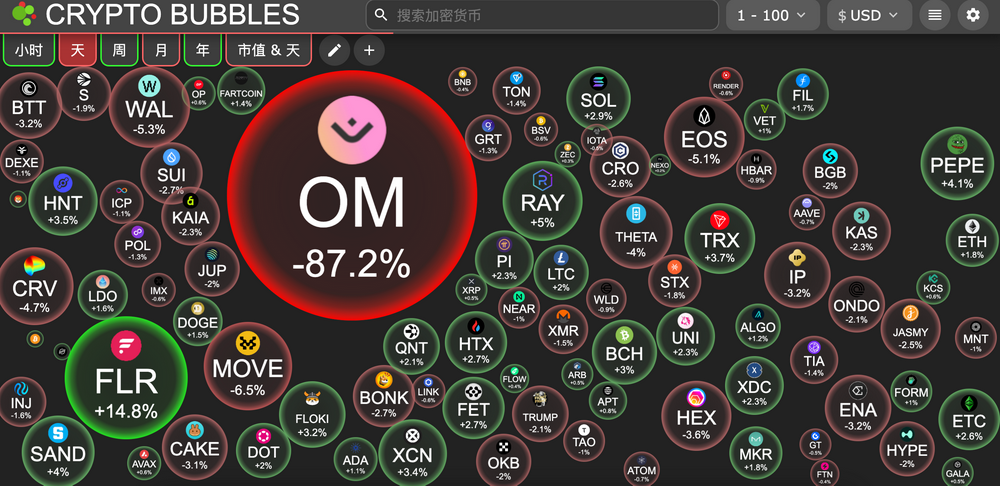
The RWA sector project MANTRA (OM) plummeted this morning, with the price dropping from $6.35 to $0.38 in a short period, resulting in a market value evaporation of over $5.5 billion. In response to market panic, the MANTRA team quickly issued a statement attributing the drop to "irrational liquidation," emphasizing that it was unrelated to the project's fundamentals. However, a closer look reveals that OM has experienced multiple violent surges since last November, and it has already been labeled as a "strongly manipulated token" within the community. Community analysis has uncovered numerous structural issues with MANTRA, including high control over the supply, repeated modifications to airdrop rules, and the team controlling 90% of the supply, which has led to a very low actual circulation, making the price easily manipulable, ultimately triggering this crash. Additionally, the market saw the $RFC market cap on the Solana chain surpassing $100 million, becoming the only meme coin to break the billion mark recently, while similar parody derivatives like $DB and the meme coin $MUTUMBO, which gained attention from Ansen's promotion, also emerged.
Despite increased global market volatility, BTC whale investors have not exited the market. According to data analysis from CryptoQuant, the current behavior pattern of BTC whales is highly similar to the accumulation phase during the sideways consolidation period last August-September, indicating that large funds are still strategically positioning themselves. Although the S&P volatility index has surged to its highest level since last August, clearly showing that market uncertainty is rising, the ratio of Bitcoin to VIX has reached a long-term trendline support level. Historical data indicates that whenever the Bitcoin/VIX ratio touches this trendline, it often marks a temporary bottom for Bitcoin prices, followed by a significant rebound, providing technical support for the current market. BitMEX co-founder Arthur Hayes boldly predicts that if the current market situation persists, Bitcoin may enter a "only up, no down" mode. Meanwhile, Bitget Research's chief analyst Ryan Lee predicts that BTC prices may fluctuate between $80,000 and $85,000, advising traders to closely monitor macroeconomic conditions and capital flows. Notably, Andrew Kang, co-founder of Mechanism Capital, recently went long on BTC at $77,000 with 40x leverage, doubling his Bitcoin holdings to $200 million, and has already realized a profit of $6.8 million.
In the regulatory arena, Tim Scott, chairman of the U.S. Senate Committee on Banking, Housing, and Urban Affairs, recently sent positive signals, expecting that the cryptocurrency market structure bill will officially become law by August 2025. He also noted that the Senate Banking Committee has advanced a comprehensive stablecoin regulatory bill—the GENIUS Act—by March 2025, indicating that U.S. legislative bodies are prioritizing crypto policy. Additionally, the tariff exemption policy announced by Trump over the weekend, particularly the exemptions for semiconductors and computer components, has been interpreted by the market as a long-term positive for the crypto ecosystem. These core components are crucial for cryptocurrency mining, blockchain infrastructure development, and the creation of AI-based crypto tools. This policy indirectly boosted confidence in the crypto market, pushing Bitcoin prices rapidly back up to $85,900.
However, the global macroeconomic situation is facing significant challenges, with several Wall Street giants issuing warnings. Larry Fink, CEO of BlackRock, warned that the U.S. may have already begun entering an economic recession, citing escalating economic pressures and protectionist trade policies as primary drivers. Meanwhile, Jamie Dimon, CEO of JPMorgan, stated that he is preparing for potential chaos in the nearly $30 trillion U.S. Treasury market and expects the Federal Reserve to act only when the market begins to panic. According to data from the U.S. Treasury in January, Japan holds $1.079 trillion in U.S. Treasury bonds, ranking first, followed by China with $760.8 billion. Against the backdrop of increasing global economic uncertainty, the gold market has performed well, with spot gold prices breaking historical highs to $3,245.45 per ounce. Major investment banks have raised their gold price forecasts: Goldman Sachs expects gold prices to reach $3,700 by the end of the year, potentially even $4,500 in extreme cases; UBS has also raised its forecast to $3,500, believing that Chinese investors have strong buying potential. As the global order is restructured, the continuous growth in demand for gold from central banks will provide long-term support for gold prices.
2. Key Data (As of April 14, 12:00 HKT)
(Data Source: Coinglass, Upbit, Coingecko, SoSoValue, GMGN, Tomars)
Bitcoin: $84,781.34 (Year-to-date -9.58%), Daily Spot Trading Volume $30.943 billion
Ethereum: $1,637.32 (Year-to-date -50.96%), Daily Spot Trading Volume $14.762 billion
Fear and Greed Index: 31 (Fear)
Average GAS: BTC 1.06 sat/vB, ETH 0.43 Gwei
Market Share: BTC 62.6%, ETH 7.3%
Upbit 24-hour Trading Volume Ranking: XRP, AERGO, BTC, COW, ORCA
24-hour BTC Long/Short Ratio: 1.0969
Sector Performance: RWA sector down 44.62%, SocialFi sector down 1.89%
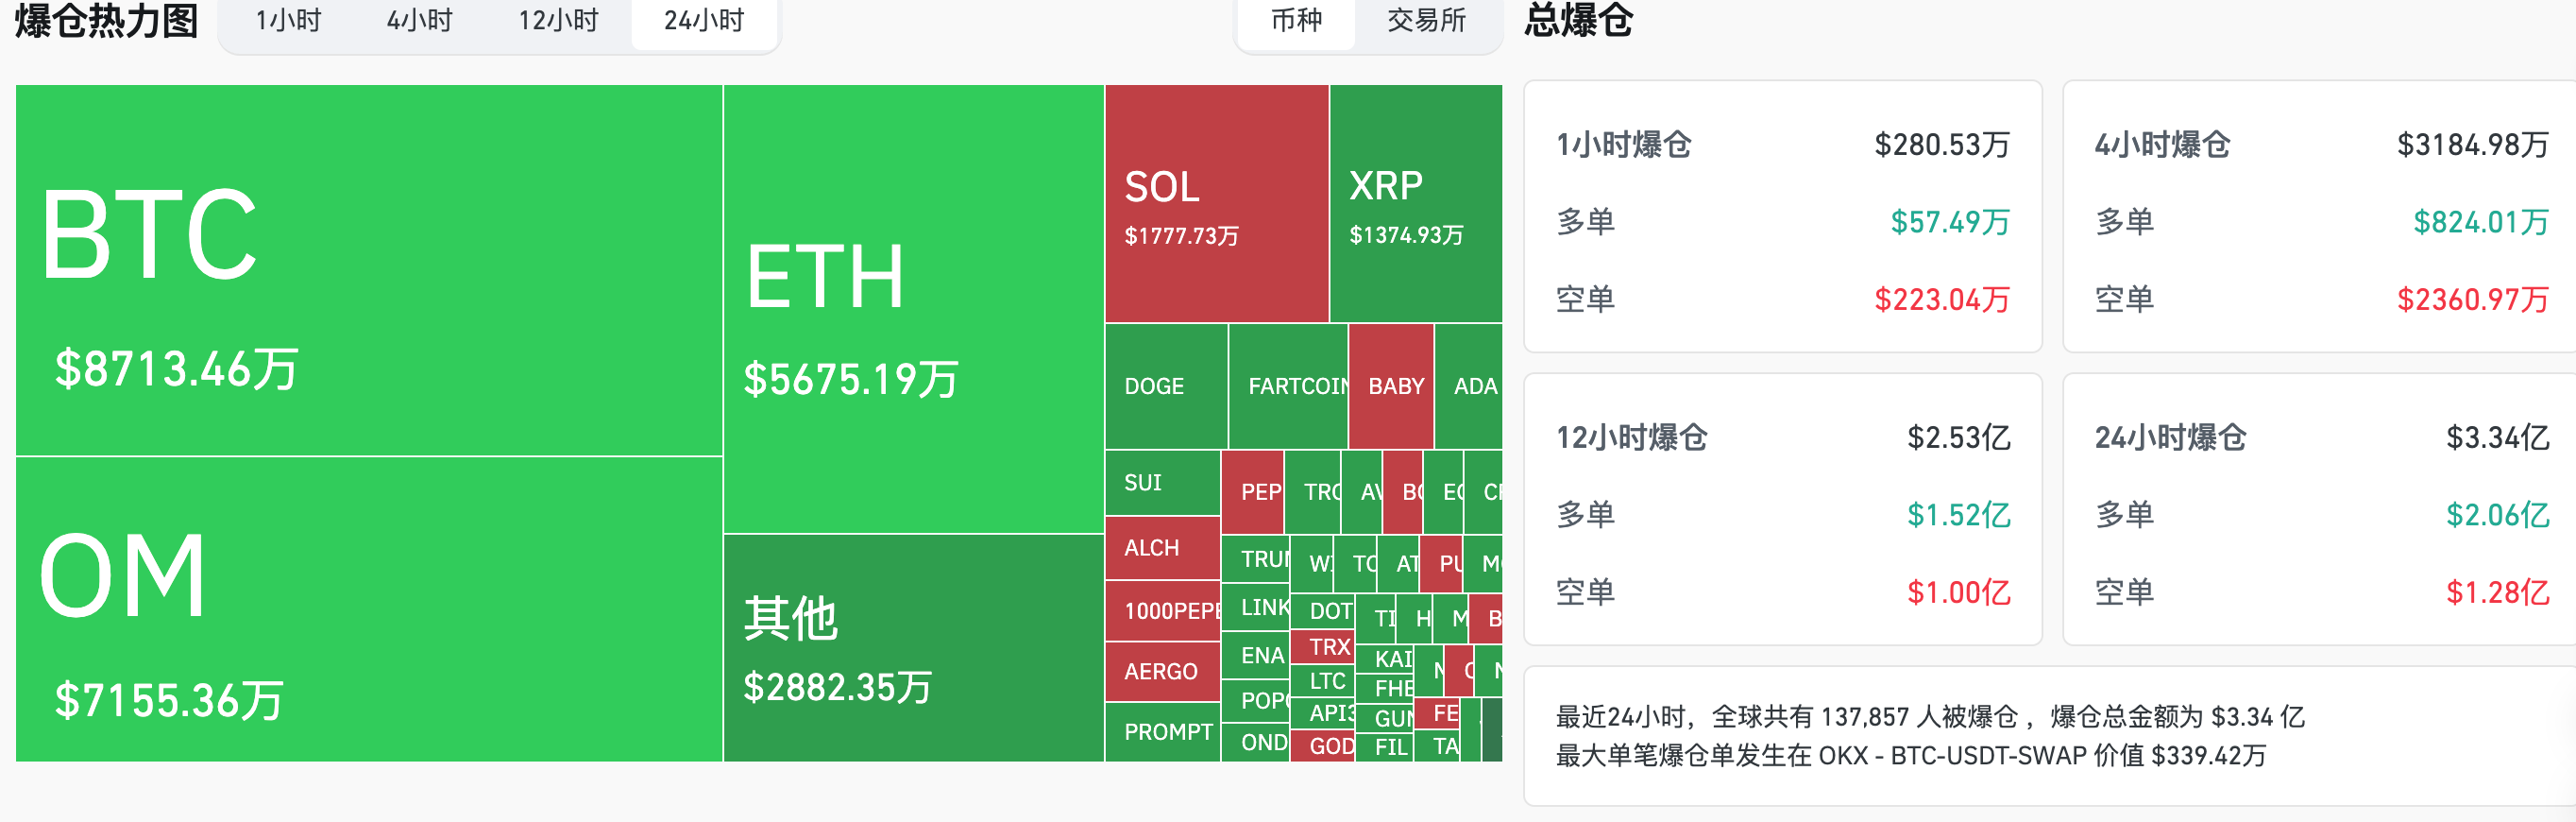
24-hour Liquidation Data: A total of 137,857 people were liquidated globally, with a total liquidation amount of $334 million, including $87.13 million in BTC, $56.75 million in ETH, and $71.55 million in OM.
BTC Medium to Long-term Trend Channel: Upper Line ($83,334.67), Lower Line ($81,684.48)
ETH Medium to Long-term Trend Channel: Upper Line ($1,682.34), Lower Line ($1,649.02)
*Note: When the price is above the upper and lower lines, it indicates a medium to long-term bullish trend; conversely, it indicates a bearish trend. When the price is within the range or repeatedly passes through the cost range in the short term, it indicates a bottoming or topping state.
3. ETF Flows (As of April 11 EST)
Bitcoin ETF: -$1.03 million
Ethereum ETF: -$29.2 million
4. Today's Outlook
Russia's VK to Shut Down NFT Platform on April 15, Users Must Migrate Assets Before This Date
Sei (SEI) to Unlock 225 Million Tokens on April 15, Worth Approximately $38.5 Million
Solayer (LAYER) to Unlock 48.15 Million Tokens on April 15, Worth Approximately $67.7 Million
Starknet (STRK) to Unlock 163 Million Tokens on April 15, Worth Approximately $24.4 Million
Top Gainers Among the Top 500 by Market Cap Today: RFC up 87.42%, GODS up 82.64%, DOGINME up 33.16%, AERGO up 26.29%, ALCH up 20.23%.
5. Hot News
This Week's Macro Outlook: Trump "Messes Up," Federal Reserve Officials to Mobilize
Japanese Listed Company Metaplanet Announces Purchase of 319 Bitcoins
A Whale/Institution Withdraws 15,953 ETH from OKX 5 Hours Ago, Worth $26.16 Million
U.S. Listed Company Janover Increases Holdings by 44,158 SOL, Total SOL Holdings Rise to 83,084
免责声明:本文章仅代表作者个人观点,不代表本平台的立场和观点。本文章仅供信息分享,不构成对任何人的任何投资建议。用户与作者之间的任何争议,与本平台无关。如网页中刊载的文章或图片涉及侵权,请提供相关的权利证明和身份证明发送邮件到support@aicoin.com,本平台相关工作人员将会进行核查。


