Tokens that launched on DEX with an FDV value exceeding $30 million performed comparably to those that launched on medium-sized CEX.
Written by: Animoca Brands Research
Translated by: Felix, PANews
This report analyzes over 3,000 spot token launch events across 9 major centralized exchanges (CEX) and more than 120 decentralized exchanges (DEX) in 2024. The aim is to assess the overall trends of token launches on various platforms and evaluate the price and trading volume performance of tokens during these events.
Key Findings
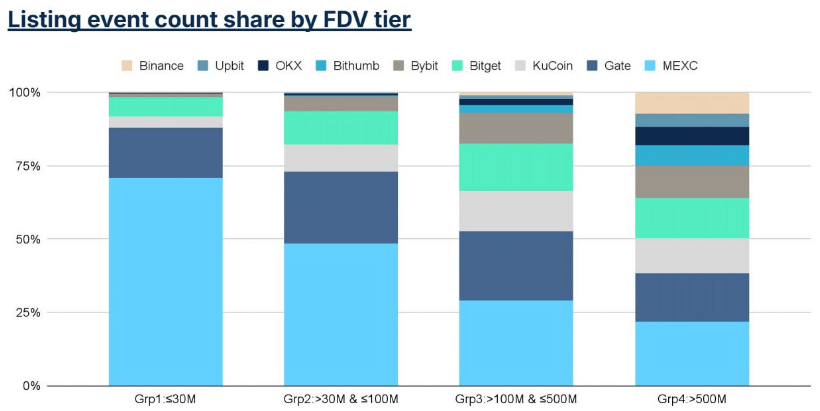
Centralized exchanges adopt different strategies to determine launch priorities, focusing on different levels of fully diluted valuation (FDV). Exchanges with fewer token listings tend to prioritize tokens with larger FDVs (over $500 million), while those with higher listing frequencies tend to favor tokens with FDVs below $30 million.
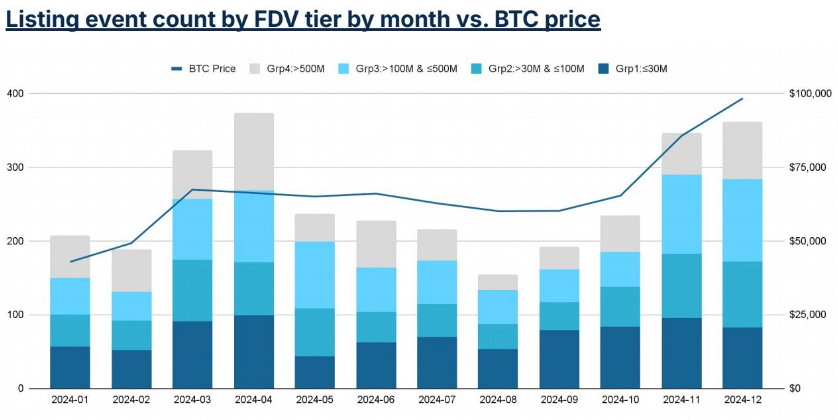
Launch activities are closely related to Bitcoin's price trends, with increased activity during bull markets and decreased activity when Bitcoin's price stagnates. While all FDV scales of tokens are affected by this trend, large FDV tokens are more sensitive to changes in market sentiment.
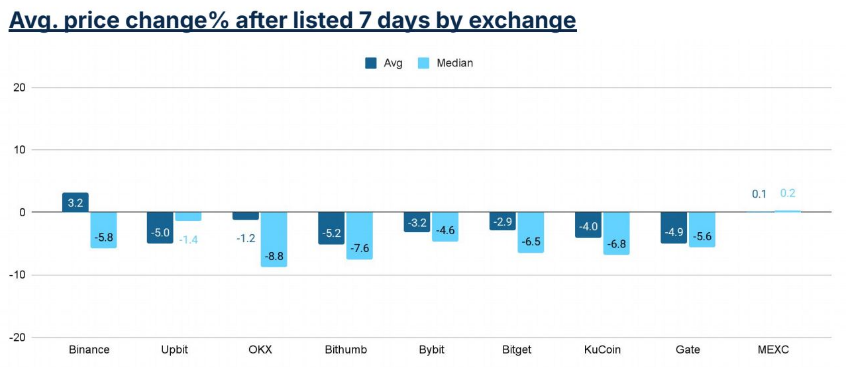
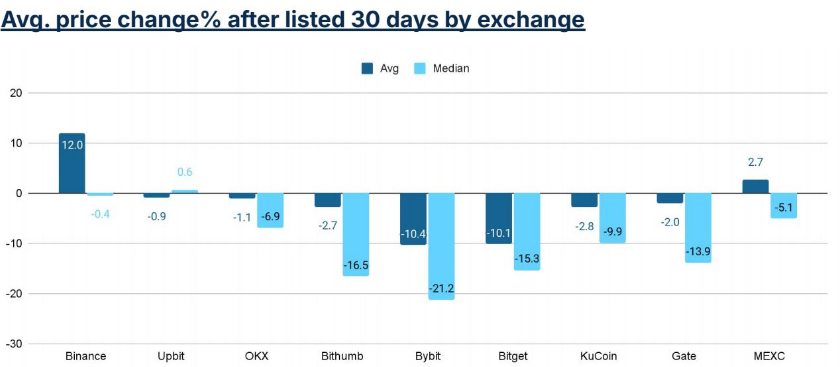
Price performance is measured by the 7-day and 30-day changes relative to the closing price on the launch day, largely reflecting Bitcoin's price trend, but there are indeed differences between exchanges. A "smile curve" pattern emerged: exchanges with the highest (like Binance) and lowest (like MEXC) average listing FDVs recorded positive price changes, while medium-sized exchanges (like Bybit and Bitget) experienced the largest declines.
In terms of trading volume, Binance leads in trading volume for newly listed tokens, followed by OKX and Upbit. Notably, Upbit's trading volume in the first 24 hours is comparable to Binance, while OKX leads in trading volume for tokens in the $30 million to $100 million FDV range.
Tokens that launched on DEX with an FDV value exceeding $30 million performed comparably to those that launched on medium-sized CEX. The price performance of tokens launched on DEX (measured by changes from Day 2 to Day 7 and Day 30) outperformed 4 out of 5 medium-sized CEX. The trading volume in the first 30 days was also similar to or higher than that of CEX like Kucoin, Gate, and MEXC.
It is not uncommon for DEX-launched tokens to later appear on medium-sized CEX, but it is rare for them to appear on large CEX. Among the DEX-launched tokens sampled in the second half of 2024, about 16% subsequently launched on CEX, with only 2% successfully launching on large exchanges like Binance, OKX, or Upbit.
CEX Launch Performance
Overview
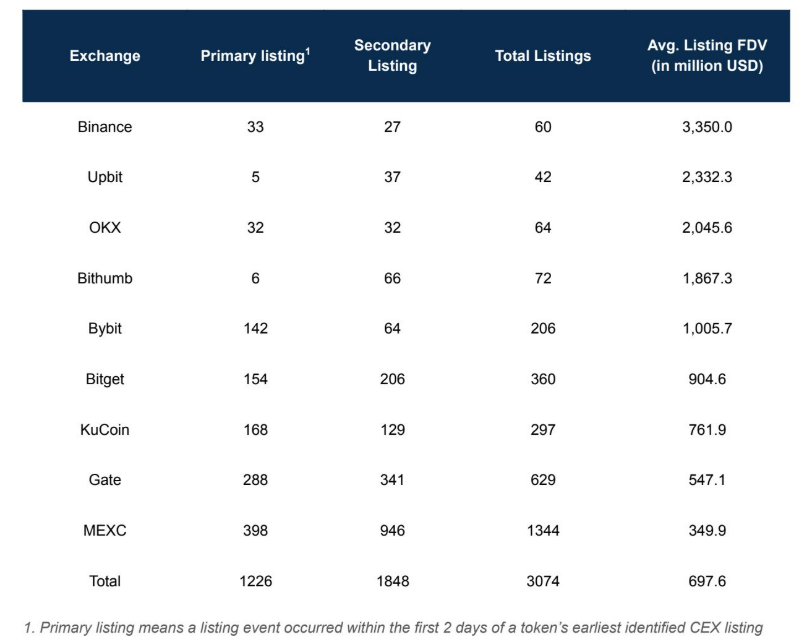
The report recorded a total of 3,074 token launch events. 1,226 events (40%) were identified as primary listings, launching within the first 2 days after the token's release; while 1,848 events (60%) were identified as secondary listings.
Most exchanges took a balanced approach, with nearly equal participation in primary and secondary listings.
In general, exchanges listing high FDV projects focus on fewer, larger-scale launches, while those listing smaller FDV projects have a higher number of listing events.
The two Korean exchanges, Upbit and Bithumb, primarily focus on secondary listings, which may mean that primary listings are not the first launch. In the remainder of this article, exchanges will be ranked by their average listing FDV, with those having high listing FDVs referred to as "large exchanges" and the rest as "medium exchanges."
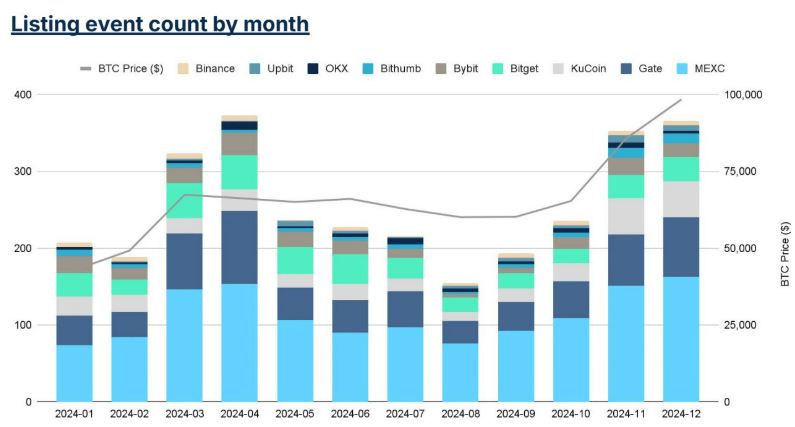
Monthly Summary of Listing Events
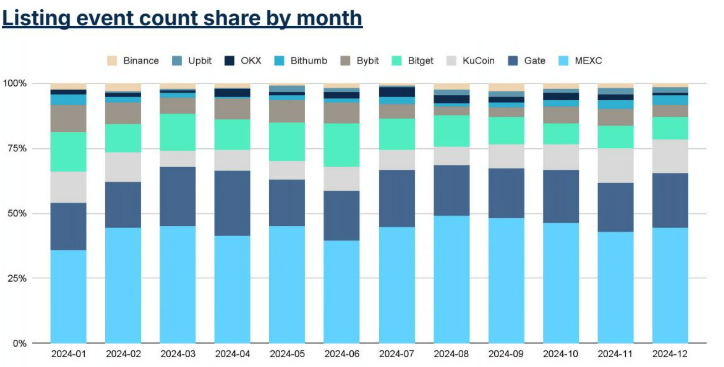
There were more listing events during bull markets (February to March and August to December), while the number of listing events decreased during market downturns.
April was a standout month, as listing events continued to rise despite a reversal in BTC prices. This effect was not evident in December, when BTC stagnated after two months of increases.
In terms of the number of listing events, top exchanges were less affected by the bear market, reflected in their continuously expanding share of listing events during these periods.
Summary of Listing Events by FDV
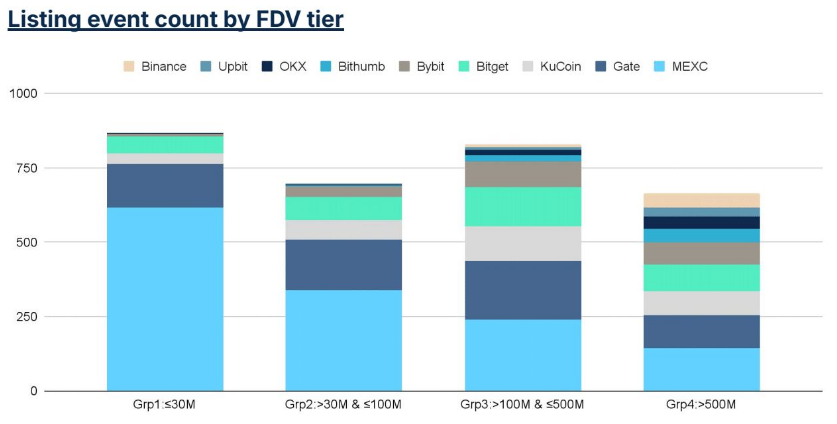
Large exchanges concentrated most of their listing efforts on the FDV category above $500 million, with the top four exchanges accounting for 25% of listing activities in this tier.
Nevertheless, medium-sized exchanges contributed significantly to listing activities in the above $500 million category, likely because projects on large exchanges often list on medium exchanges as well, but the reverse is less common.
Medium-sized exchanges like Bybit, KuCoin, Bitget, and Gate have a more balanced volume of listings across the four FDV tiers, with a slightly larger share in the $30 million to $500 million range. MEXC adopted a different strategy, focusing on tokens with FDV ≤ $30 million, which accounted for 70% of listing activities in this category.
Monthly Listing Events by FDV Tier
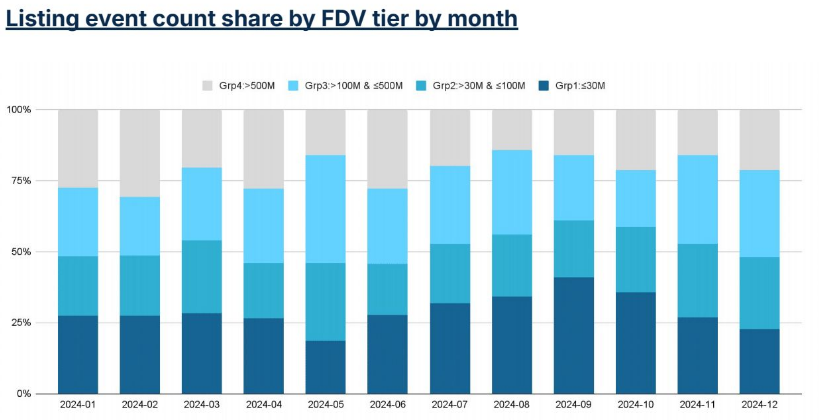
The FDV tier above $500 million is most susceptible to changes in market sentiment, with a rapid increase in listing events during the rebound from February to March, exceeding expectations in April, and then remaining in a contraction phase until the rebound from September to December.
The FDV tier ≤ $30 million closely tracked overall listing momentum during bull markets but occupied a larger share of listing events during periods like June to September.
Price Performance of Listings
The price performance across exchanges forms a "smile curve," with tokens at both ends performing better than those in the middle.
Tokens listed on the ends, Binance and MEXC, showed positive price changes after 30 days, while the average price of tokens listed on Bybit and Bitget fell by about 10%.
The 7-day price performance exhibited a similar pattern, with Binance listings rising by about 3%, MEXC listings remaining flat, and the middle exchanges experiencing larger declines.
The median price change is typically lower than the average, indicating that a small number of token listing events account for a large share of the total.
Summary of Price Performance by FDV Tier
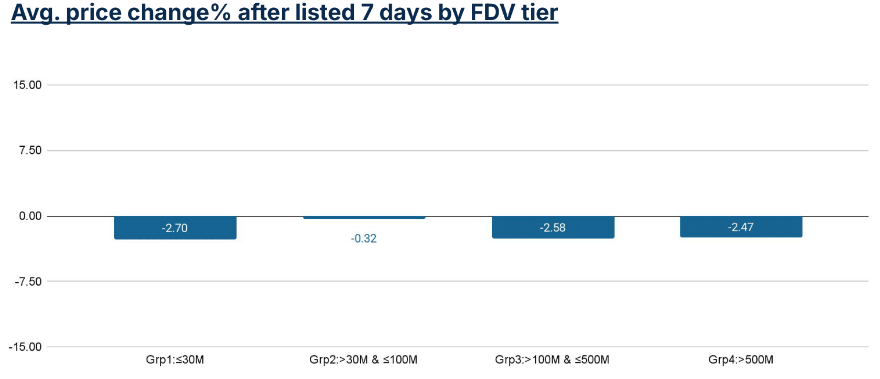
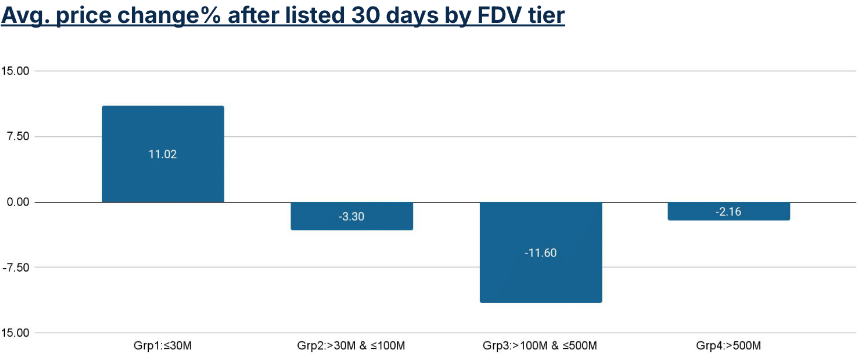
The price change patterns for 7-day and 30-day periods differ by FDV tier.
Tokens in the FDV tier ≤ $30 million saw a price drop after 7 days but rebounded strongly by Day 30, showing the largest contrast among the four tiers. Tokens in the $30 million to $100 million and >$500 million FDV tiers experienced mild declines after 7 days, on average maintaining similar levels within 30 days.
Tokens in the $100 million to $500 million FDV tier dropped by 2% in the first 7 days, but the decline expanded to over 11% by Day 30, indicating an overall downward trend after the first week.
Monthly Summary of Price Performance of Listings
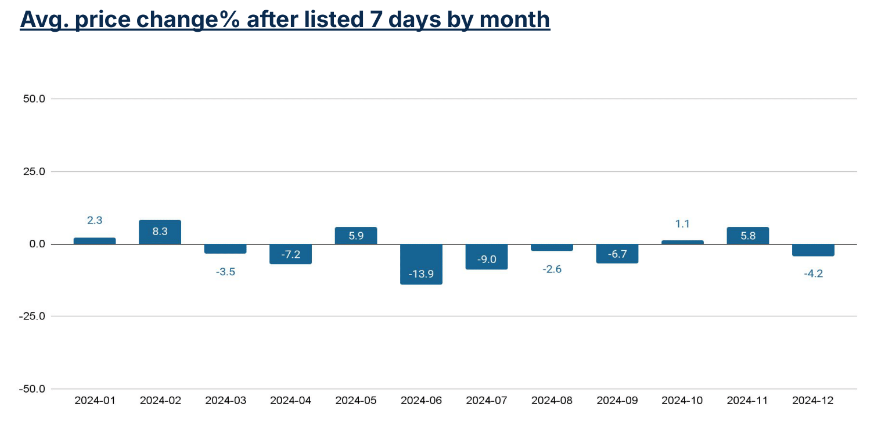
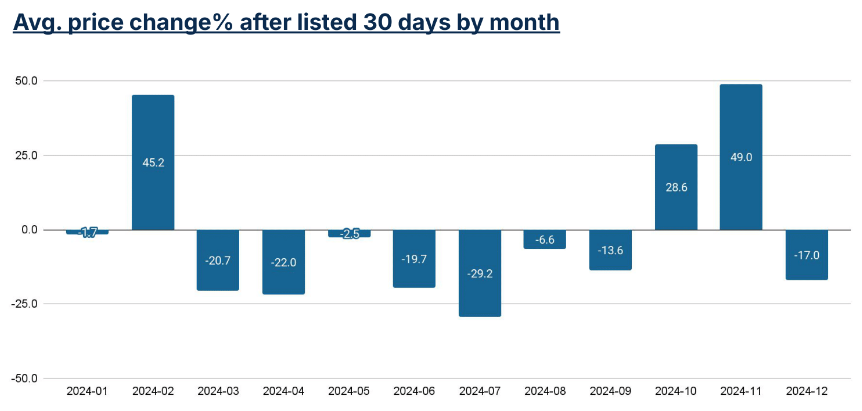
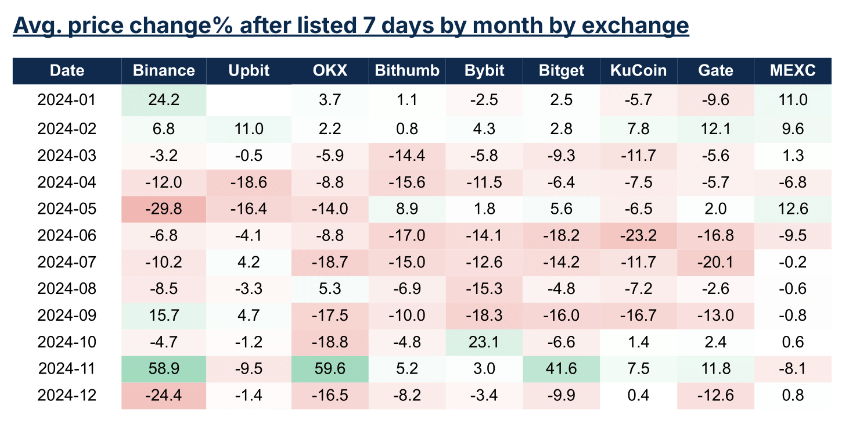
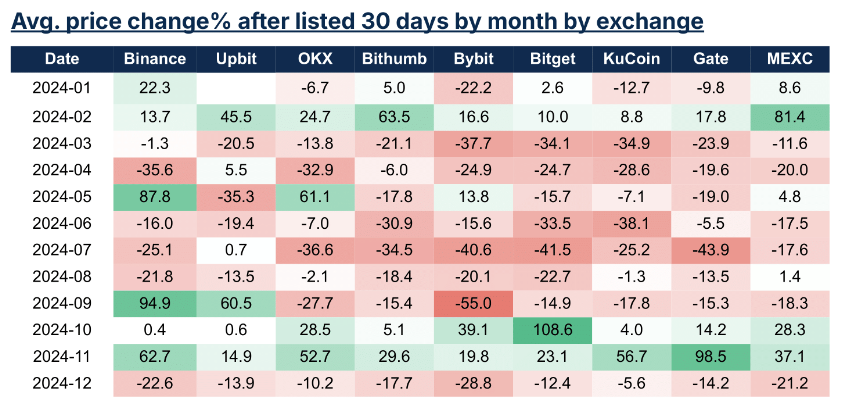
From a temporal perspective, price performance is primarily driven by market conditions. During BTC bull markets, token listings perform neutrally or positively. During BTC bear markets, token listings perform negatively.
Monthly Price Performance of Listings by Exchange
In February, October, and November, most exchanges maintained positive price changes, coinciding with significant increases in BTC prices.
January and May deviated from the overall BTC price trend: despite an impending rebound in BTC, tokens listed in January performed poorly; conversely, tokens listed in May performed well despite being in a slow bear market.
Although the market was in a neutral state, tokens listed in December performed poorly.
Price Performance of Listings by FDV Tier Across Exchanges
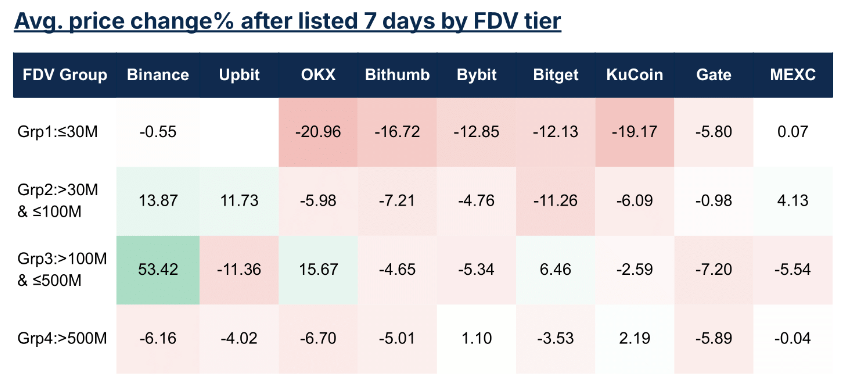
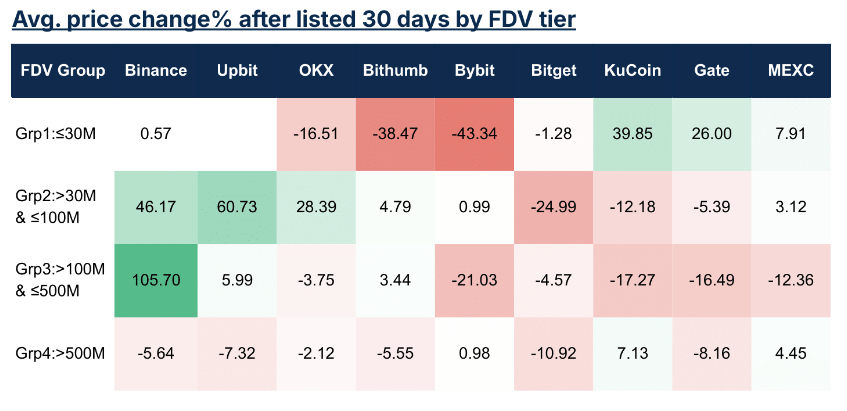
Compared to large exchanges like OKX and Bybit, the price performance of small FDV tokens listed on medium-sized exchanges such as KuCoin, Gate, and MEXC is better.
Medium FDV tokens ($30 million to $500 million) perform better on large exchanges than on medium exchanges. The performance of large FDV tokens (> $500 million) is relatively consistent across exchanges, with minimal price fluctuations from Day 7 to Day 30.
Monthly Price Performance of Listings by FDV Tier
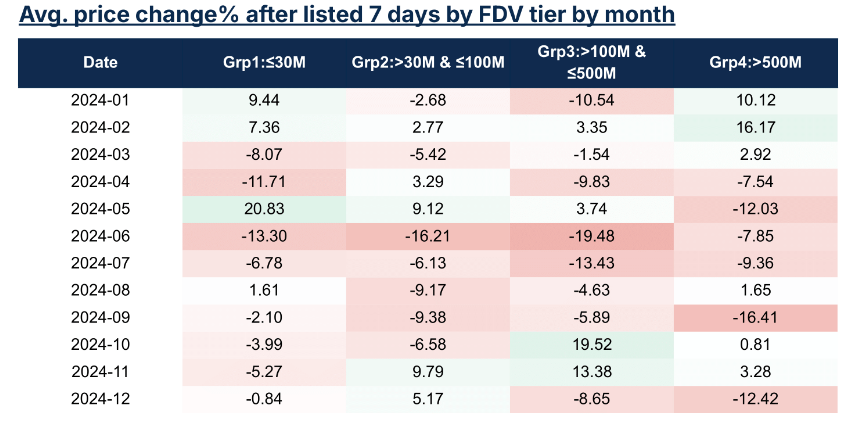
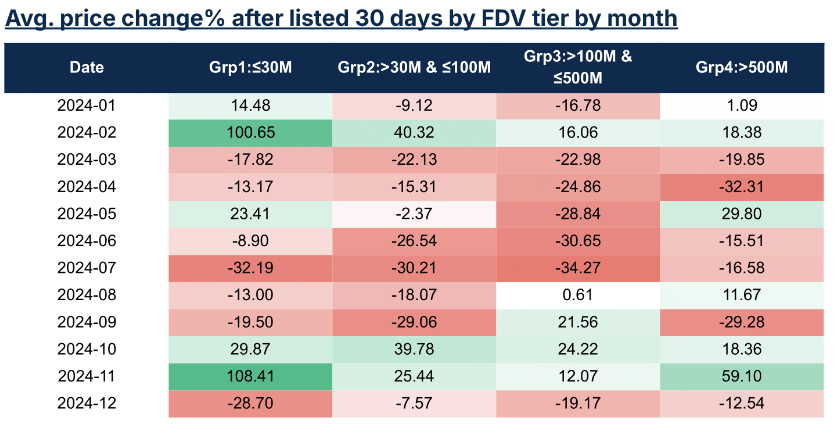
Small FDV tokens exhibit strong price performance, outperforming medium FDV tokens ($30 million to $500 million) in 30-day price change rates in most months, regardless of market conditions.
Medium FDV tokens experienced strong 7-day price increases in October and November but still lagged behind other categories at the 30-day mark.
Large FDV tokens showed stronger consistency over several months, with positive price performance in half of the months for both 7-day and 30-day periods.
Trading Volume by Exchange
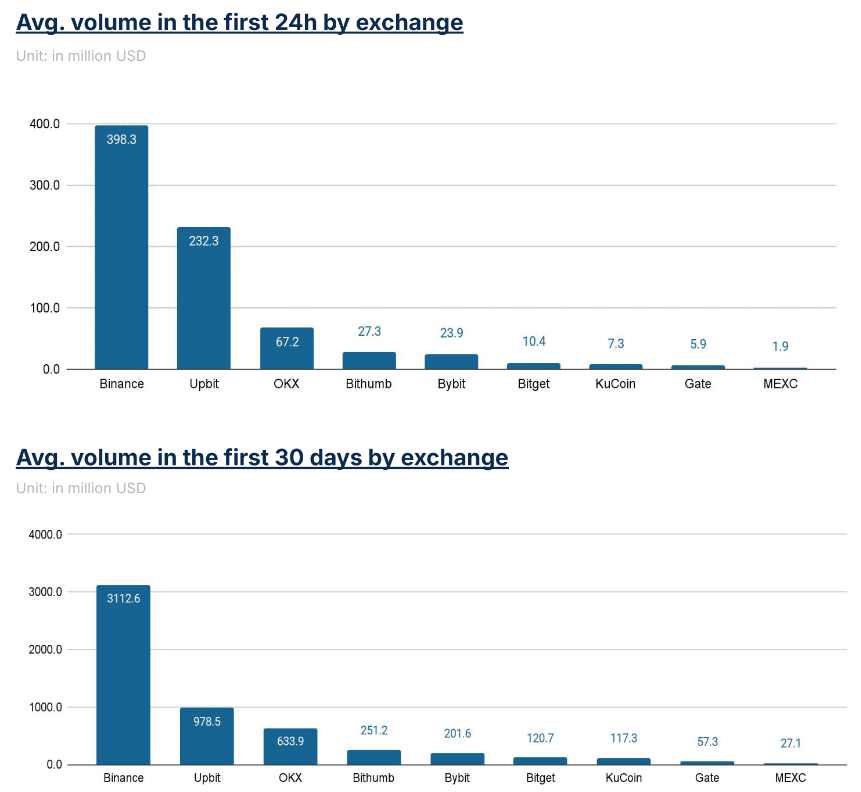
Binance leads in trading volume for newly listed tokens, followed by Upbit and OKX. Upbit's trading volume in the first 24 hours is strong, nearly matching Binance, but the 30-day trading volume falls back to levels similar to OKX.
Among medium exchanges, Bybit shows strong trading volume in both the first 24 hours and over the entire 30 days.
Monthly Summary of Trading Volume
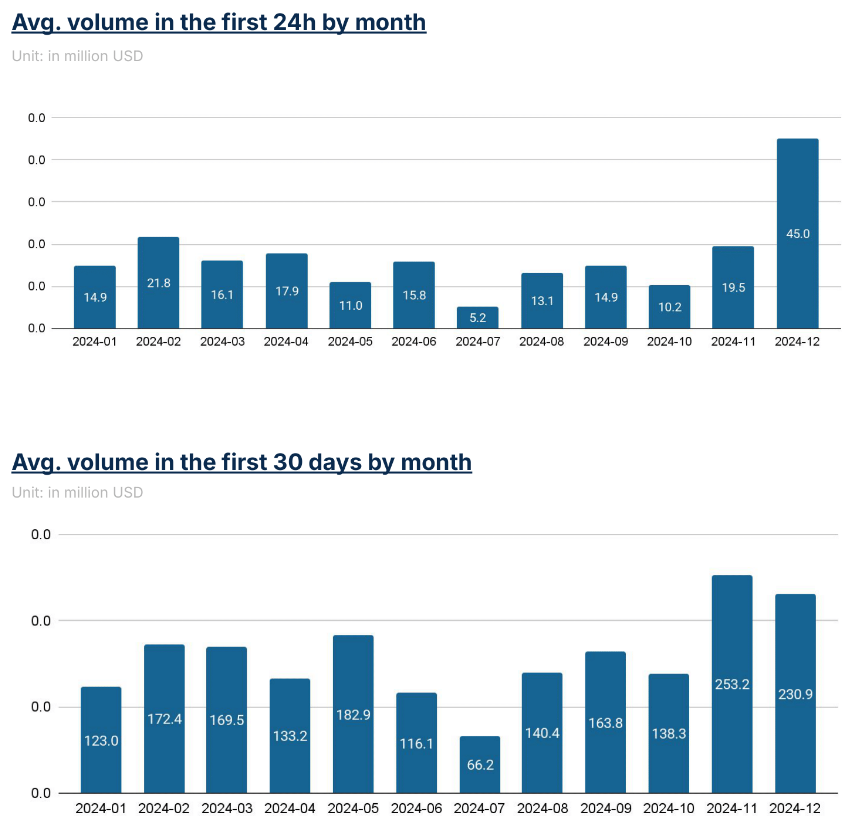
Initial listing volumes largely follow bear/bull market cycles, with higher initial listing volumes during February to March and September to December.
In April, a month after the first wave of price increases, listing activities exceeded expectations, but trading volumes were below the 30-day average. This indicates that excessive listings during calmer market periods may dilute the trading volume of newly listed tokens.
Trading Volume by FDV Tier
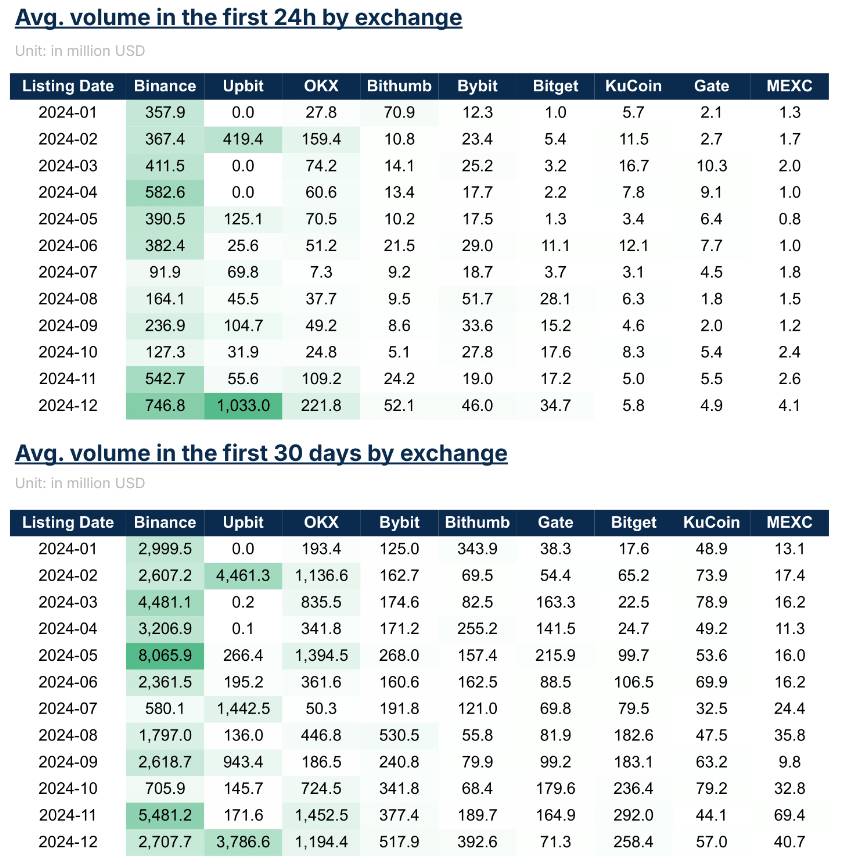
Trading volume generally follows the tier of token FDV, with the maximum FDV tier having trading volumes 60 times that of the minimum FDV tier in the first 24 hours and 25 times in the first 30 days.
Monthly Summary of Trading Volume by Exchange
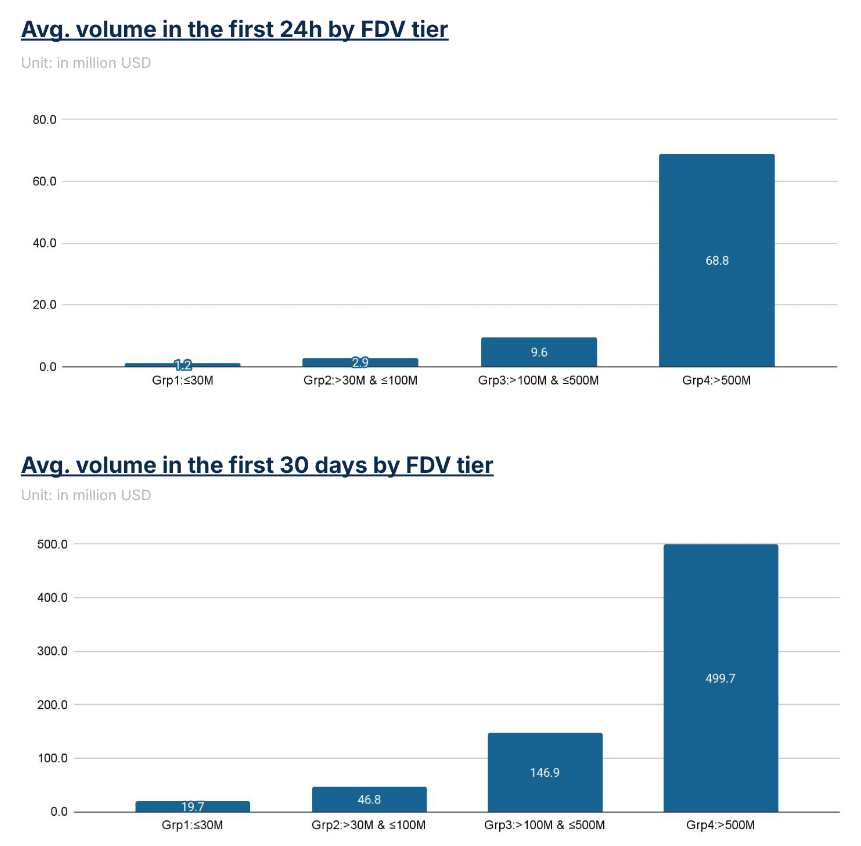
In most months, Binance leads in trading volume for newly listed tokens. Upbit shows high uncertainty in initial trading volume for new listings.
While it leads in 30-day trading volume in February, July, and December, there are also several months where the trading volume for newly listed tokens is very low.
Trading Volume by FDV Tier Across Exchanges
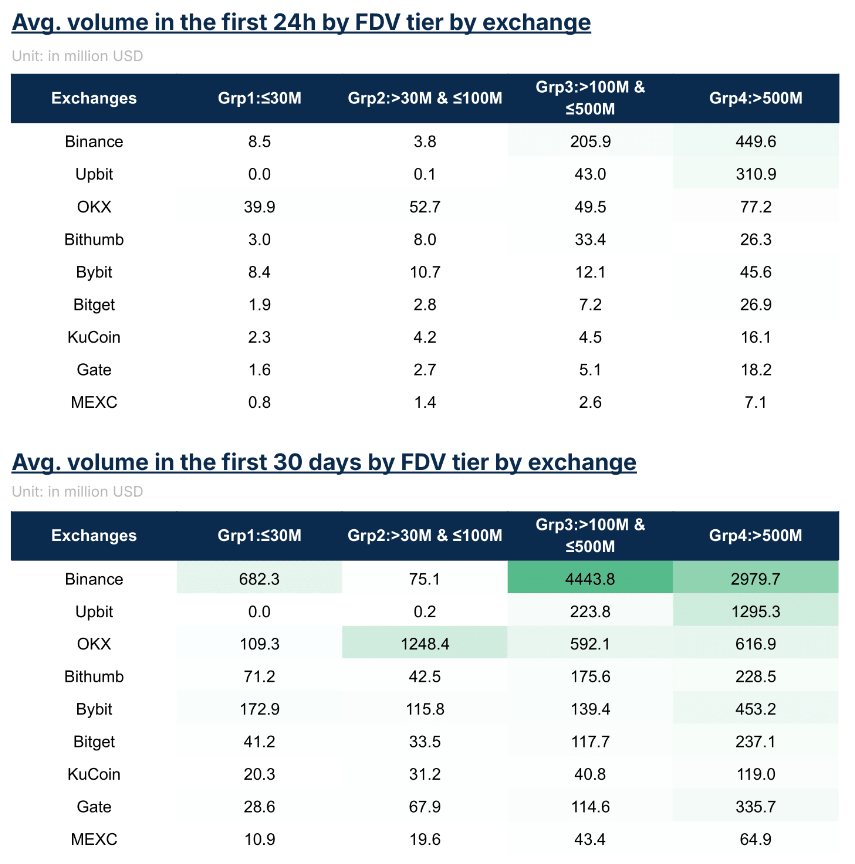
Binance has the highest trading volume for listings, primarily concentrated in the $100 million to $500 million FDV category.
On the other hand, OKX shows significant trading volume for medium FDV tokens ($30 million to $100 million).
Among medium exchanges, Bybit maintains relatively stable trading volumes across all FDV tiers, while other medium exchanges typically concentrate their trading volume on medium FDV tokens.
DEX vs CEX
Listings on DEX are often seen as a complement to those on CEX. The liquidity pools on DEX are typically created simultaneously with the initial CEX listing, allowing users to trade flexibly on-chain or through CEX. Conversely, launching solely on DEX is often associated with a more decentralized approach, primarily utilized by long-tail tokens with limited mainstream appeal.
However, an increasing number of projects are recently choosing DEX as their only initial listing platform, delaying or forgoing CEX listings for a period. To assess the feasibility and impact of this strategy, this article analyzes relevant data and metrics to compare DEX and CEX.
To ensure an objective comparison, DEX listings are defined as tokens that maintain liquidity exclusively on decentralized exchanges for at least 30 days. For CEX listings, the focus is on primary listing events, representing tokens that introduce centralized exchanges as their primary trading venues. To avoid bias from long-tail tokens, the analysis is limited to tokens with FDVs between $30 million and $500 million to ensure balance between the two groups.
When measuring price performance, the percentage change in price from Day 2 to Day 7 and from Day 2 to Day 30 is used, rather than the time period from listing to Day 7 or Day 30. This adjustment considers the different price discovery mechanisms between CEX and DEX on the listing day; otherwise, direct comparisons would be invalid. For trading volume, a consistent approach is maintained, using trading volumes from the first 24 hours and 30 days as key indicators.
Summary of Listing Events: DEX vs CEX
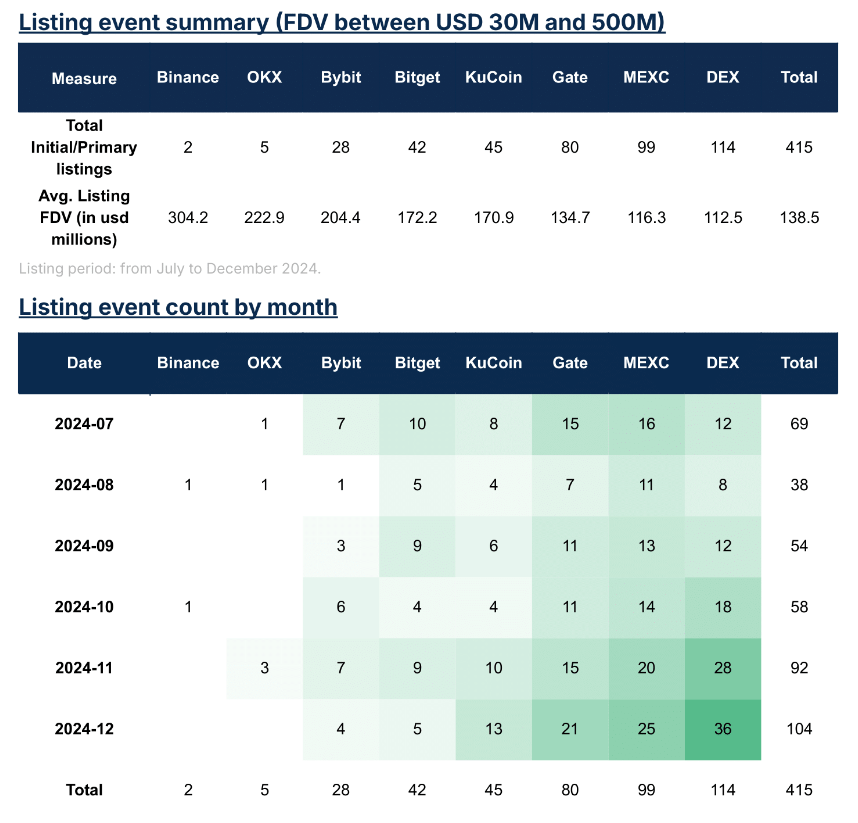
A sample of 415 major listing events that occurred in the second half of 2024 was analyzed, focusing on tokens with fully diluted valuations (FDV) between $30 million and $500 million. Among these, 114 were classified as priority DEX listings, meaning the tokens were listed exclusively on DEX in the first month.
In August, DEX listings proved to rebound in activity in the fourth quarter after being more sensitive to market momentum during a downturn. In the third quarter, priority DEX listings accounted for less than 20% of new tokens, but this proportion surged to over 30% in November and December.
Most CEX listings in this analysis were concentrated on medium exchanges. In contrast, Binance and OKX had only a few listing events.
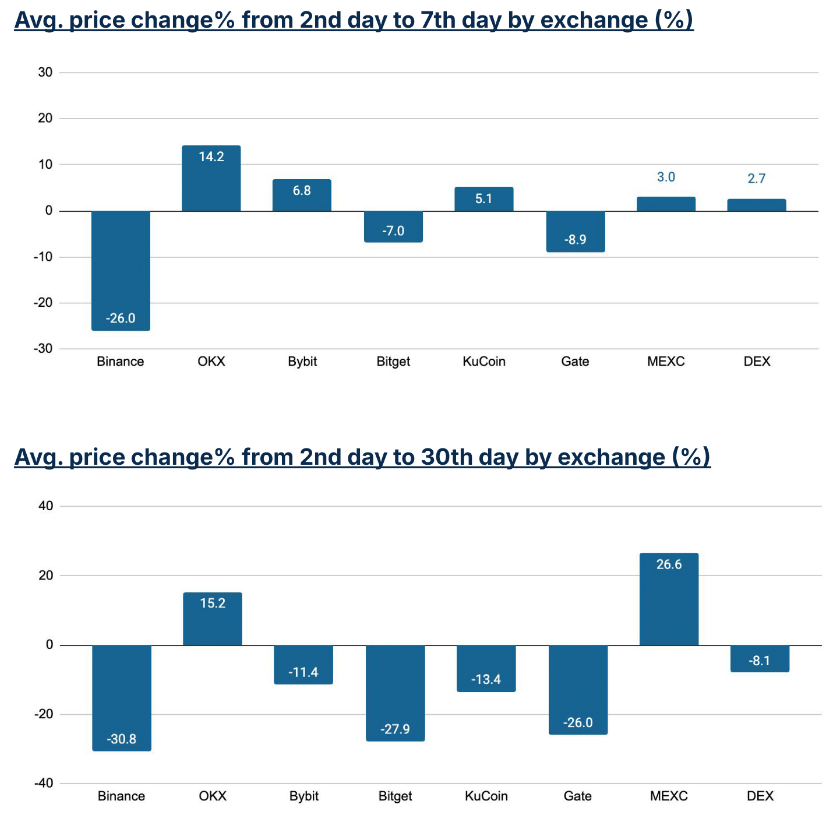
Price Changes at First Listing: DEX vs CEX
Among medium CEX, the performance from Day 2 to Day 7 is mixed. By Day 30, all listed tokens, except those on MEXC, showed negative price changes.
In contrast, tokens that first listed on DEX showed positive growth by Day 7 and a slight decline by Day 30, outperforming most tokens listed on medium CEX.
OKX leads in price performance among large CEX, with listed tokens increasing by about 14% from Day 2 to Day 7 and maintaining this level after 30 days. However, due to limited data, caution should be exercised in interpreting the performance of Binance and OKX.
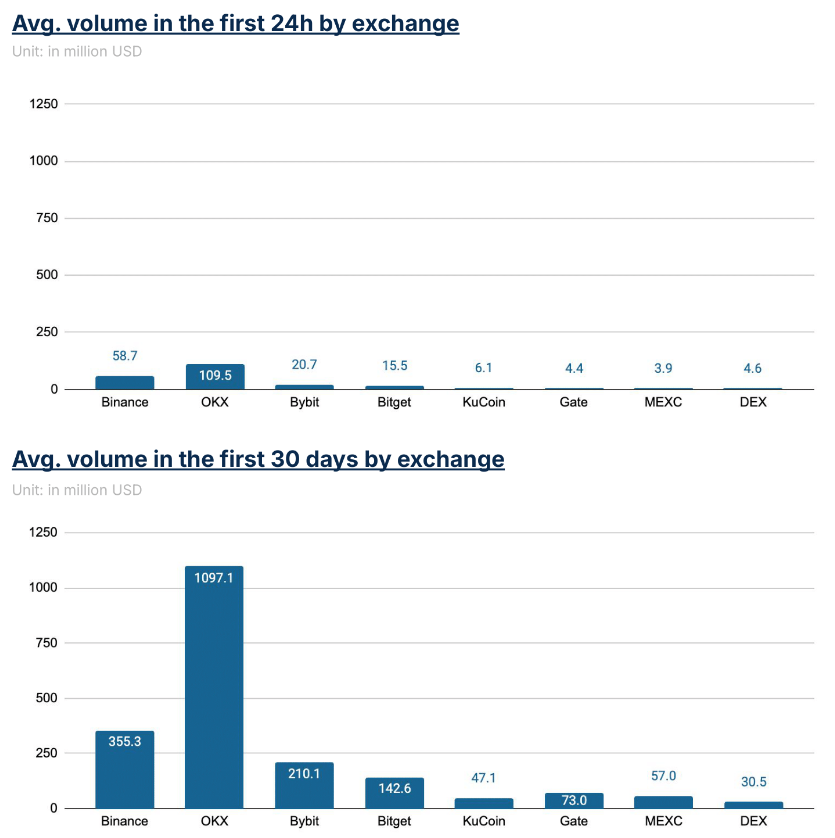
Average Trading Volume at First Listing: DEX vs CEX
Trading volume on DEX is comparable to that of medium CEX like KuCoin, Gate, and MEXC, while the average trading volume of OKX and Binance is higher than that of other exchanges.
The concentration of trading volume in the first 24 hours for both DEX and CEX shows a similar pattern, indicating consistent market attention trends.
This trading volume performance, combined with price performance 30 days after listing, suggests that the impact of initial DEX listings on token performance can rival that of medium CEX.
Token Listing Tier Analysis
The 415 sampled listing events covered a total of 238 tokens. Among these, 126 tokens were initially listed only on DEX, while the remaining tokens were listed on medium or large centralized exchanges. It is important to note that the DEX-listed tokens included in the analysis are limited to those indexed on CoinMarketCap.
Of the tokens initially listed on DEX, about 16% later launched on CEX, primarily in the medium CEX category. However, only 2% of tokens that first launched on DEX subsequently gained support on top CEXs (such as Binance, Upbit, or OKX). For tokens that first launched on medium CEX, about 3% eventually listed on high FDV CEX, which is comparable to the likelihood of tokens that first launched on DEX.
These findings indicate that while priority DEX tokens have a considerable chance of listing on CEX, they are most likely to land on medium exchanges. Regardless of whether tokens start from DEX or medium CEX, the likelihood of medium FDV tokens entering top CEX remains low.
免责声明:本文章仅代表作者个人观点,不代表本平台的立场和观点。本文章仅供信息分享,不构成对任何人的任何投资建议。用户与作者之间的任何争议,与本平台无关。如网页中刊载的文章或图片涉及侵权,请提供相关的权利证明和身份证明发送邮件到support@aicoin.com,本平台相关工作人员将会进行核查。


