Tether Treasury has minted an additional 1 billion USDT on the Ethereum network, bringing the total minted this month to 18 billion USDT.
After reaching a high of 2789, gold has declined for two weeks, rebounding only to be pressured down again. In the short term, there is a possibility of gold prices fluctuating and retreating. Recently, some friends have asked whether to invest in gold. Personally, I prefer to wait patiently for a better adjustment before entering. Since breaking the historical high in February, gold has risen for nearly a year, and chasing after it now comes with the risk of a pullback.
In the U.S. stock market, the Dow Jones has reached a new historical high of 45070, the S&P 500 index is at 6044, and the Nasdaq is also close to its previous high. Since October 2022, it has been on an upward trend, and since November 2023, it has shown a one-sided rise. It truly reflects the saying that if you are bullish on A-shares, you should invest in the Nasdaq. The U.S. stock market has shown signs of fatigue after seven consecutive days of gains, while the A-shares have been consolidating after five consecutive days of declines, like a star waiting to rise.
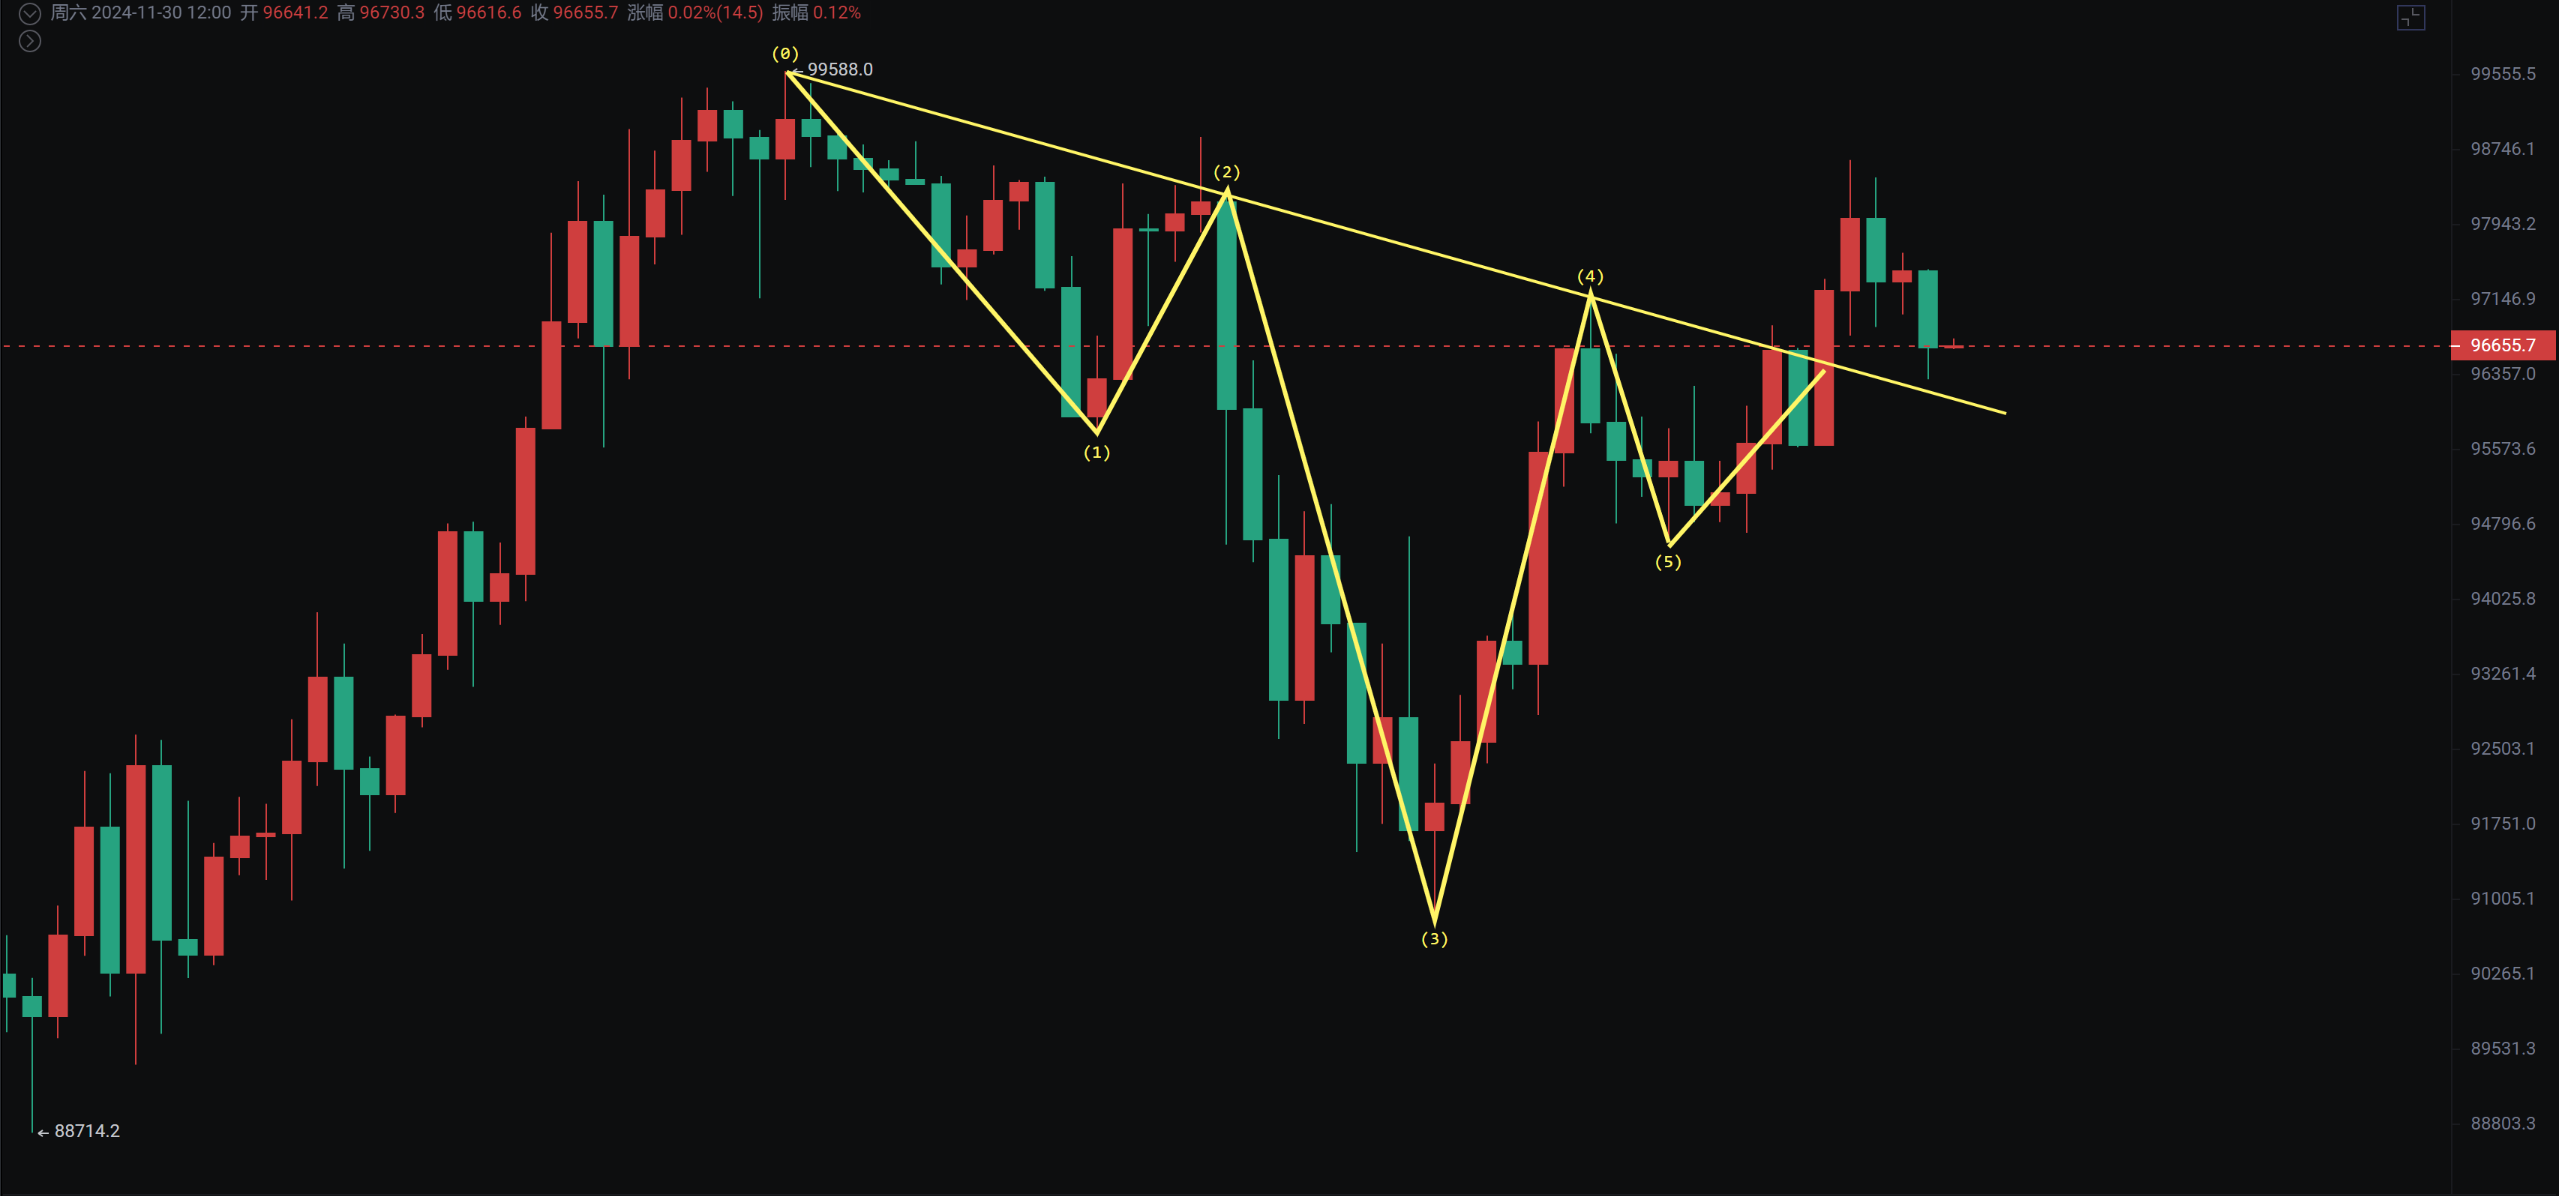
Bitcoin
Bitcoin tested the downward trend line again yesterday and was rejected, leading to a decline. In the short term, a pullback is expected, and it is still near the previous high. The monthly line is about to close, so pay attention to increased market volatility. The daily BOLL is narrowing, facing a potential change in trend, and both MACD and RSI have shown divergence, indicating a need to be cautious of false breakouts. There is an expected head and shoulders bottom pattern on the 4-hour chart; after breaking out last night, we should watch if it can support a rebound, with the key Fibonacci level of 0.382 roughly coinciding, meaning it should not fall below the 96500 level.
Overall, the bias is still towards oscillating within the range of 90800—98500. The time and space for adjustment are still insufficient, and there will be opportunities to gradually increase positions if it drops to 83000—90800.
Support: Resistance:
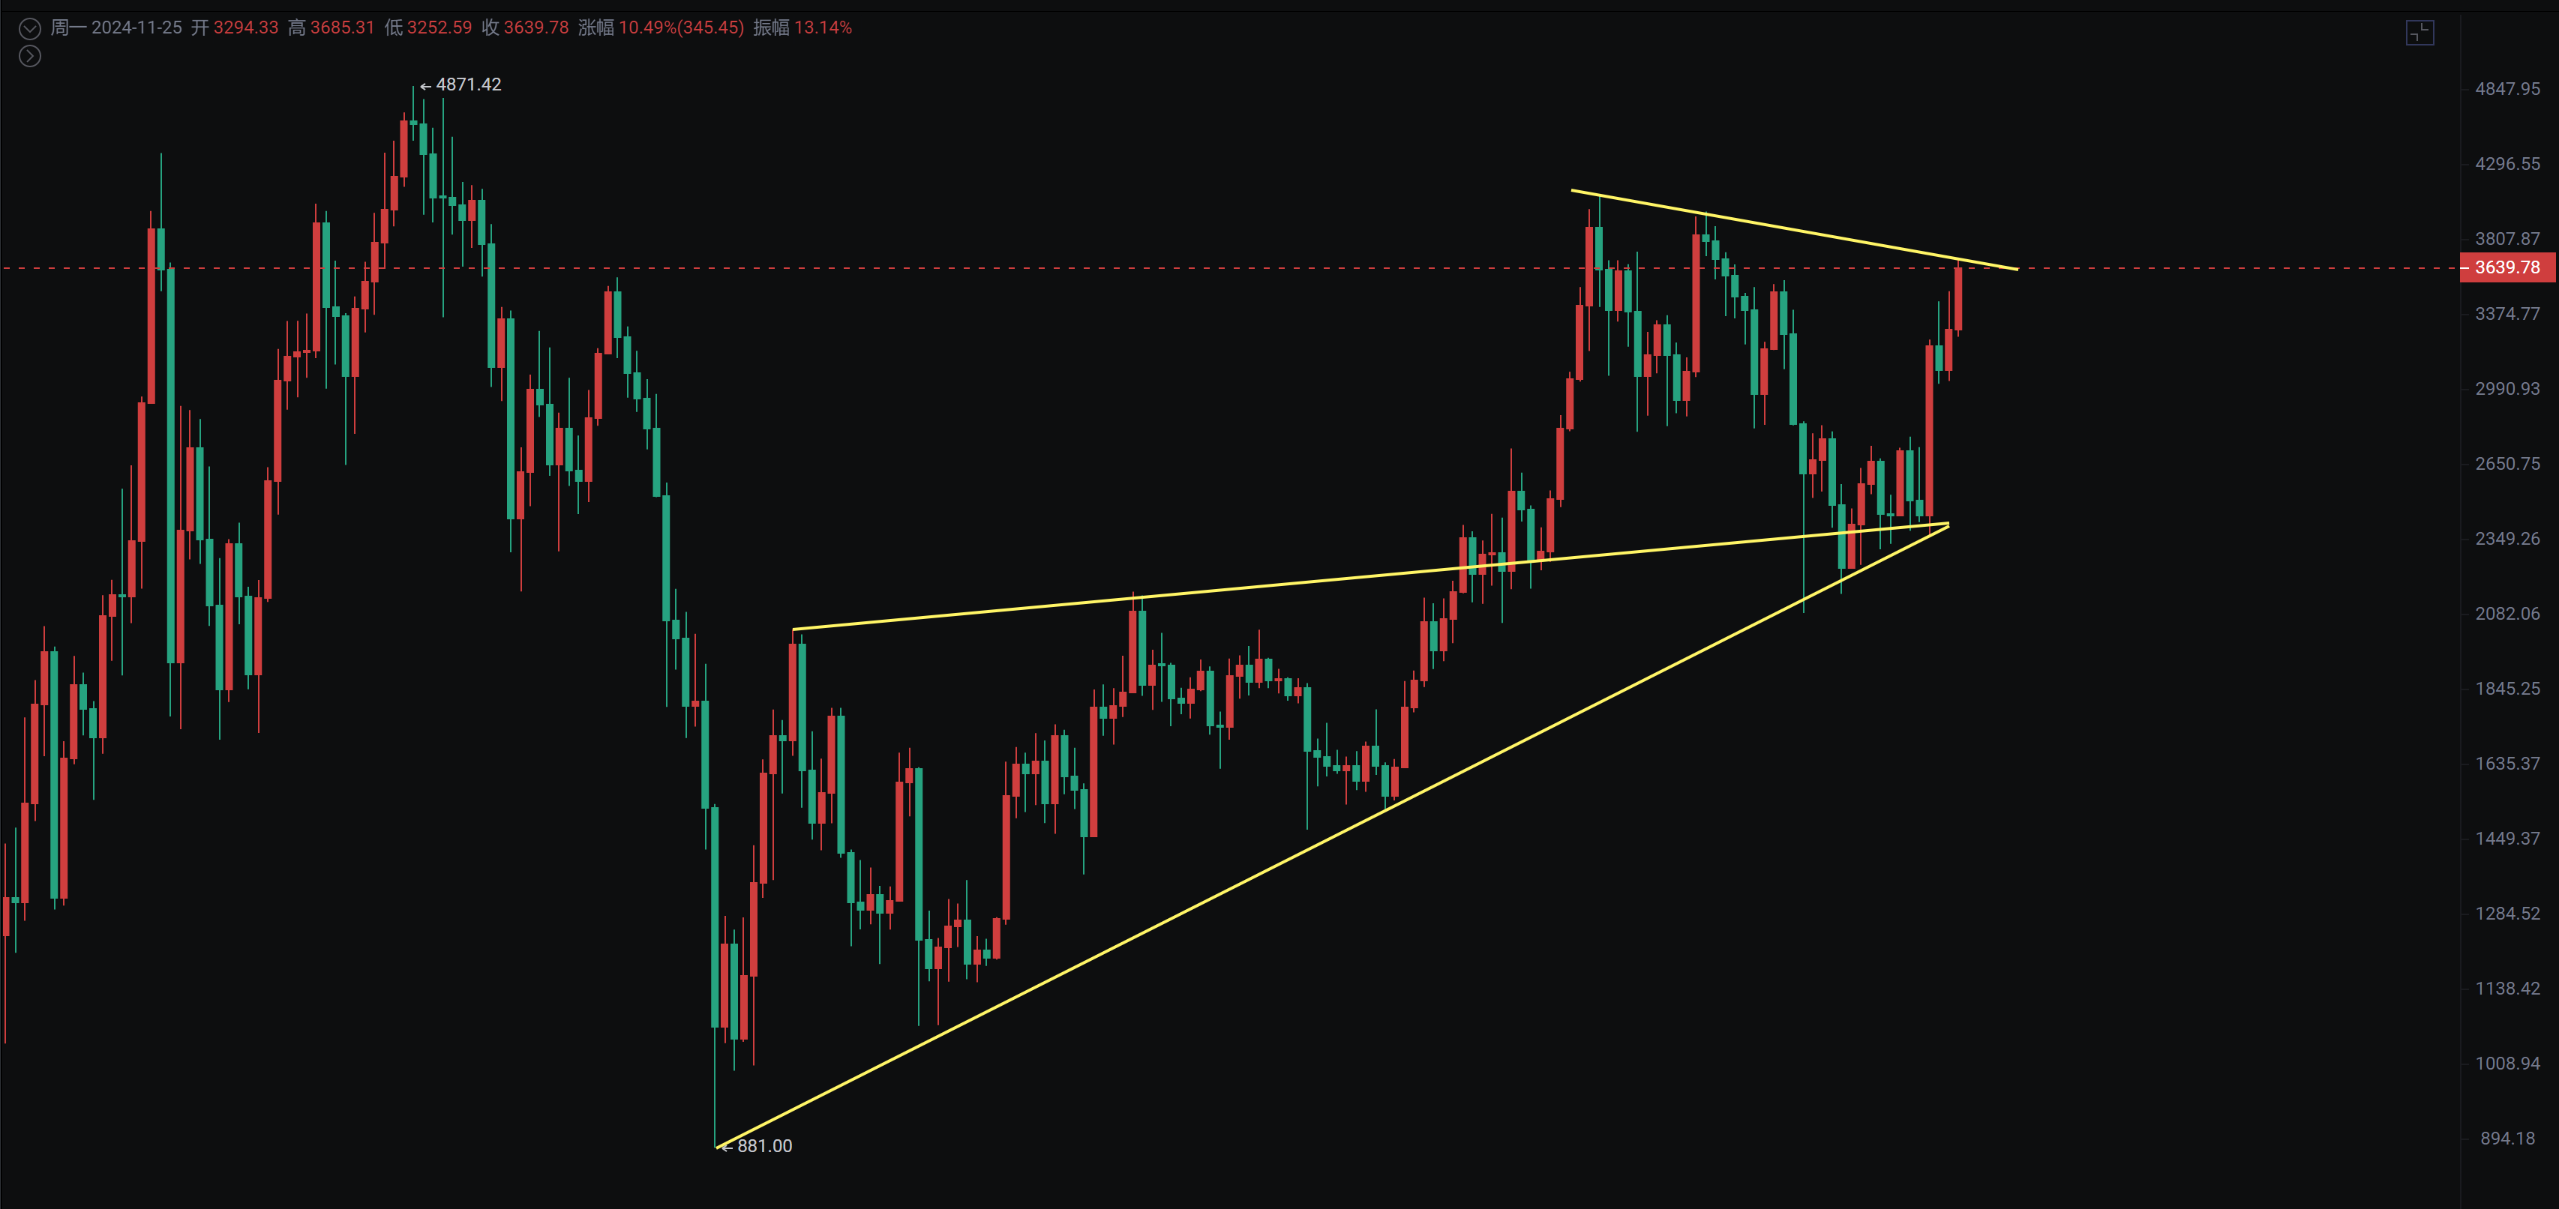
Ethereum
Ethereum's recent performance has been relatively strong, following Bitcoin's lead. When Bitcoin experiences a short-term pullback, Ethereum tends to catch up, which aligns with our view that Bitcoin's high-level oscillation provides opportunities for altcoins to catch up.
The daily BOLL is opening up, and the previous two engulfing candlestick patterns have been broken, indicating a probability of continuing to break through 3684. However, with the expectation of Bitcoin's oscillating pullback, Ethereum's catch-up can only be short-term, including altcoins; the best mid-term layout opportunity has not yet arrived.
Support: Resistance:
If you like my views, please like, comment, and share. Let's navigate through the bull and bear markets together!!!
The article is time-sensitive and for reference only, with real-time updates.
Focusing on K-line technical research, sharing global investment opportunities. Public account: Trading Prince Fusu

免责声明:本文章仅代表作者个人观点,不代表本平台的立场和观点。本文章仅供信息分享,不构成对任何人的任何投资建议。用户与作者之间的任何争议,与本平台无关。如网页中刊载的文章或图片涉及侵权,请提供相关的权利证明和身份证明发送邮件到support@aicoin.com,本平台相关工作人员将会进行核查。