Daily Share
Many people are asking, what stage are we currently in during the bull market?
If we categorize it by weekly structure, I personally believe we are now in the second half of the bull market, and it is the early stage of the second half.
The first half of the bull market was from December 2022 to March 2024. This phase was essentially a transition from a rebound to a reversal, and it was a period of extreme uncertainty. It is very normal for everyone to be filled with doubts and confusion about the start time of the new bull market. It wasn't until the beginning of this year when it surged past 50,000 that the market slowly reached a consensus, believing that we are now in a new bull market.
From March 2024 to October 2024, it will be an overall mid-game phase after the first half of the bull market ends. Due to the continuous ups and downs during this phase, especially with Bitcoin, which is approaching a state of a broadening triangle, market confidence has been insufficient. Many who firmly believed Bitcoin could reach 100,000 or even higher have become uncertain amid the market's significant fluctuations, and many bulls have turned bearish. The altcoin market has plummeted, continuously oscillating downwards, leading to a significant blow to retail investors' confidence. People are beginning to doubt whether the bull market has ended, and the market is starting to fill with a new round of skepticism and confusion.
After the mid-game phase is completed, starting from November 2024, when Bitcoin breaks through 73,777, it basically marks the beginning of the second half of the bull market. The main representative of this phase is Bitcoin's continuous crazy rise after breaking through 73,777, with little pause until it approaches 100,000. Ethereum's rebound after the decline smoothly turned into a reversal after the drop, and altcoins have risen from low levels, generally bottoming out at 1 to 3 times. These phenomena basically indicate that the second half of the bull market has begun.
Making money in the second half of the bull market will be easier because once the market reaches a certain height, the consensus of the bull market will further strengthen, and the bullish cohesion in the market will become more solid. In this case, all market forces will converge, and everyone will work together, making explosive growth much easier. Therefore, during this phase, one should prepare more funds and be ready to go all out, as whether the market can make money in the coming years will depend on this wave.
The reason I say we are currently in the early stage of the second half of the bull market is mainly that the market has just started to show some improvement, and it has not yet reached a stage of unanimous bullish sentiment. Many people are still cautious about the current market. When everyone no longer worries about a significant pullback and is no longer fearful of heights, the market will gradually transition to the mid or later stages of the second half of the bull market.
BTC Mid to Long Term
Weekly:
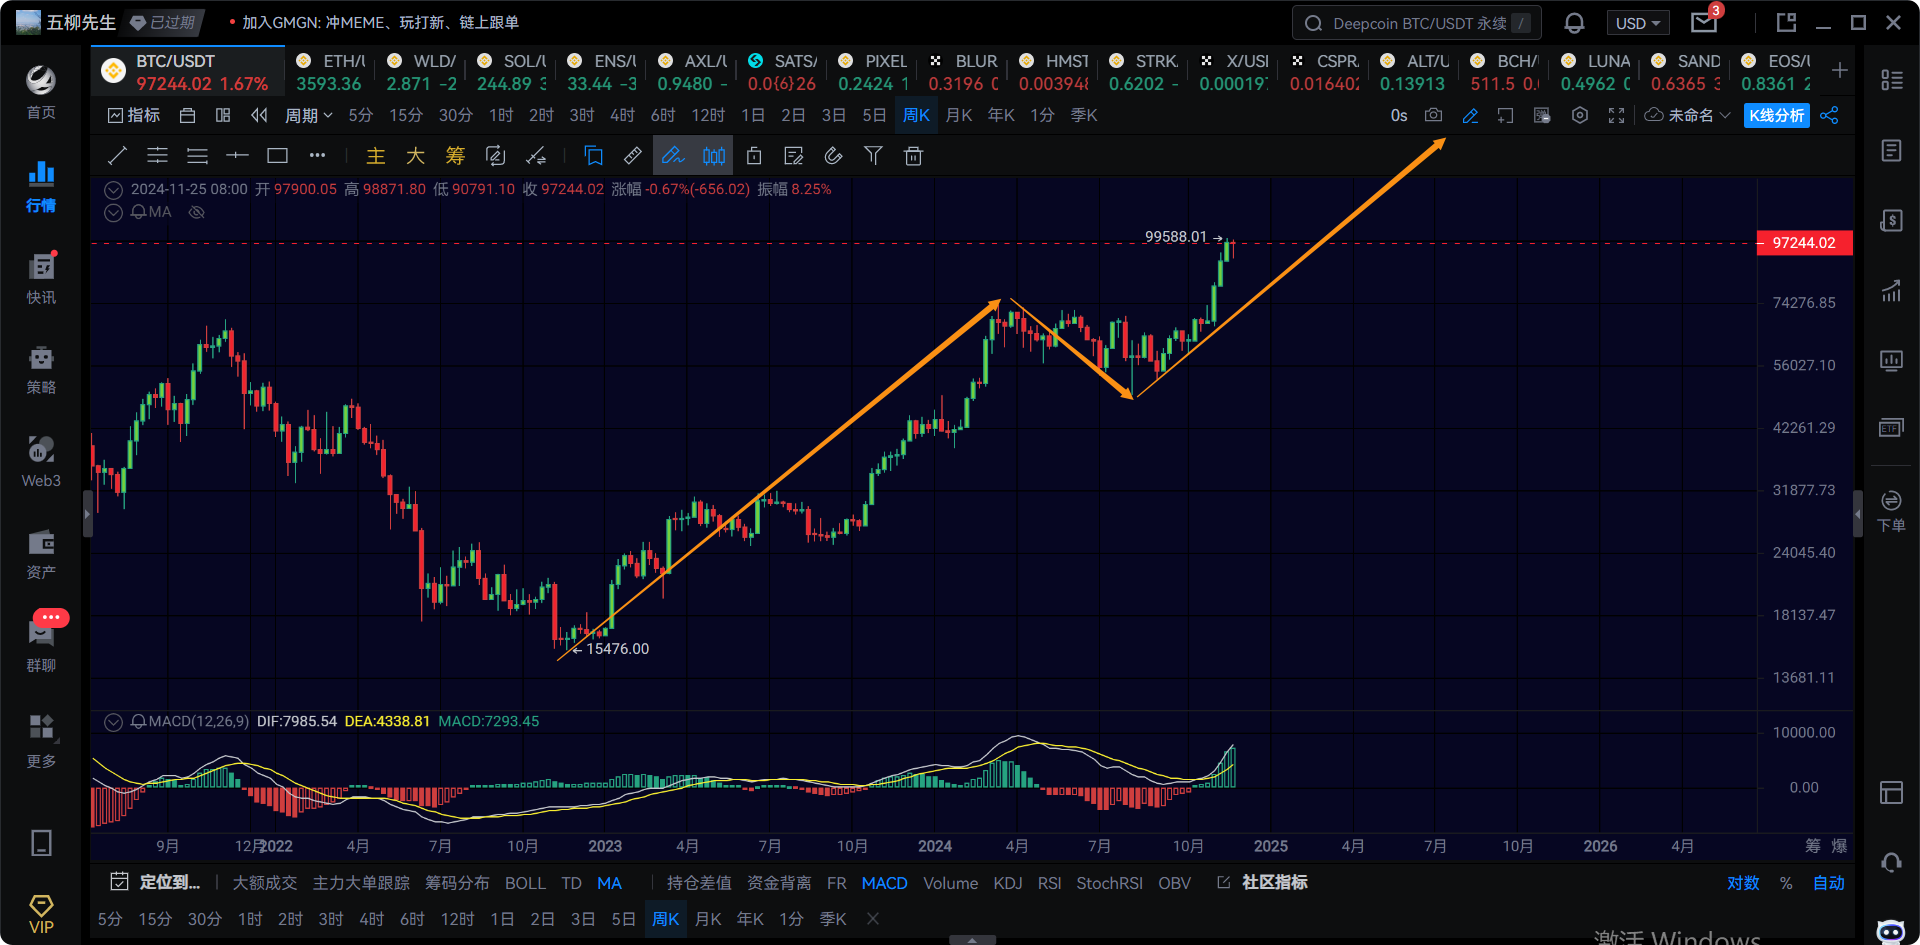
On the weekly chart, we are currently in the third wave of the weekly uptrend. It is still uncertain how long this weekly uptrend will last; initially, we look towards mid-2025. As for whether it can extend longer, we will discuss that later. The overall target is to focus on the range of 150,000 to 200,000. Of course, this target is just a preliminary estimate; where the final rise will reach is unknown.
Daily:
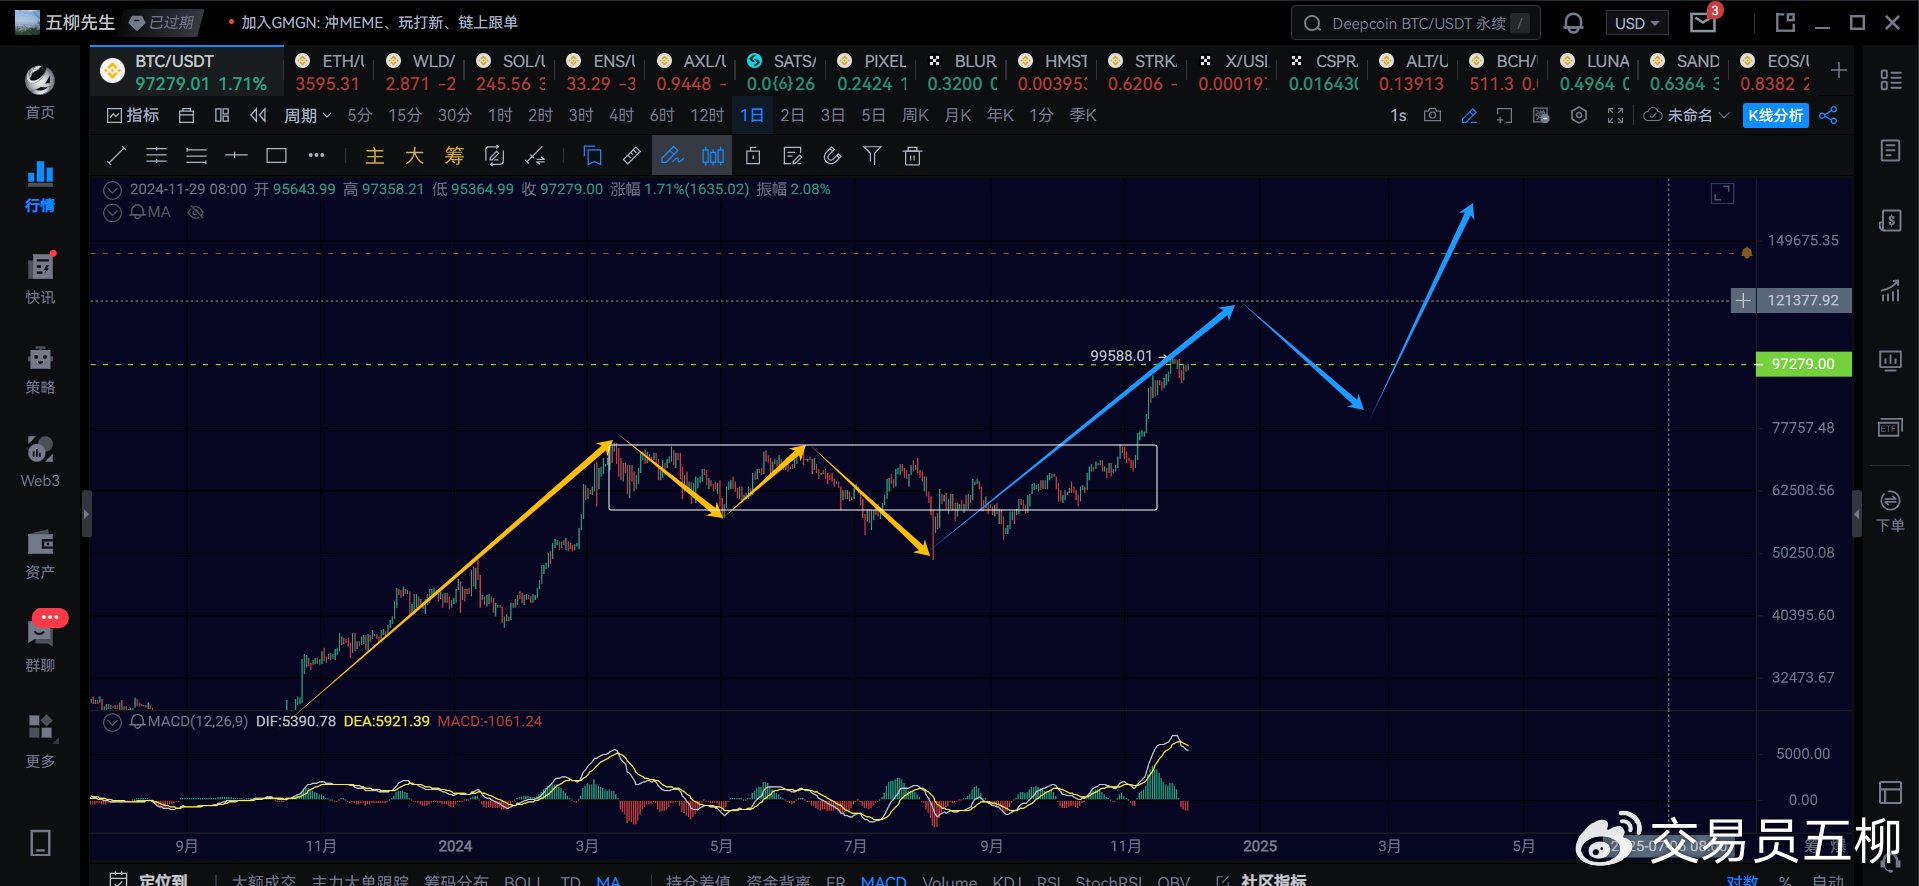
On the daily chart, we are currently in the first wave of the daily uptrend within the weekly uptrend. This daily uptrend has not yet ended, and it is expected to further break through 100,000, reaching around 120,000. This daily uptrend still requires at least one more 4-hour uptrend, expected to run until the end of December or early January, after which a daily pullback will occur. There is a gap in the range of 78,000 to 80,000, and it is uncertain whether the next daily pullback will provide this opportunity.
Once the daily pullback is completed, as long as it does not fall below 73,000, the overall upward trend will remain intact, and there will still be a daily uptrend to higher positions, such as the range of 150,000 to 200,000. As for whether a daily center will be established later, we will discuss that later.
Based on the current height, after Bitcoin stands above 100,000, will the altcoin market go crazy?
4H:
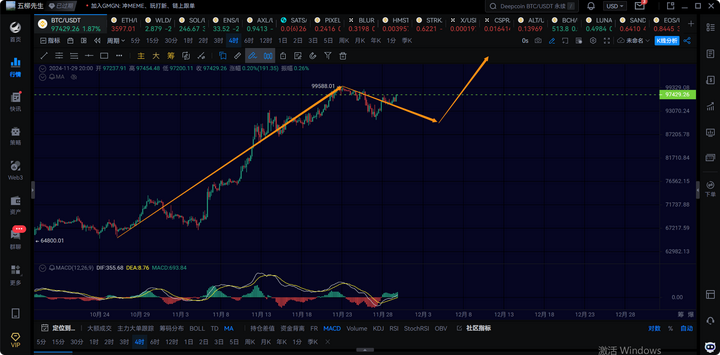
On the 4-hour chart, a 4-hour pullback is expected here, but it is merely a shallow pullback, so there is no need to overly worry about the market declining. In the next few days, if Bitcoin can oscillate back to around 90,000, that should be about it. There will still be a new 4-hour uptrend, with the next target being around 116,000 to 120,000.
Of course, there is another scenario where Bitcoin makes a new high by breaking through 99,588, which would indicate that the 4-hour pullback has not yet started. But there is no need to worry; even if it makes a new high in the short term, it will still need to undergo a 4-hour pullback afterward.
BTC Short Term
Due to the rapid changes in the market, this article can only make predictions based on the market conditions at the time of publication. Short-term players should pay attention to the latest market changes, which are merely for reference.
1H:
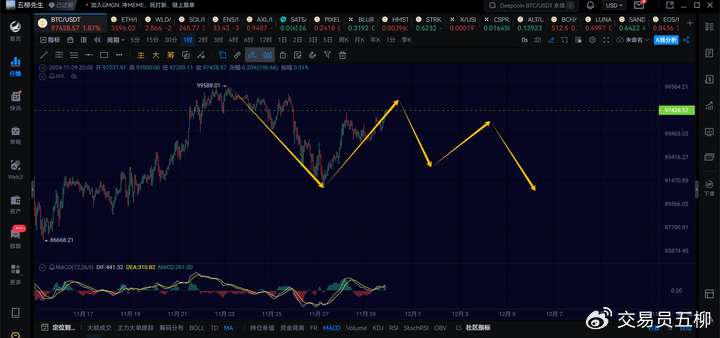
On the 1-hour chart, as long as this 1-hour rebound does not break through 99,500 again, it is still in the process of a 4-hour pullback. Currently, we are looking to see if it can push up to the 98,000 to 99,000 range. It is expected that a 1-hour pullback may occur in the next day or two, with a focus on around 93,000. After that, it may consolidate into a 1-hour center before retracing to the 91,000 to 90,000 range.
Of course, if it breaks through 99,500 again, it would indicate that the 4-hour pullback has not yet started and is still an extension of the previous rebound. However, it won't go much further up and will still undergo a 4-hour pullback. So, at this stage, it can be understood as an adjustment phase of the upward continuation, and pullbacks during the adjustment phase are opportunities.
15M:
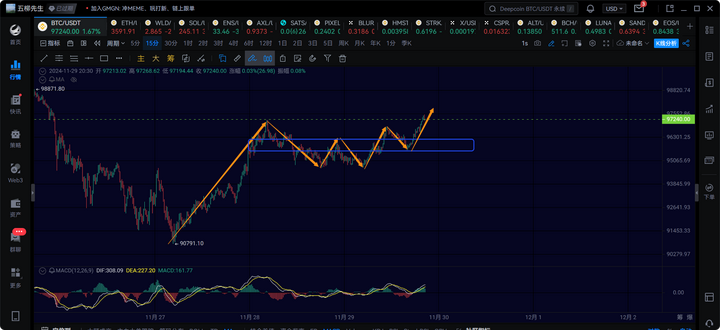
On the 15-minute chart, the 1-hour uptrend has finally emerged. In the short term, we should see if it can push up further, ideally reaching around 98,000. If the 15-minute chart breaks below 96,200 again, it would indicate the end of the 1-hour rebound, and a 1-hour pullback would begin.
ETH
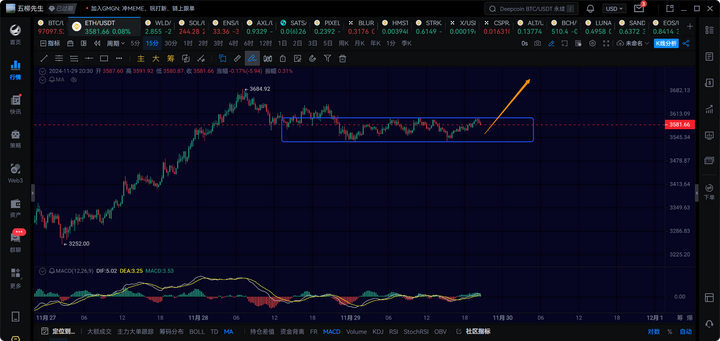
On the 15-minute chart, it is currently in continuous oscillation. Normally, Ethereum should make a push towards 3,700, but it has not done so yet. Therefore, we need to observe this. If it breaks below 3,440, it is inclined to undergo a 1-hour pullback, and if it breaks below 3,350, it should undergo a 4-hour pullback. Overall, Ethereum is still in a daily uptrend that started from 2,100, with an expected target of around 4,000 or slightly above 4,200. The weekly uptrend for Ethereum is to break through 4,800 and create a new historical high.
Trend Direction
Weekly Level: Direction is upward, currently in a new weekly uptrend, with an overall target above 150,000.
Daily Level: Direction is upward, with the daily uptrend expected to reach around 120,000.
4-Hour Level: Direction is downward; if it does not break through 99,500, it should still be a 4-hour pullback.
1-Hour Level: Direction is downward; after the 1-hour rebound ends, the price will oscillate downwards again to complete a 4-hour pullback.
15-Minute Level: Direction is downward; the 1-hour rebound is almost over. If it breaks below 96,200 again, it would indicate a new 1-hour pullback.
Feel free to follow my public account for discussion and exchange:

The article is time-sensitive; please pay attention to risks. The views in the article are personal suggestions and for reference only!
免责声明:本文章仅代表作者个人观点,不代表本平台的立场和观点。本文章仅供信息分享,不构成对任何人的任何投资建议。用户与作者之间的任何争议,与本平台无关。如网页中刊载的文章或图片涉及侵权,请提供相关的权利证明和身份证明发送邮件到support@aicoin.com,本平台相关工作人员将会进行核查。


