The article compares the economics of Ethereum and Solana through data analysis, revealing Ethereum's advantages in fees, value accumulation, and on-chain profitability, while pointing out that Solana has not yet achieved on-chain profitability and relies on inflation and token incentives.
Author: @JustDeauIt
Translation: Blockchain in Plain Language

Regarding Ethereum and Solana, the timeline is filled with many misconceptions. It's time to cut through this noise with a data-driven approach.
This is why I created this amazing dashboard, which compares the economics of these two networks in the following areas:
Market entry strategy
Value accumulation
Total economic value
Cost of generating $1 in fee revenue
Network fundamentals
Performance and valuation
It combines both quantitative and qualitative analysis.
Here are some key points and the final dashboard link via @tokenterminal 👇
1. Network Costs
The cost of trading on Arbitrum is about 50% cheaper than on Solana. In fact, the trading costs on the earlier L2s are even lower.

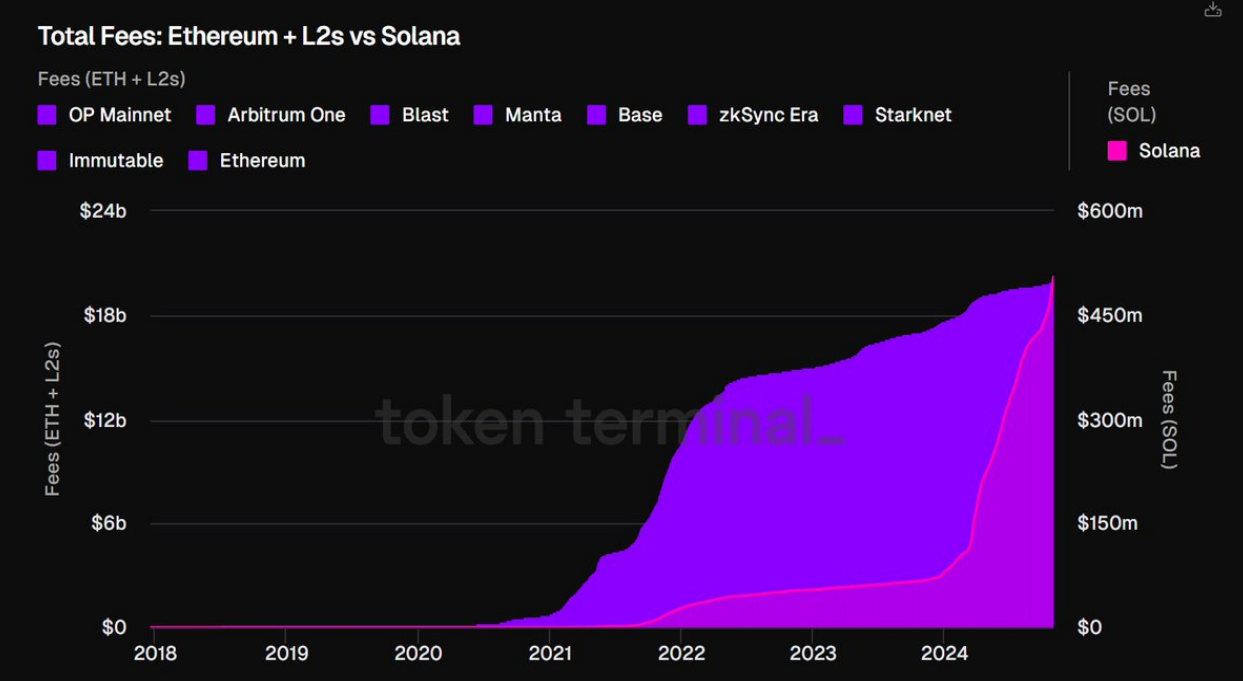
2. Turning to Total Network Fees:
Key points:
The total fees for Ethereum and top L2s are close to $20 billion. 97.5% of the fees come from L1 (with top L2 fees at $479 million). Solana's historical total fees amount to $495 million, of which 87% were generated this year.
The trend favors Solana, as in the past 90 days, the network fees generated by Solana accounted for 41% of Ethereum's total fees (excluding MEV). The reason for including L2 is that they create demand for ETH and settle transactions to L1. If these two economic connections are broken, we will no longer consider them.

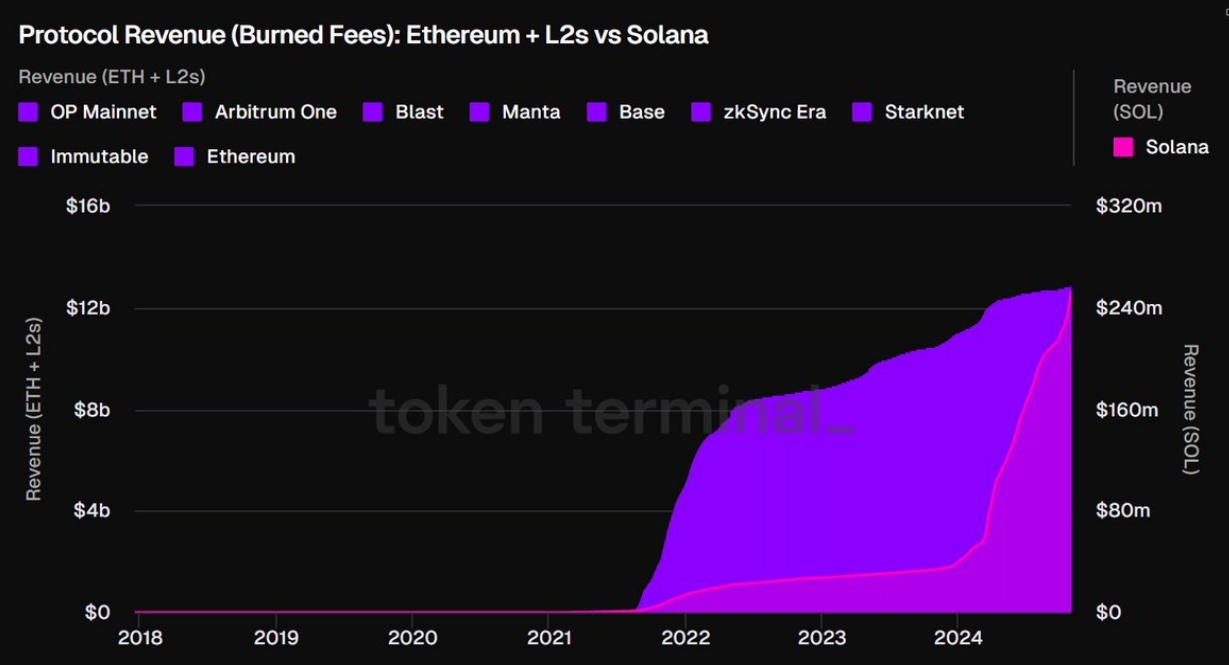
3. Protocol Revenue
Next is protocol revenue (tokens that are burned, providing value to non-stakers):
Key points:
64% of Ethereum's historical transaction fees ($12.4 billion) have been burned, accumulating value for ETH token holders.
50% of Solana's historical transaction fees ($247 million) have been burned (only 2% of Ethereum's).
Currently, L2s do not have a value accumulation mechanism for token holders.

4. Supply-side Fees (paid to validators)
Key points:
Ethereum has paid $7 billion (36%) of historical fees to supply-side validators (with $400 million this year to date).
Solana has paid $247 million (with $212 million this year to date).
How is Solana closing the gap? Through token incentives/inflation. Solana has issued $3.2 billion in incentive payments this year, while Ethereum has issued $2.3 billion.

5. Comparing Total Economic Value (Network Fees + MEV + Token Incentives)
Key points:
In the past 90 days, Ethereum's total economic value was $1.03 billion (of which 58% came from token incentives).
During the same period, Solana's total economic value was $1.19 billion (of which 79% came from token incentives).
If we focus on actual economic value (fees + MEV), Ethereum ($431 million) outperformed Solana ($254 million) during the same period.
Over 51% of Solana's actual economic value comes from MEV (measured through Jito fees), while Ethereum's is 29% (measured through Flashbots fees).

6. Cost of Generating $1 in Revenue
Key points:
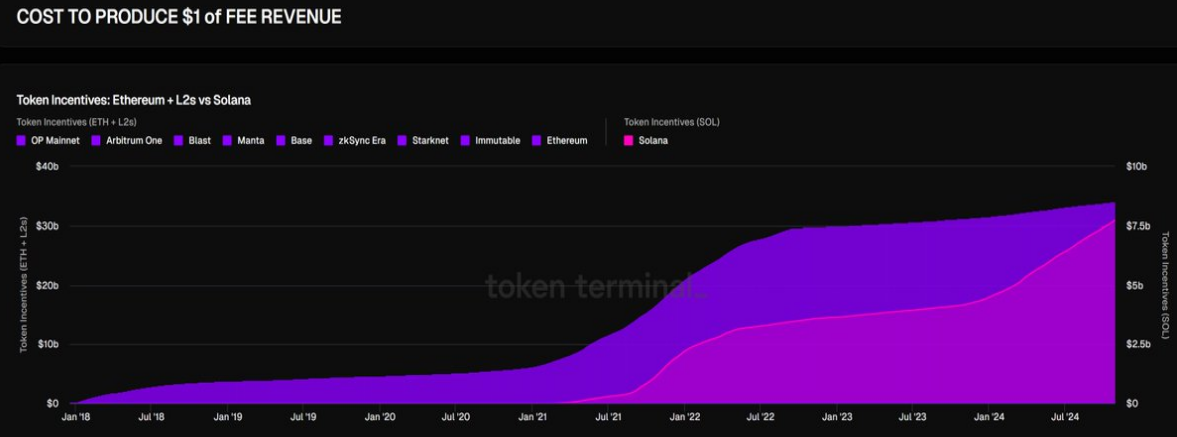
Here, we measure the expenditure of token holders (token incentives) to generate $1 in fees.
*Token incentives = costs for unstaked token holders, income for stakers/validators.
To date, Ethereum has paid $2.65 billion in token incentives to generate $2.06 billion in network fees (spending $1.28 for every $1 in fees generated).
During the same period, Solana has paid $3.26 billion to generate $428 million in fees (spending $7.62 for every $1 in fees generated).
From an on-chain perspective, a Layer 1 becomes profitable when its fee revenue can compensate the network's supply side without relying on token incentives/inflation.
Ethereum achieved this for most of 2023 and the first quarter of 2024. However, after the EIP-4844 network upgrade, fees decreased, making the network slightly inflationary (annualized at 0.4% based on third-quarter inflation).
Solana has not yet achieved on-chain profitability, with its current inflation rate close to 5% (which is necessary in the early stages—Ethereum also had high inflation in its formative years).

The above is a brief overview of some data-driven and qualitative insights available in the dashboard at @tokenterminal.
If you want to view it and draw your own conclusions, you can access the link here: https://tokenterminal.com/terminal/studio/dashboards/11974884-5d10-4e90-91be-ffc77ddb105b
Feel free to comment and discuss.
Article link: https://www.hellobtc.com/kp/du/11/5509.html
Source: https://x.com/JustDeauIt/status/1851993593193337064
免责声明:本文章仅代表作者个人观点,不代表本平台的立场和观点。本文章仅供信息分享,不构成对任何人的任何投资建议。用户与作者之间的任何争议,与本平台无关。如网页中刊载的文章或图片涉及侵权,请提供相关的权利证明和身份证明发送邮件到support@aicoin.com,本平台相关工作人员将会进行核查。


