Conveying the Way of Trading, Enjoying a Wise Life.

Today is the 31st, and tomorrow we will close the monthly chart. Let's take a look at how Bitcoin performs on the monthly chart! If you can't see the trend or price movement in a small cycle, you can look at the previous cycle. If you still can't see its true nature in the last cycle, push it back another cycle. The larger the cycle, the better the stability, and the more interference is excluded, which helps you grasp the overall trend or make a directional judgment, beneficial for eliminating numerous distractions in our subsequent trading process. As everyone knows, we repeatedly emphasize in our future live broadcasts or videos, if the trend is established, any action may seem redundant. If you don't believe it, you can mess around during a bull market, and in the end, apart from regret and remorse, you should gain nothing.
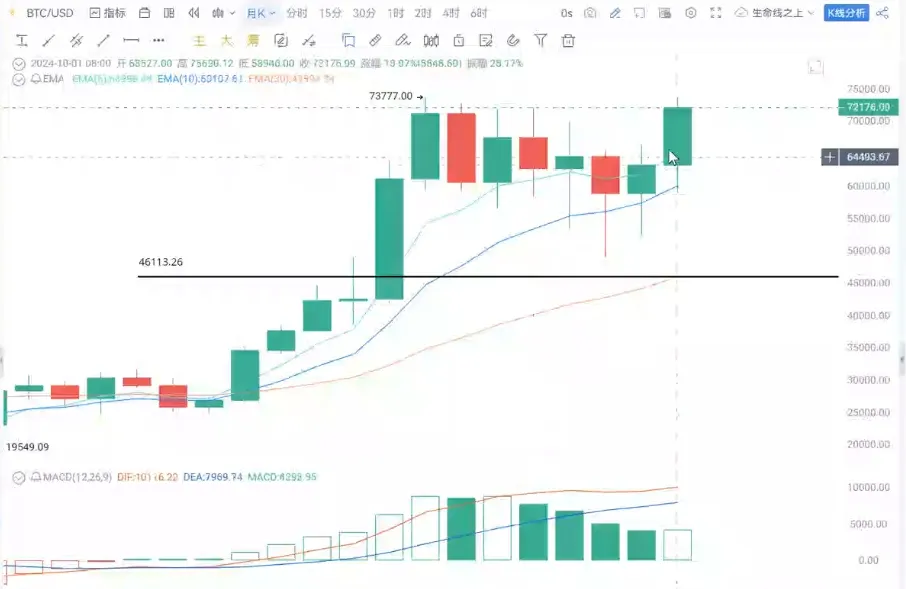
Returning to the technical aspect of the monthly chart, we are concerned that Bitcoin's MACD indicator may form a death cross, creating a divergence. If such a situation occurs, the consequences could be quite serious. This month, Bitcoin's movement has basically reached the previous high point of over $73,000. At this point, the probability of closing with a medium to long bullish candle is very high, which is the first issue we need to consider.
The second issue is that Bitcoin has consolidated from $73,000 until September or October, for about 7 or even 8 months. Now that it has touched the previous high this month, it is very likely to break through the previous high. If this breakthrough occurs, Bitcoin reaching $100,000 should be just around the corner. Even when Bitcoin broke the weekly downtrend line at $69,000, we had already reminded everyone that Bitcoin had opened up upward space.
Some people say it's due to the U.S. elections, but it doesn't really matter. Everything has a cause, and when the time comes, any triggering event or cause can push the market up. Moreover, Nine Brother's view is that regardless of the election results, Bitcoin's trend should not be affected at all, with only temporary fluctuations. This is the price trend of Bitcoin.
Returning to Ethereum's trend, it has formed a death cross on the monthly chart, but as for Ethereum, its current price is still near the 30-month moving average, with the lowest point dipping below the 30-month moving average. Currently, the 30-month line on the monthly chart is horizontal, and overall, it still shows an upward trend. The only unfriendly aspect is that the MACD has formed a death cross near the 0 axis, which is something we are concerned about. However, in the past three months, Ethereum's lows have been continuously rising, which is a good phenomenon.
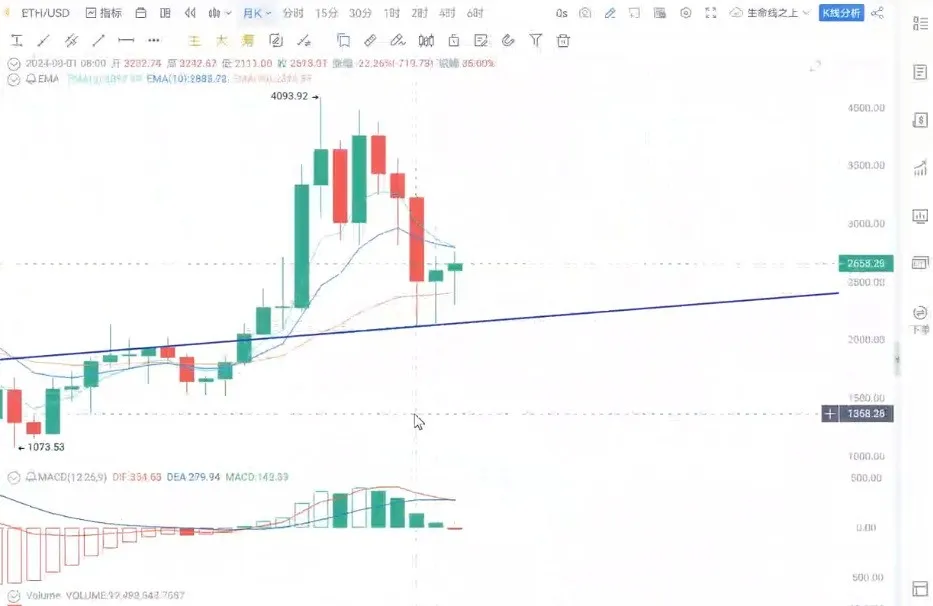
As for why Ethereum is performing so poorly, will it experience a significant weakening or decline? Cryptocurrencies have gone through many judgments of death sentences, but ultimately they still emerge. As the second in command, Ethereum, I think if you don't have a position, you can take this opportunity to buy in at a relatively low level. Other factors and concerns should not affect your faith in the establishment of the trend. This is the analysis and simple interpretation of Ethereum's price trend, currently still in the low zone, which is a reminder for everyone.

For SOL's price, we can see that in March and April, it formed a long bullish candle followed by a long bearish candle. Such a situation is rarely seen, but these two lines are parallel, which means that SOL's subsequent trend will be a consolidation. Therefore, its overall price is consolidating and oscillating between $180 and $120. $120 is actually the previous high point during the last bear market rebound, and at this point, it has already gained effective support.
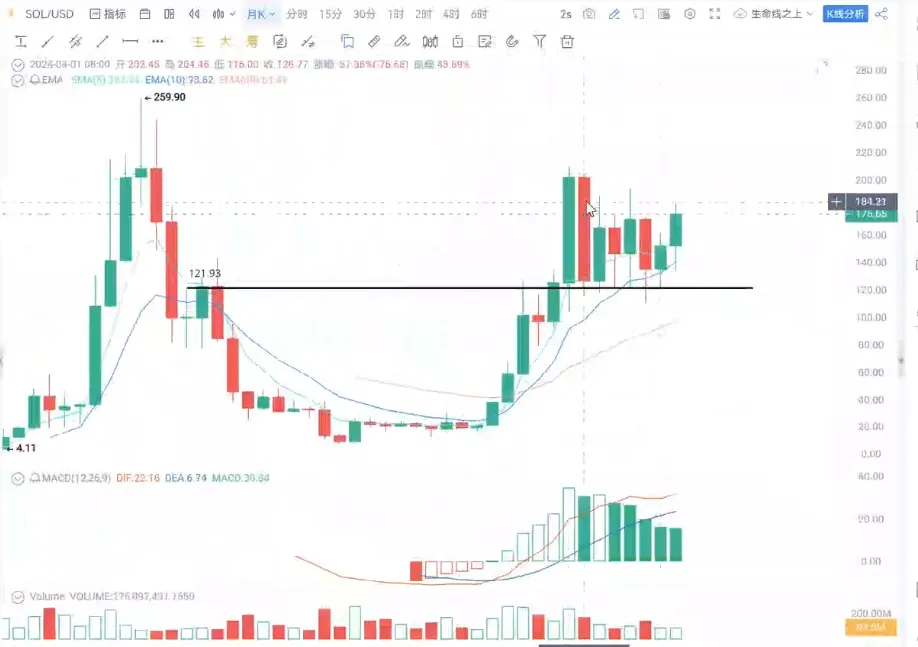
So as long as SOL breaks through the weekly downtrend line at $183, it will open up upward space just like Bitcoin. As for how far it will go in the future, it depends on the situation. Once SOL's price breaks $183, it may experience a powerful main upward wave, similar to what it showed when it was at $20.
**I still say, after the trend is established, try to minimize your operations, because the more you operate, the more mistakes you make, and the further you get from your profits.
**To learn more, you can contact our assistant and join the VIP group.
免责声明:本文章仅代表作者个人观点,不代表本平台的立场和观点。本文章仅供信息分享,不构成对任何人的任何投资建议。用户与作者之间的任何争议,与本平台无关。如网页中刊载的文章或图片涉及侵权,请提供相关的权利证明和身份证明发送邮件到support@aicoin.com,本平台相关工作人员将会进行核查。