Don't worry if you have no confidant on the road ahead, there are like-minded people on the investment road. Good afternoon, everyone! I am Bit King from the Coin Victory team. It's time to say our classic line, "I miss you all." Due to various trivial matters before, I neglected the video aspect, but starting from today, I will resume this and hope that the brothers who have been following the Bit King will come back.
Click the link to watch the video: https://www.bilibili.com/video/BV1R5shewE7Z/

Without further ado, let's get started. First, let's review the current price strategies given in yesterday's live broadcast and communication group. Bitcoin gave a short entry signal around 63600, and Ethereum gave a short entry signal at 2650. Subsequently, Ethereum gave a signal to add to the position at 2680. This morning, Bitcoin gave a short exit signal at 62700, and Ethereum gave a short exit signal at 2612. The overall profit was very good, almost capturing all the profits of the market. Congratulations to the friends who entered the live broadcast and communication group. Next, let's take a look at the specific market analysis. First, let's look at Bitcoin. The current price trend of Bitcoin shows that it encountered strong resistance near the previous high of 64K, followed by a price adjustment. This adjustment mainly focuses on short-term range fluctuations, showing a box oscillation trend on the technical side. Here are the specific analysis points:
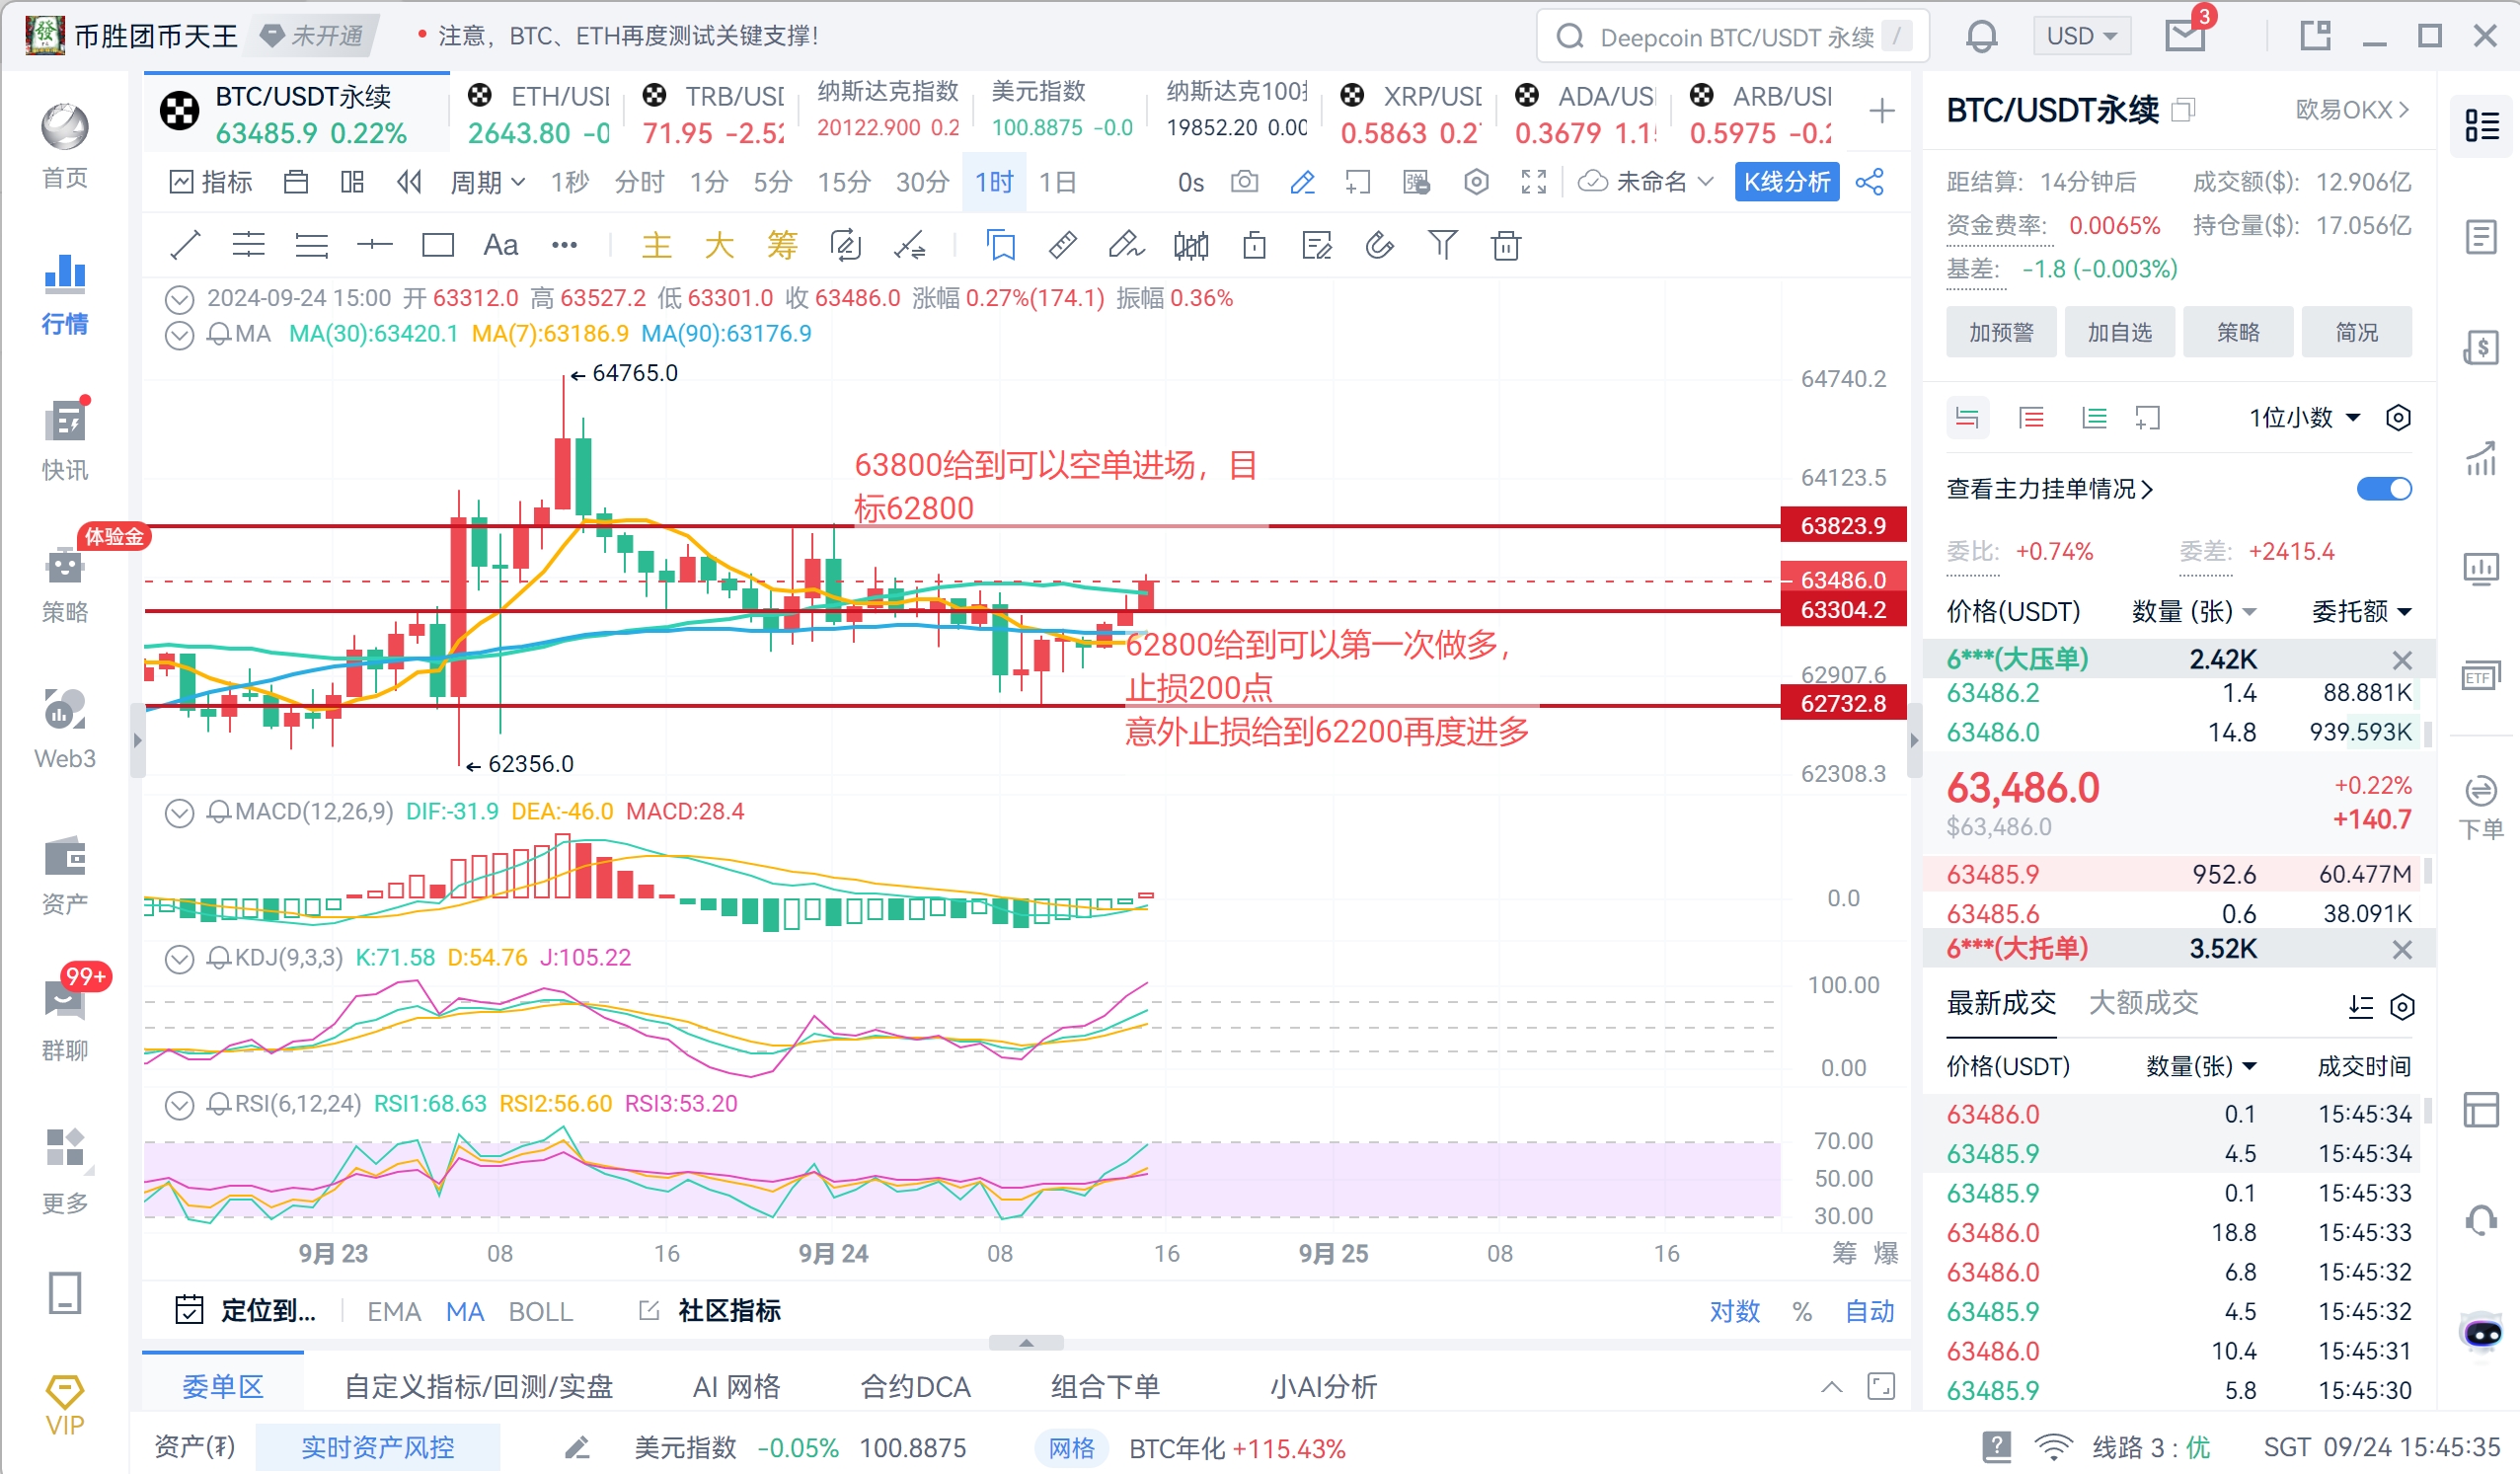
Box range and key support resistance: Resistance: The first resistance is near 63300. If Bitcoin can break through this level, it is expected to further test the second resistance at 63800. If the price successfully rises above 63800, a stronger rebound can be expected, and there is even a possibility of retesting the area above 64K. Support: The first support is near 62700, currently an important short-term support level. If it falls below this level, the price may further test 62200 or even lower to 62K. The second support at 62200 is also a strong defensive line. Once the price falls below, it may lead to more bearish sentiment release, pushing the market further down.
Short-term trend: Looking at the 1-hour chart, after the failed test at 64K, Bitcoin entered a oscillating adjustment phase, and the price is still within the box range. Although there are signs of breaking the upward channel in the near term, the rebound momentum has not diminished, and market sentiment has not fully turned bearish. If it can hold the support at 62700 and break through the resistance at 63300 again, Bitcoin still has the potential to continue to rebound. But if the support is lost, caution is needed for downside risk.
Trading strategy recommendations: Short-term long: Look for buying opportunities in the range of 62700 to 62200 and gradually take profit when the price rebounds to test 63300. The key is to pay attention to whether the price breaks through the 63300 resistance with trading volume. If it does, there is potential for further upward movement. Short strategy: If the price falls below the 62200 support accompanied by increased volume, consider going short with the target set at lower key support levels.
Market sentiment: The current market is still in a cautious stage and needs time to correct after the previous surge. Therefore, there may be oscillating trends in the short term. It is recommended to pay attention to changes in trading volume and the breakthrough of the box range.
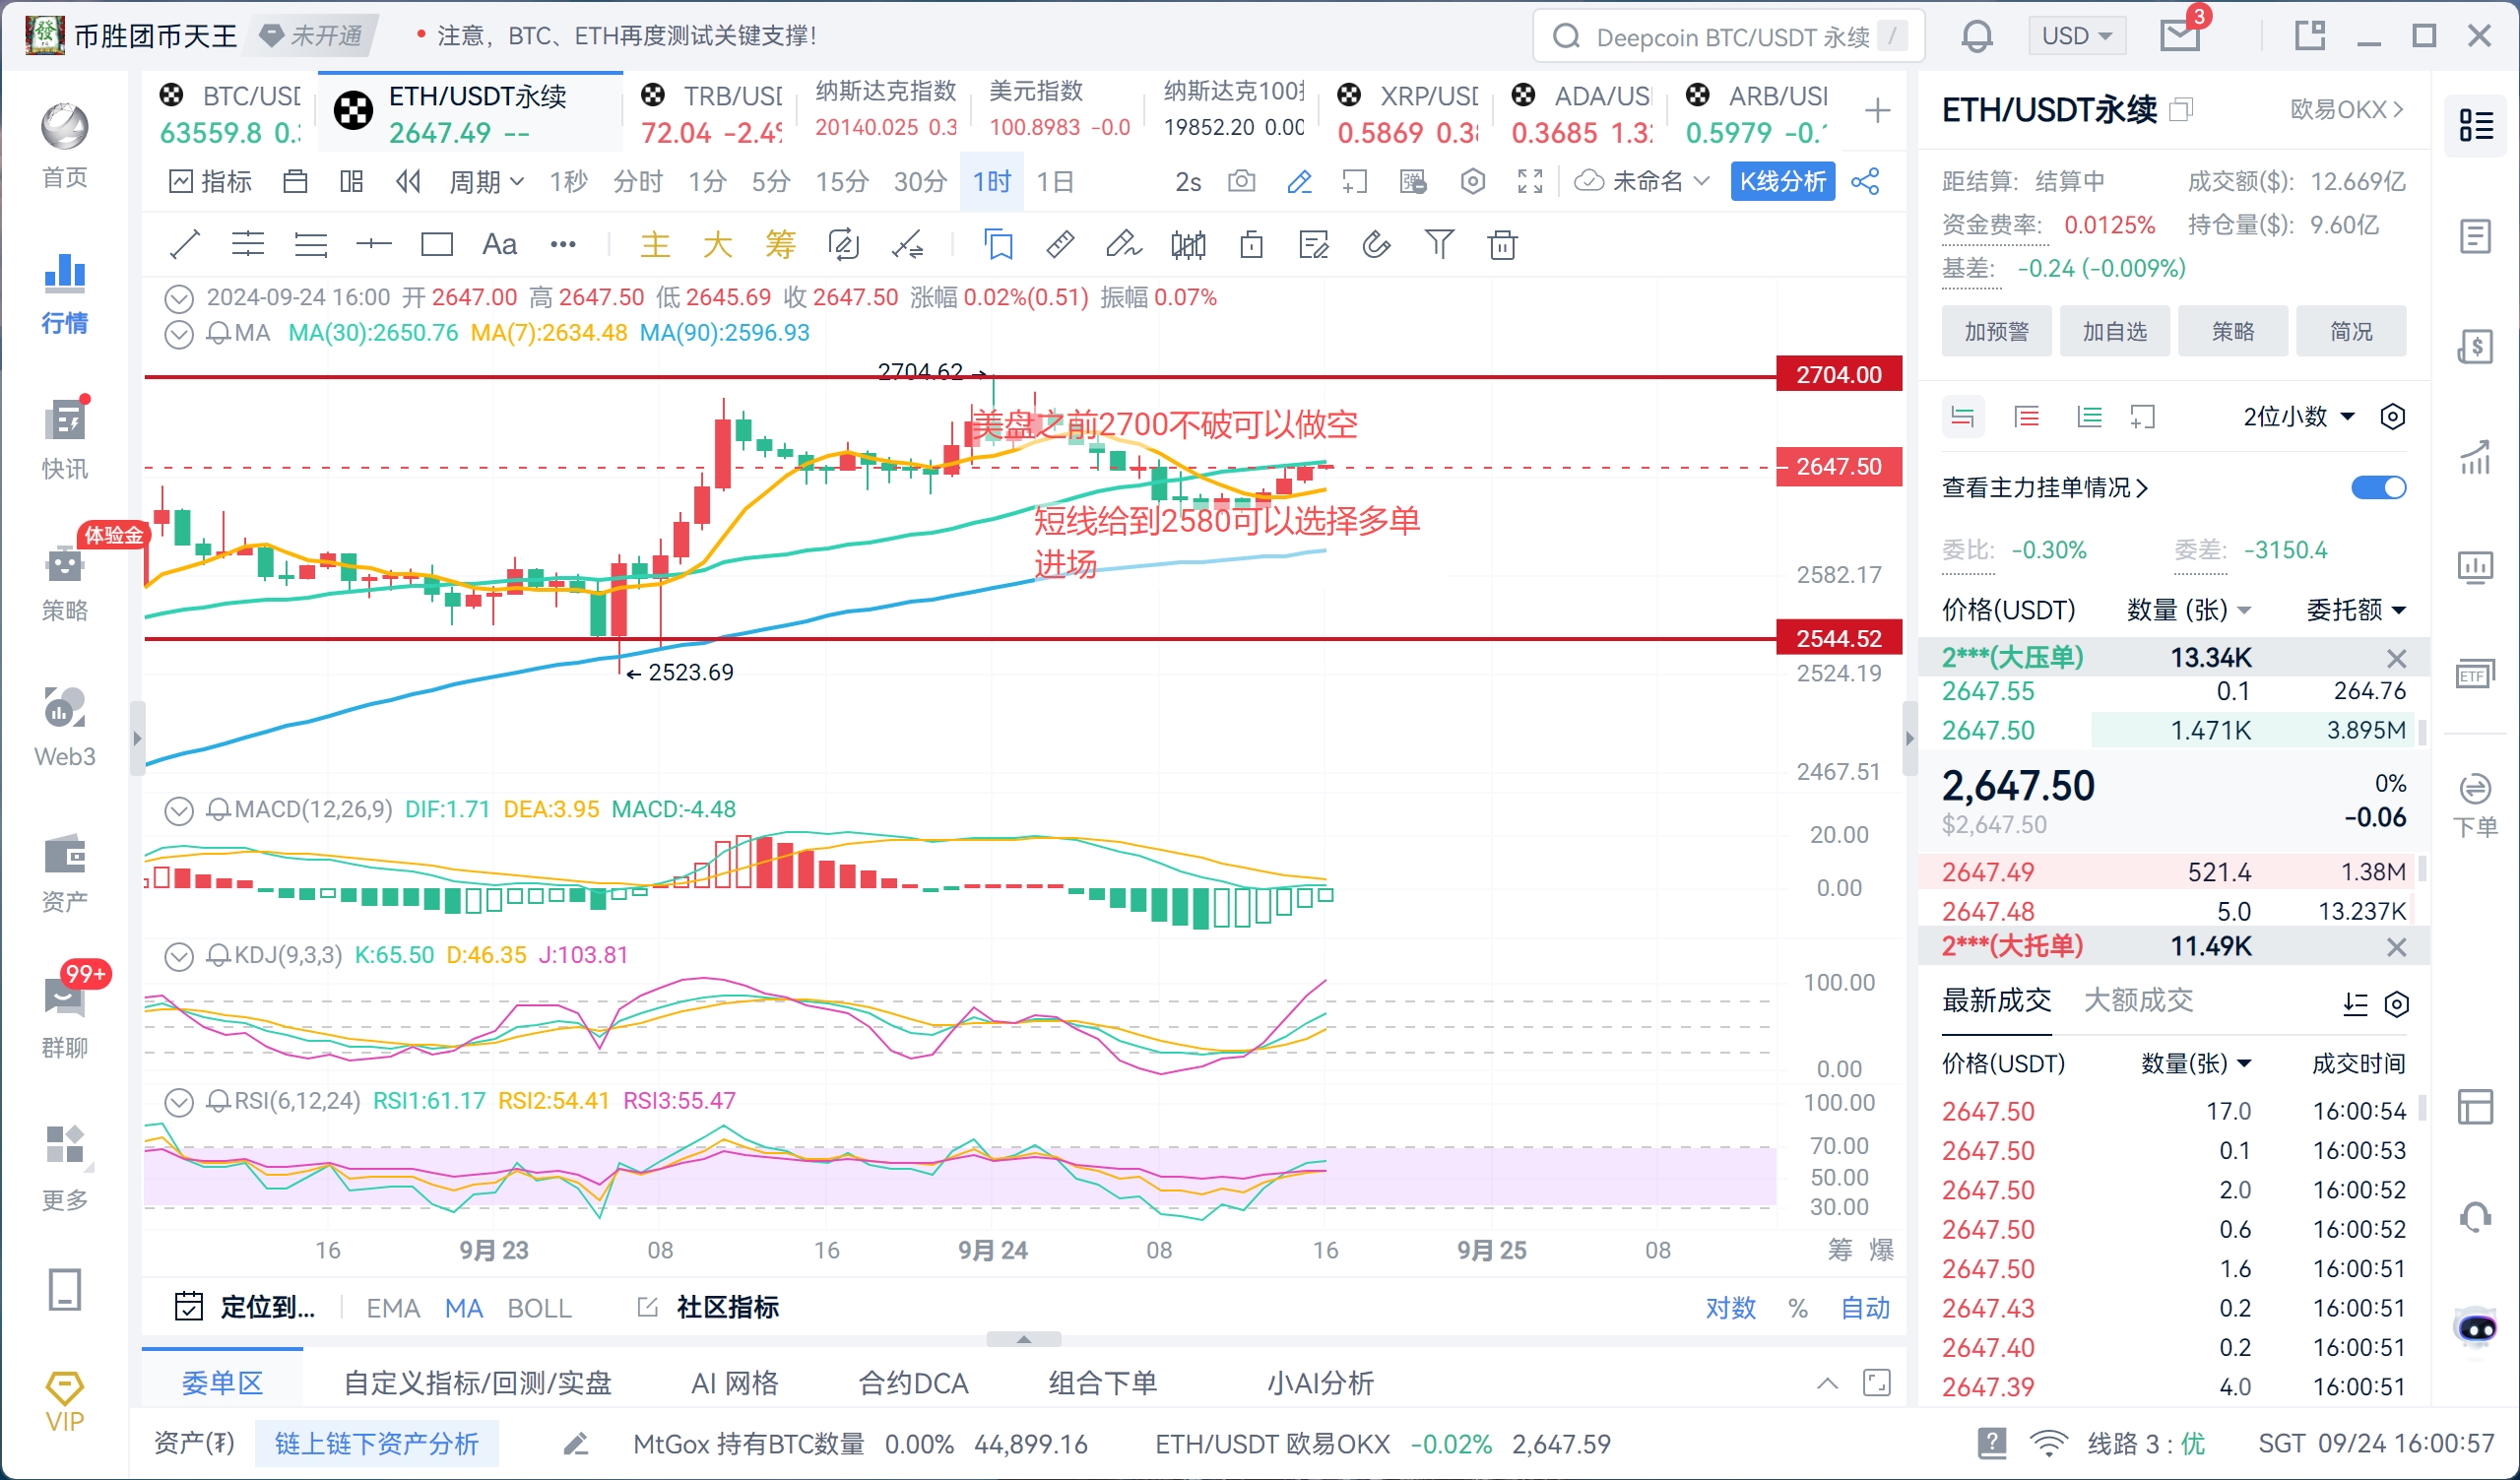
Now let's look at Ethereum. The price of Ethereum (ETH) is fluctuating between approximately $2,600 and $2,680. Currently, the market is facing macroeconomic uncertainty and expectations of future rate cuts by the Federal Reserve, which may affect the overall trend of Ethereum and the cryptocurrency market. Ethereum's price has shown some oscillations in the past few days, and investors need to closely monitor changes in the global economic environment, such as the trend of the US dollar and institutional selling of ETH. Here are several key factors affecting the trend of Ethereum in September 2024:
Macro-economic environment and potential rate cuts by the Federal Reserve: If the Federal Reserve decides to implement rate cuts in the future, it may drive capital into risk assets, including cryptocurrencies. Rate cuts often weaken the US dollar, prompting investors to enter the cryptocurrency market, thereby boosting the price of Ethereum. Market capital inflows: The market value of stablecoins has increased recently, indicating an increase in capital inflows into the cryptocurrency market. This also helps support the price of Ethereum.
Short-term technical analysis: Currently, Ethereum's price range is hovering between $2,600 and $2,700. If the lower support level ($2,623) can hold, it may support further upward movement in the price in the next few days. The upper resistance level is expected to be around $2,750 to $2,770.
Institutional selling pressure: Recently, the Ethereum Foundation transferred 35,000 ETH (about $94 million) to Kraken, raising concerns in the market about selling pressure. Although this transfer may not immediately affect the price, investors still need to pay attention to subsequent market fluctuations. 4. Specific operational ideas: For Ethereum, a long position can be entered at 2580 with a target of 2650, and a short position can be entered near 2680 with a target of 2610. The stop loss for both positions is set at 30 points.

Because the recent market has been mainly oscillating, accompanied by intermittent sharp movements, when placing orders, remember to control take-profit and stop-loss well. In the face of major market data trends in the future, Bit King will also organize live broadcasts across the entire network. Friends who need to watch can find Bit King across the entire network and contact me for the link at that time.

Mainly targeting spot, contracts, BTC/ETH/ETC/LTC/EOS/BSV/ATOM/XRP/BCH/LINK/TRX/DOT, adept at the style of mobile lock position warfare around high and low support and pressure levels, short-term band high and low, medium and long-term trend orders, extreme retracement on the daily K-line, and top prediction on the monthly K-line.
免责声明:本文章仅代表作者个人观点,不代表本平台的立场和观点。本文章仅供信息分享,不构成对任何人的任何投资建议。用户与作者之间的任何争议,与本平台无关。如网页中刊载的文章或图片涉及侵权,请提供相关的权利证明和身份证明发送邮件到support@aicoin.com,本平台相关工作人员将会进行核查。


