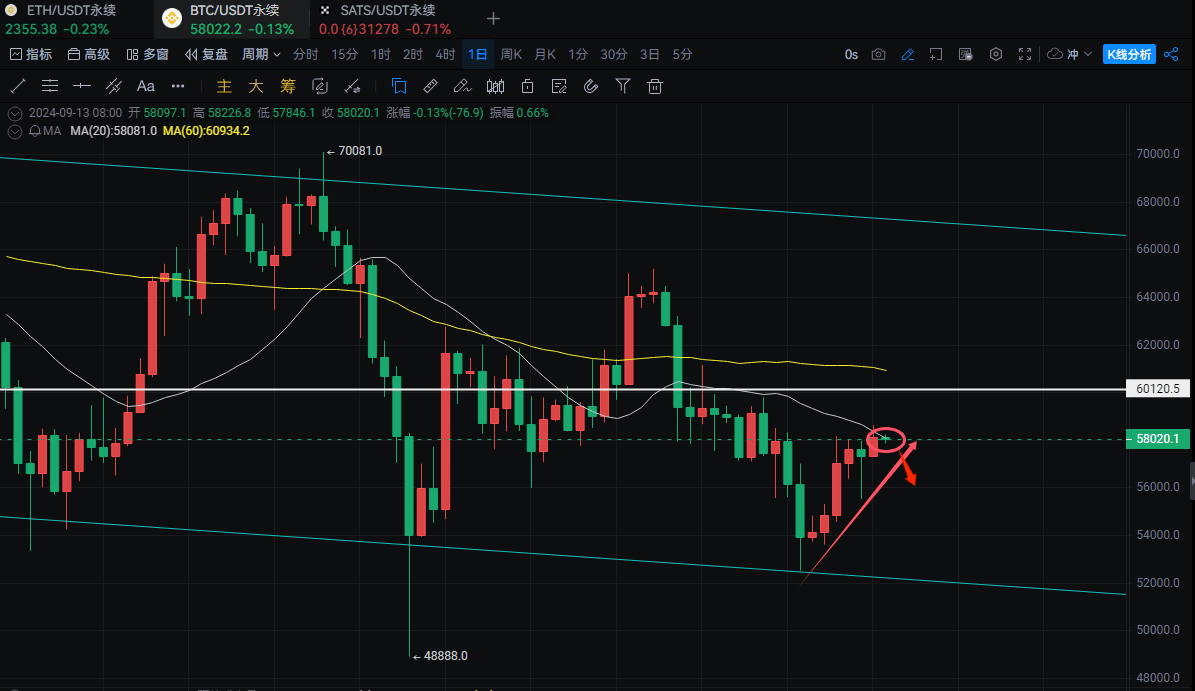
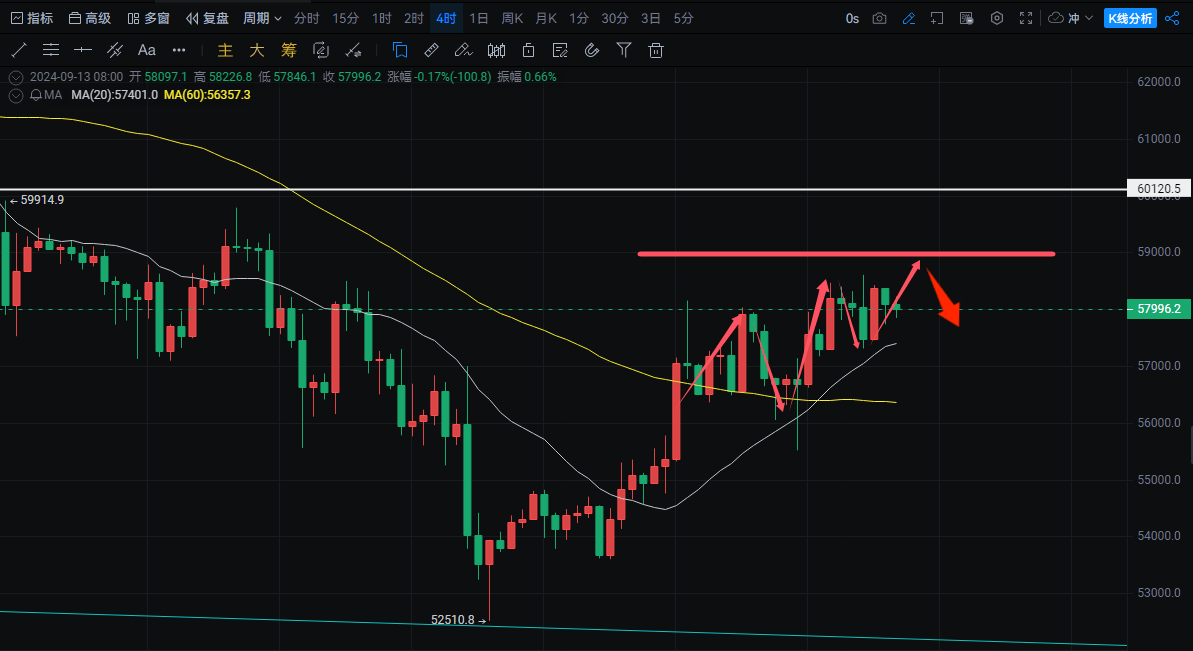
The daily chart of Bitcoin has formed a small bullish candlestick again, consistent with the previous view of a continued upward trend in prices. The bullish momentum is starting to return, and the market continues to warm up. Hopefully, we will soon see the appearance of a large bullish candlestick. The price has just reached the 20-day moving average on the daily chart, and there may be a short-term bottoming out after being suppressed again. There is an opportunity to enter the market if it falls!

In the medium term, the upward oscillation pattern is still maintained, and it is still in the process of the trend conversion mentioned yesterday. The probability of continued upward oscillation in the future is relatively high.

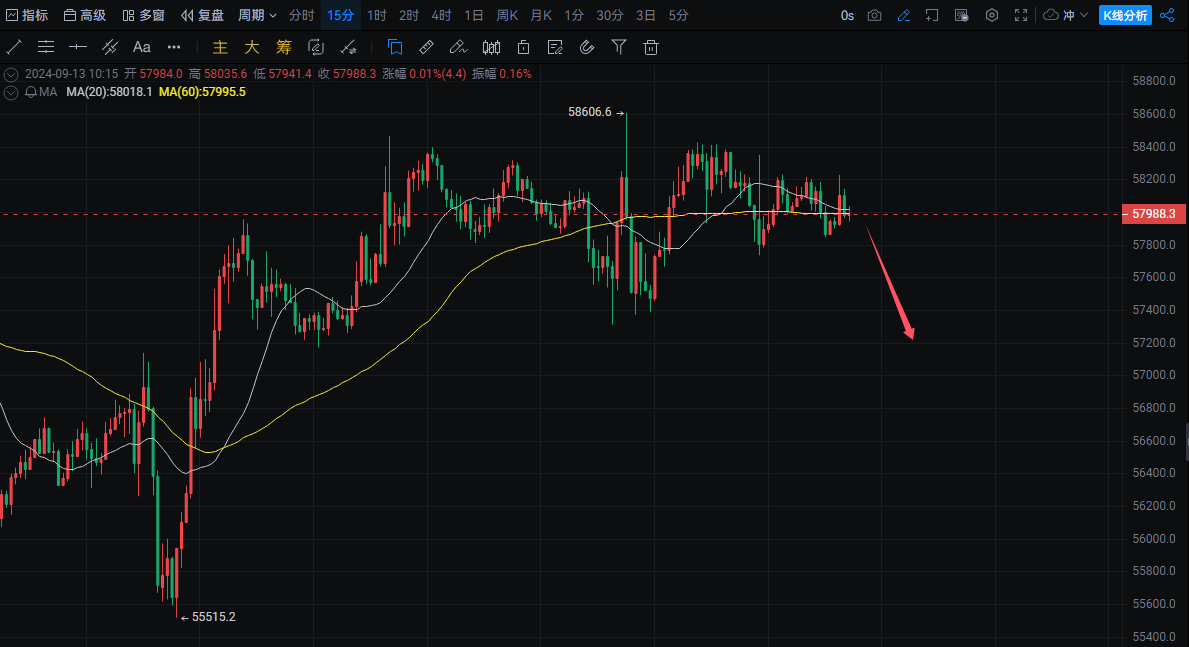
The short-term volatility continues to narrow, but the market is still highly chaotic. There may be a downward adjustment during the day, but due to the messy trend, there is not much operability, so it can be ignored.

Strategy: Short-term high selling or wait and see
Long-term, stay bullish
免责声明:本文章仅代表作者个人观点,不代表本平台的立场和观点。本文章仅供信息分享,不构成对任何人的任何投资建议。用户与作者之间的任何争议,与本平台无关。如网页中刊载的文章或图片涉及侵权,请提供相关的权利证明和身份证明发送邮件到support@aicoin.com,本平台相关工作人员将会进行核查。


