Using 4 valuation methods to calculate the price of Bitcoin, the results vary greatly. Which one is more accurate?
Author: Viee, Core Contributor of Biteye
Editor: Crush, Core Contributor of Biteye
Recently, BTC has fluctuated and fallen to around $56,000. In July, the US asset management company VanEck predicted that the price of BTC in 2050 would reach $2.9 million, which is indeed a stunning figure.
So, what should be the fair price of Bitcoin? $0, $50,000, or $1 million? Or even higher? In this article, Biteye will explore 4 methods of Bitcoin valuation to help everyone have a more comprehensive understanding of the value of Bitcoin.
Bitcoin Valuation Methods
Traditional assets such as stocks and bonds have established multiple mature and effective valuation methods. However, evaluating the value of Bitcoin faces more challenges, and there is currently no single valuation method that is clearly superior to others. Here are 4 relatively common Bitcoin valuation methods: cost of production model, stock-to-flow model, Metcalfe's law, and AHR999 hoarding indicator.
- Cost of production model: Mining not only consumes a large amount of electricity but also requires other resources, so the cost of mining can be considered as the basic value of Bitcoin.
- Stock-to-flow model: A higher stock-to-flow ratio usually means a higher scarcity of Bitcoin, which may drive its price up.
- Metcalfe's law: This theory emphasizes that the impact of the increase in the number of network users on value growth is exponential.
- AHR999 hoarding indicator: Created by Weibo user ahr999, it assists Bitcoin dollar-cost averaging users in making investment decisions based on timing strategies.
01 Cost of Production Model
Unlike fiat currencies such as the Euro or the US Dollar, which have almost no cost of production, Bitcoin is produced through a complex mining process. Therefore, the production cost of Bitcoin mainly refers to the cost of mining.
In the long run, the cost of mining a Bitcoin is usually close to the market price of Bitcoin. The cost of mining can be considered as the bottom line of the price of Bitcoin, as historically the price of Bitcoin has rarely been lower than the cost of mining for a long time. This phenomenon is partly due to the correlation between the price of Bitcoin and the total computing power (hash rate) used for mining, as well as the impact of the mining competition environment, where less efficient miners are often forced to cease operations. The following figure shows the average mining cost of Bitcoin:
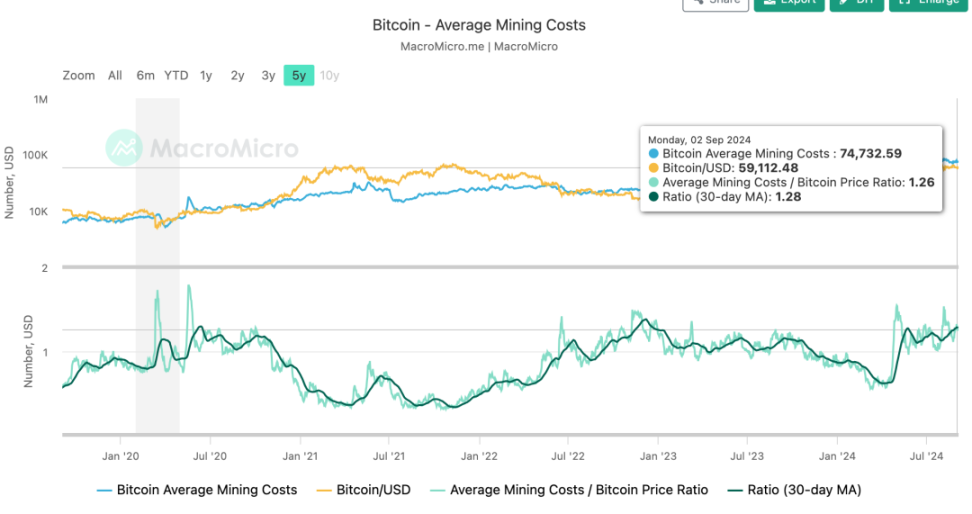
Data source: https://en.macromicro.me/charts/29435/bitcoin-production-total-cost
According to data from the MacroMicro website, as of September 2, 2024, the average mining cost of one Bitcoin is approximately $74,000, which is also the current valuation of Bitcoin calculated based on the cost of production model.
Since the current price of Bitcoin is lower than this mining cost (the valuation calculated based on the cost of production model), this implies that in the near future, one of the following two situations may occur: a decrease in the number of miners, or an increase in the price of Bitcoin to a level exceeding the cost of mining.
02 Stock-to-Flow Model
The stock-to-flow model, also known as S2F, is a method commonly used to evaluate the value of commodities. Specifically, "stock" refers to the current total supply of an asset, while "flow" refers to the annual new supply.
The higher the ratio of stock to flow, the scarcer the asset, because it takes longer to reach the current stock level. For example, if the stock of a commodity is 100 times the flow, it would take 100 years to replenish the current stock. In contrast, if the stock of a commodity is only 10 times the flow, it is less scarce because it would only take 10 years to replenish the current stock. Therefore, the stock-to-flow model provides us with a simple and effective way to measure the scarcity of a commodity. This scarcity is an important factor affecting prices.
Stock-to-Flow Ratio of Bitcoin
As of August 2024, the current circulating supply of Bitcoin is approximately 19,750,000 (stock), and the current block reward for miners is 3.125 Bitcoins, with one block being mined every ten minutes, resulting in an annual production of approximately 164,359 BTC. Therefore, the stock-to-flow ratio of Bitcoin is:
19,750,000 / 164,359 ≈ 120.1
This ratio indicates that at the current growth rate (flow), it would take approximately 120 years to reach the current circulation (stock).
Next, let's take a look at the most important reserve asset globally—gold. According to data from the World Gold Council in 2023, the stock-to-flow ratio of gold is:
209,000 / 3,500 ≈ 59.7
As mentioned earlier, a higher stock-to-flow ratio indicates higher scarcity of the asset. So, according to the stock-to-flow model, the scarcity of Bitcoin is approximately twice that of gold!
However, in August 2024, the total market value of gold was approximately $16.8 trillion, while the total market value of Bitcoin was approximately $1.1 trillion, making the latter only one-sixteenth of the former.
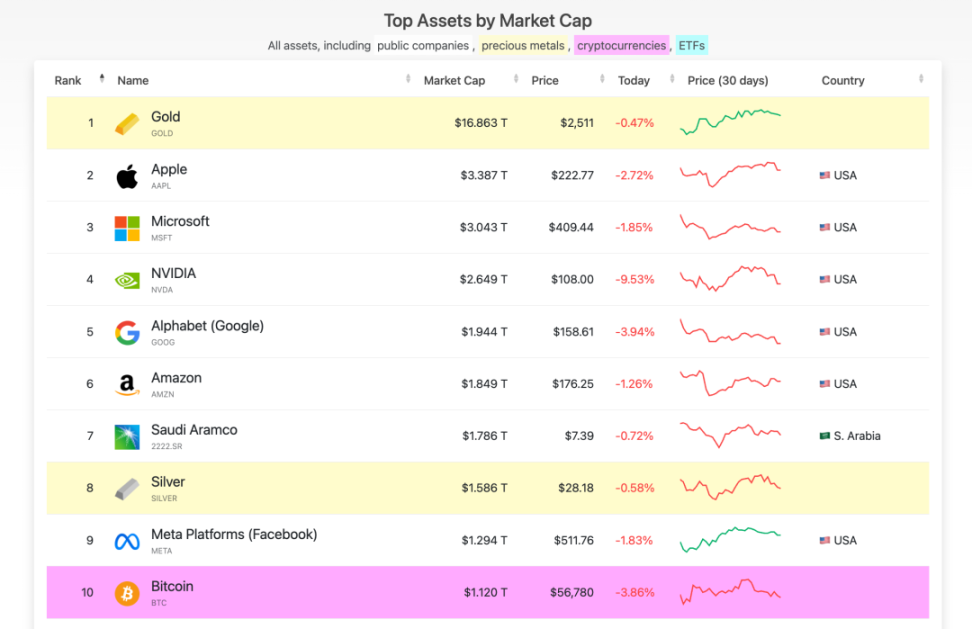
Data source: https://companiesmarketcap.com/assets-by-market-cap/
Therefore, based on the stock-to-flow model calculation, the scarcity of Bitcoin is twice that of gold. If we simply assume that the market value of Bitcoin is also twice that of gold, the result would be $33.6 trillion. In this case, the valuation of Bitcoin would reach an astonishing $1.708 million, which is 30.5 times the current value.
Of course, this calculation lacks a certain basis, as scarcity cannot be quantified. Therefore, we can also refer to the "Real-time Bitcoin Stock-to-Flow Ratio Chart," which provides a more detailed calculation of the valuation of Bitcoin. In the chart below, the yellow line represents the price of Bitcoin calculated by the model, while the colored line represents the actual price of Bitcoin in the market. It is important to note that since 2022, this indicator has shown a deviation, with the model's predicted price consistently higher than the actual price of Bitcoin, for reference only.
According to the "Real-time Bitcoin Stock-to-Flow Ratio Chart," the current valuation of Bitcoin should be $210,000.
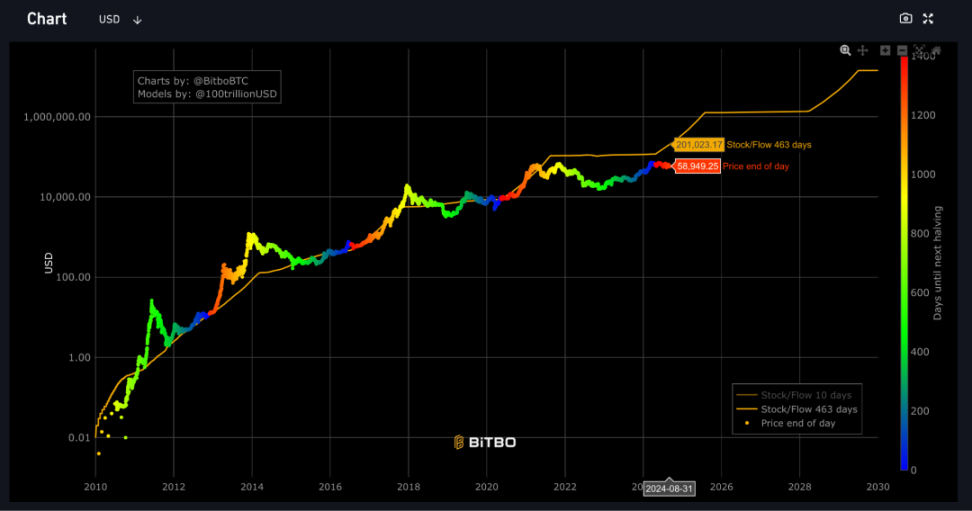
Data source: https://charts.bitbo.io/stock-to-flow/
03 Metcalfe's Law
Metcalfe's Law is mainly used to evaluate the value of communication networks but is also applicable to blockchain technology (such as Bitcoin).
According to this theory, the more users a network or technology has, the greater its attractiveness and value, and the value of the network is directly proportional to the square of the number of users. For example, if a network has 10 users, the value of the network is directly proportional to the square of the number of users, i.e., 10 * 10 = 100. If the number of users increases to 20, the value of the network will increase to 20 * 20 = 400. This indicates that the value of the network grows exponentially with the addition of each new user, rather than linearly.
As of September 4, 2024, the number of Bitcoin addresses has doubled from approximately 26 million to 54 million over the past 5 years, an increase of about 2.076 times. According to Metcalfe's Law, the square of the growth in the number of Bitcoin holders is directly proportional to the change in market value, so the market value of Bitcoin should be 4.3 times that of 5 years ago, and now one Bitcoin is roughly valued at $41,000.
04 AHR999 Hoarding Indicator
This indicator implies the return on short-term dollar-cost averaging of Bitcoin and the deviation of Bitcoin price from the expected valuation.
- When the ahr999 index is 0.45, it's a good time to buy the dip;
- When the ahr999 is between 0.45 and 1.2, it is suitable for dollar-cost averaging;
- When ahr999 is >1.2, it means the coin price is relatively high and not suitable for trading.
In the long term, Bitcoin price shows a certain positive correlation with block height, and with the advantage of dollar-cost averaging, users can control the short-term dollar-cost averaging cost, keeping it mostly below the Bitcoin price.
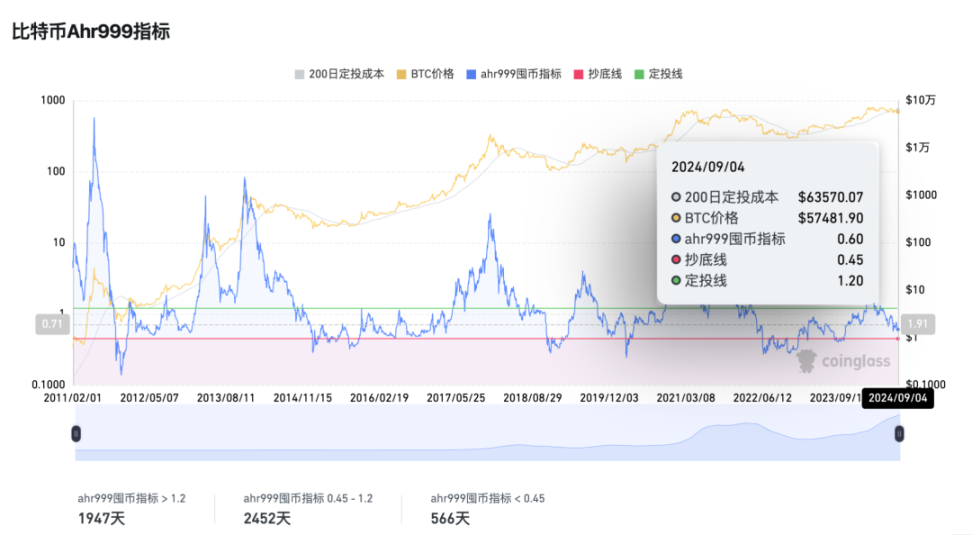
The ahr999 index = (Bitcoin price / 200-day dollar-cost averaging cost) * (Bitcoin price / index growth valuation)
Calculating based on the Bitcoin price of $57,481.9 on September 4th:
0.6 = (57,481.9 / 63,570.07) * (57,481.9 / index growth valuation)
It follows that the BTC index growth valuation is $86,628.
Although this index growth valuation changes daily, it currently indicates that Bitcoin is almost above $80,000.
05 Conclusion
These valuation methods have their own characteristics and help us have a more comprehensive understanding of the value of Bitcoin. However, the ultimate price change of Bitcoin still needs time to observe and verify, so it should be used cautiously as an investment basis.
免责声明:本文章仅代表作者个人观点,不代表本平台的立场和观点。本文章仅供信息分享,不构成对任何人的任何投资建议。用户与作者之间的任何争议,与本平台无关。如网页中刊载的文章或图片涉及侵权,请提供相关的权利证明和身份证明发送邮件到support@aicoin.com,本平台相关工作人员将会进行核查。


