August shock callback, wait and see for new market trends
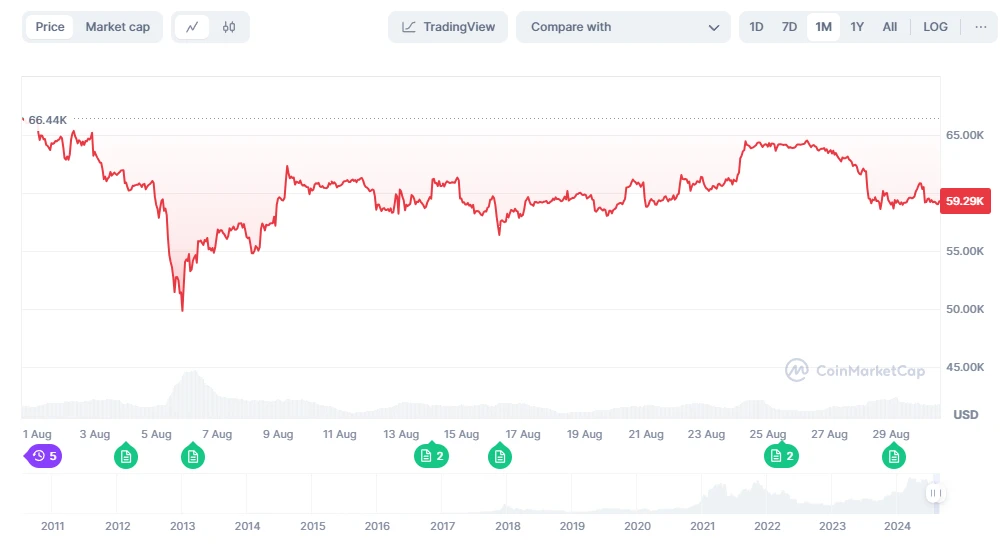
Data Source: coinmarketcap
After the release of non-farm data in early August, the mainstream coin market experienced a sharp price drop. Subsequently, the market has repeatedly shown a trend of rising and falling, with implied volatility gradually decreasing from its peak on August 5th, presenting an overall market situation of wide-ranging shock. The current market urgently needs guidance from a new round of economic data to drive the development of the next phase of the market.
The market generally expects the Federal Reserve to announce a rate cut at the meeting on September 19. However, the new non-farm employment data to be released on September 6 will be crucial. If the data shows strong performance, it will significantly reduce the probability of the Federal Reserve cutting interest rates in mid-September. In addition, the PPI and CPI data to be released on September 11 and September 12 will also be closely watched. If these inflation indicators do not show a significant decrease, it will also reduce the likelihood of a rate cut by the Federal Reserve. Therefore, investors need to closely monitor the upcoming economic data to judge the future market trends.
There are about 19 days until the next Federal Reserve interest rate meeting (2024.09.19)
https://hk.investing.com/economic-calendar/interest-rate-decision-168
Market Technical and Sentiment Analysis
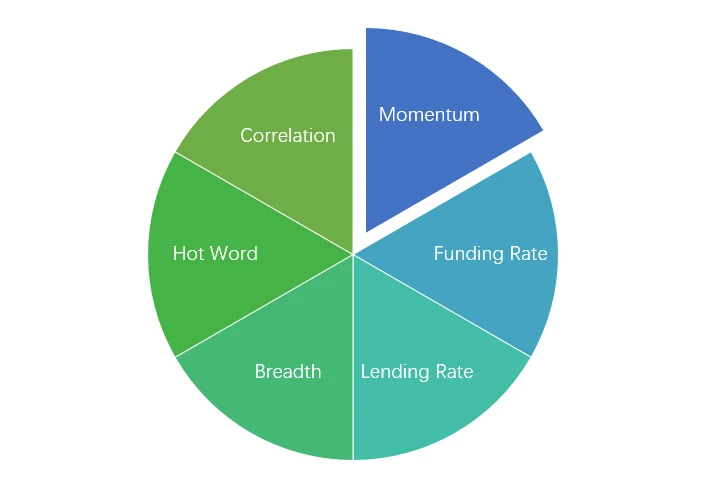
Sentiment Analysis Composition

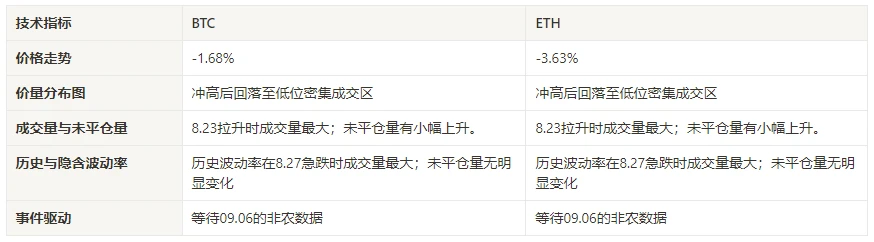
Technical Indicators
Price Trend
In the past week, BTC prices fell by -1.68%, and ETH prices fell by -3.63%.
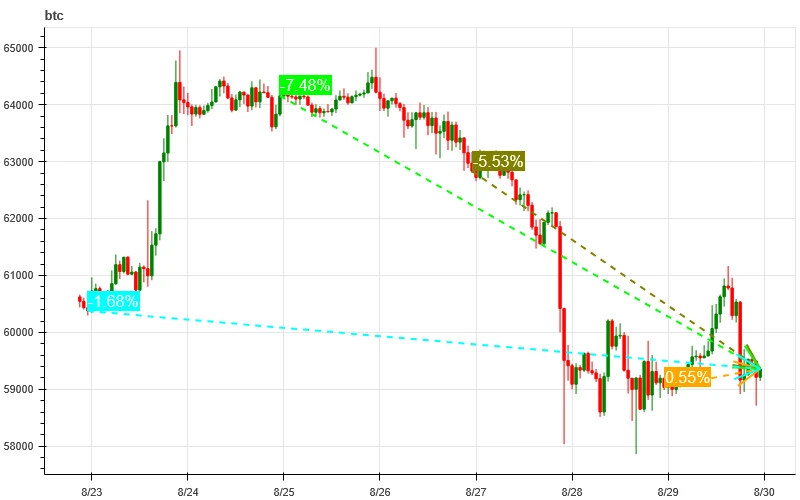
The above chart shows the price trend of BTC in the past week.
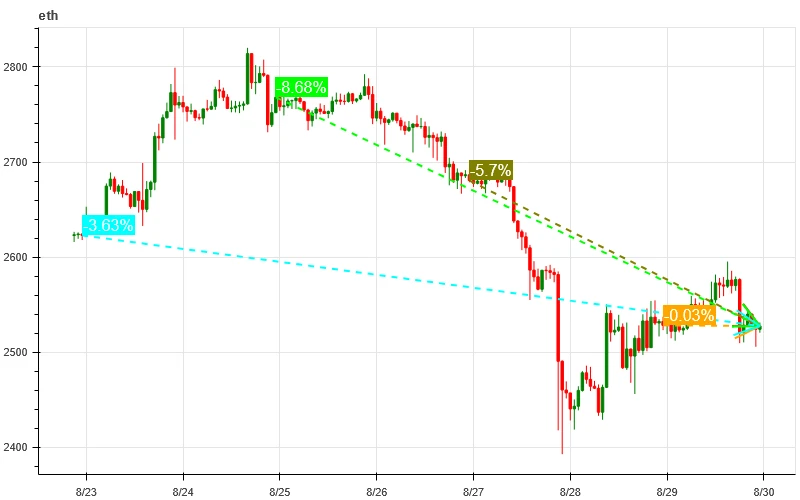
The above chart shows the price trend of ETH in the past week.
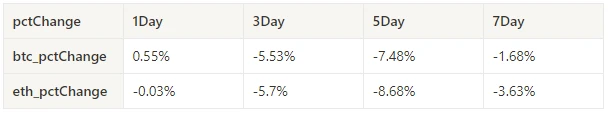
The table shows the price change rate over the past week.
pctChange1Day3Day5Day7Daybtc_pctChange0.55%-5.53%-7.48%-1.68%eth_pctChange-0.03%-5.7%-8.68%-3.63%
Price-Volume Distribution Chart (Support and Resistance)
In the past week, both BTC and ETH surged and then fell back to the densely traded area.
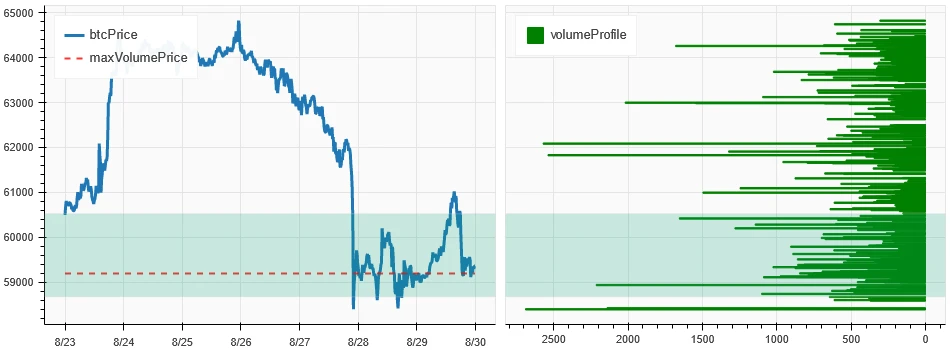
The above chart shows the distribution of densely traded areas for BTC in the past week.
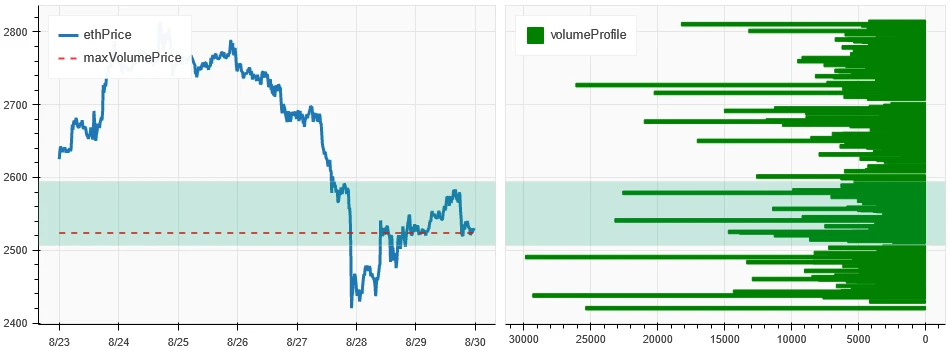
The above chart shows the distribution of densely traded areas for ETH in the past week.
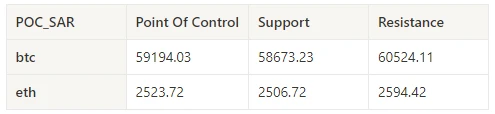
The table shows the densely traded areas for BTC and ETH in each week of the past week.
Trading Volume and Open Interest
In the past week, both BTC and ETH had the largest trading volume during the sharp drop on August 27; the open interest for BTC and ETH did not show significant changes.
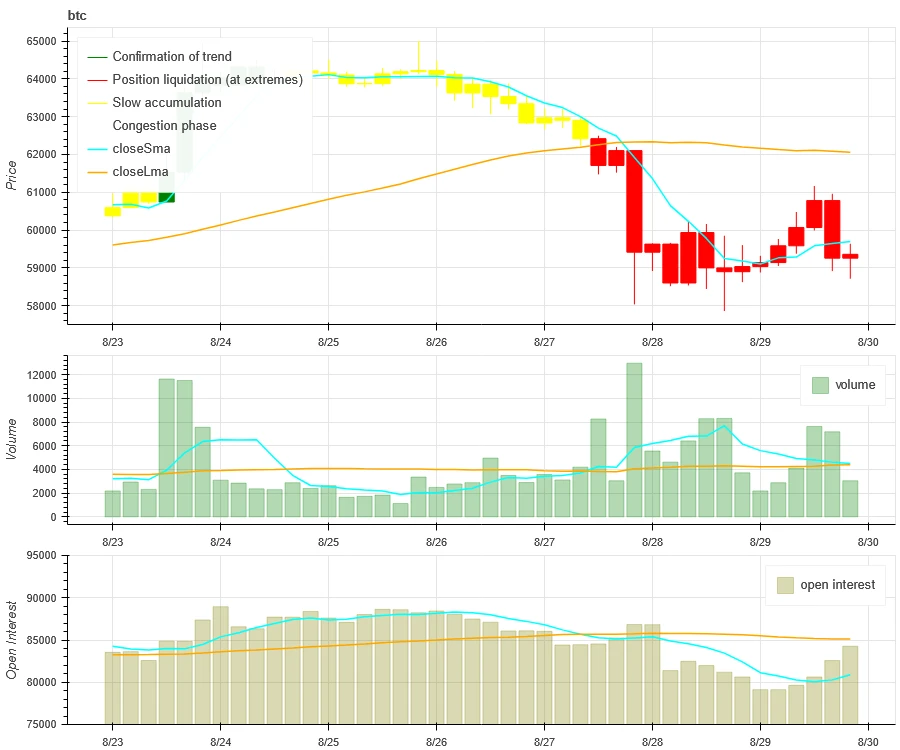
The top chart shows the price trend of BTC, the middle chart shows the trading volume, and the bottom chart shows the open interest. The light blue line represents the 1-day average, and the orange line represents the 7-day average. The color of the candlestick represents the current state: green indicates price increase with trading volume support, red indicates liquidation, yellow indicates slow accumulation of positions, and black indicates crowded state.
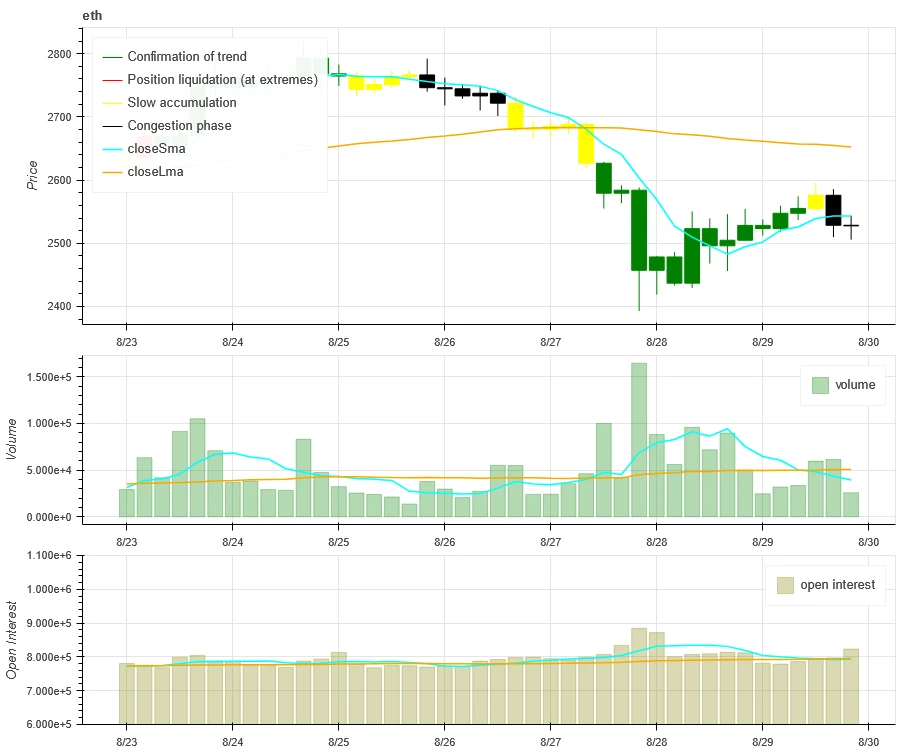
The top chart shows the price trend of ETH, the middle chart shows the trading volume, and the bottom chart shows the open interest. The light blue line represents the 1-day average, and the orange line represents the 7-day average. The color of the candlestick represents the current state: green indicates price increase with trading volume support, red indicates liquidation, yellow indicates slow accumulation of positions, and black indicates crowded state.
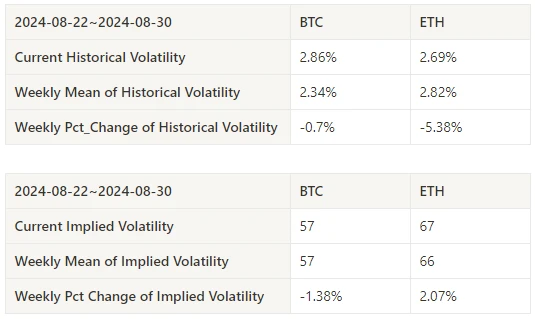
Historical Volatility and Implied Volatility
In the past week, the historical volatility of BTC and ETH was highest when it fell on August 27; the implied volatility of BTC decreased while that of ETH increased.
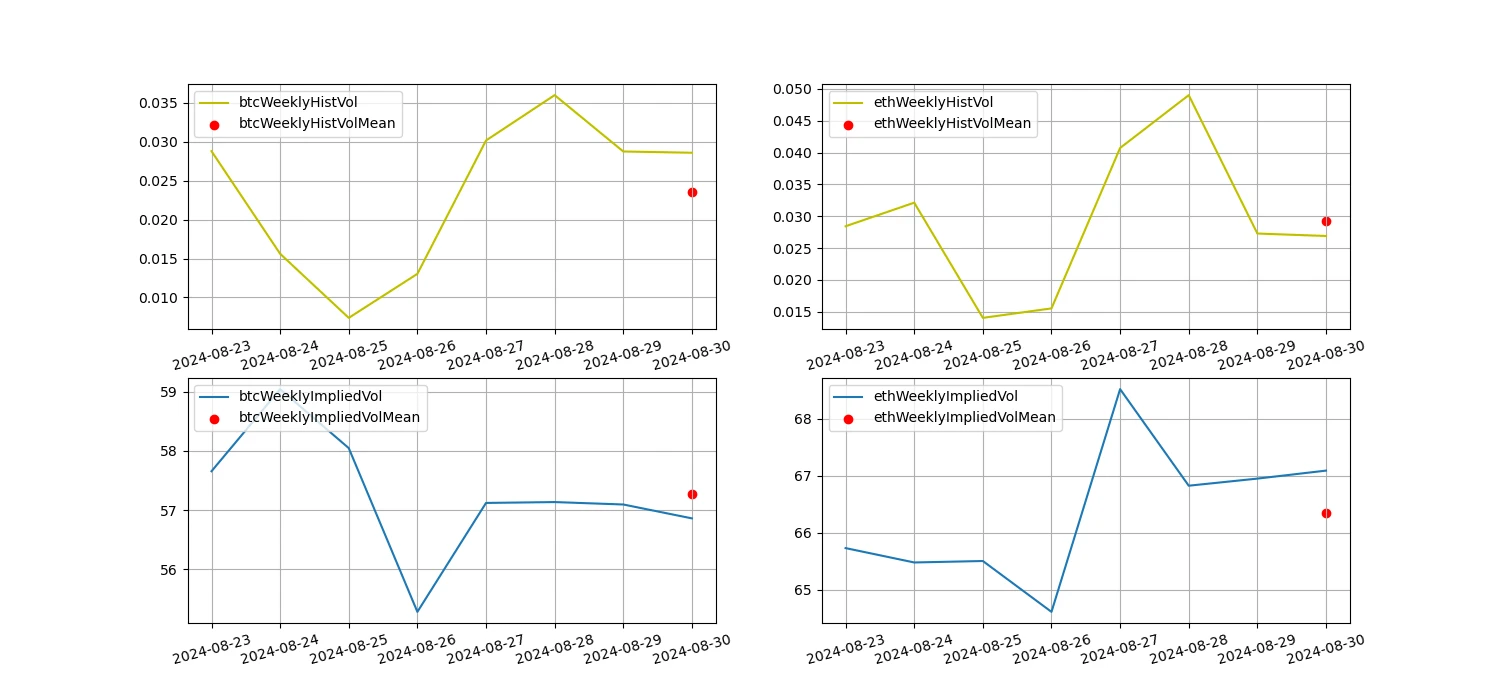
The yellow line represents historical volatility, the blue line represents implied volatility, and the red dots are the 7-day average.
Event-Driven
No major data was released in the past week, waiting for the non-farm data to be released on 09.06.
Sentiment Indicators
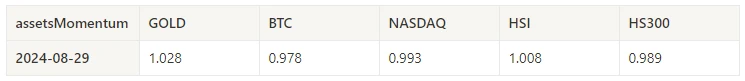
Momentum Sentiment
In the past week, among Bitcoin/Gold/Nasdaq/Hang Seng/Shanghai-Shenzhen 300, gold was the strongest performer, while Bitcoin performed the worst.
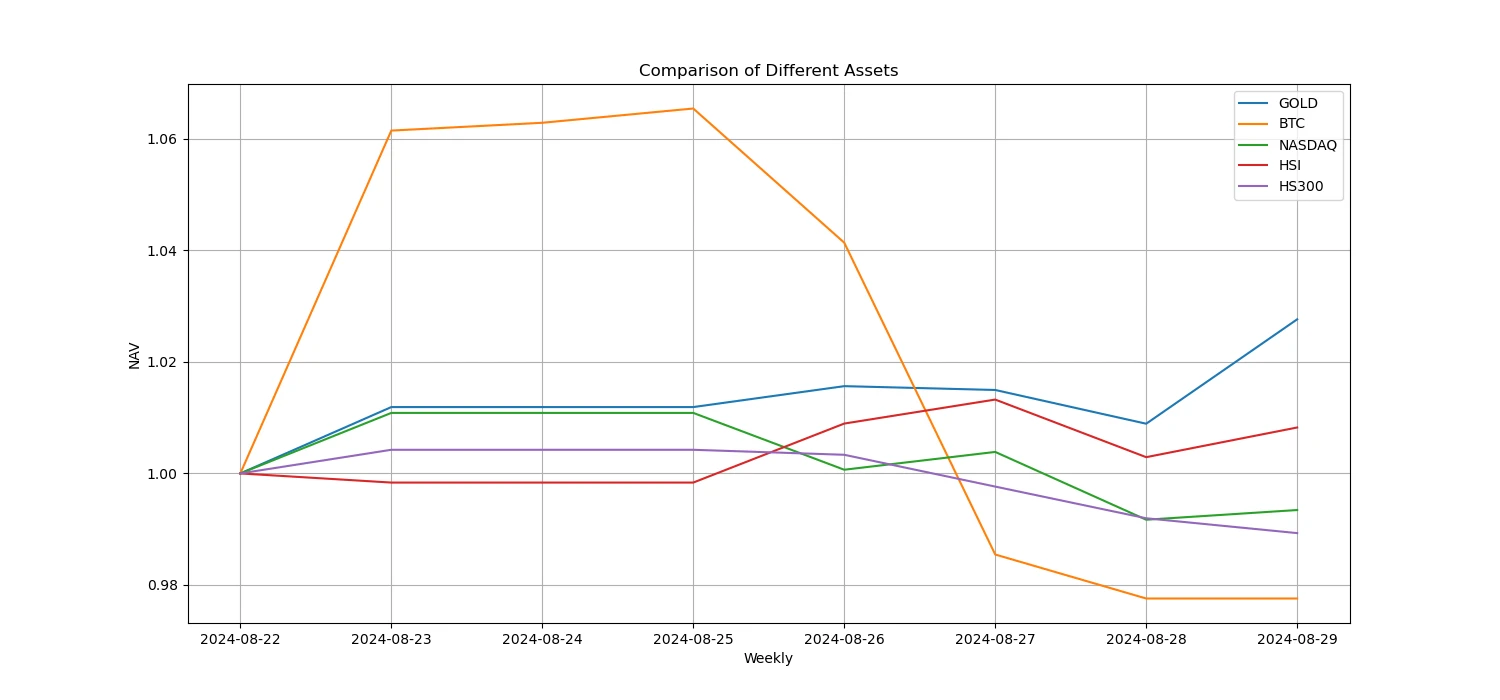
The above chart shows the performance of different assets in the past week.
Lending Rate and Borrowing Sentiment
In the past week, the average annualized USD lending yield was 9.9%, and short-term rates rose to 12%.
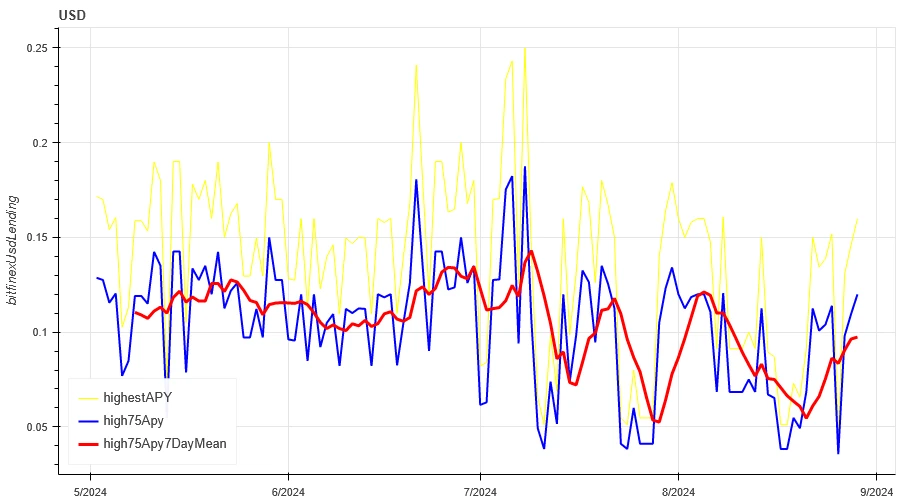
The yellow line represents the highest price of USD interest rates, the blue line represents 75% of the highest price, and the red line represents the 7-day average of 75% of the highest price.
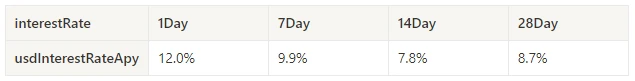
The table shows the average yield of USD interest rates for different holding days in the past.
Funding Rate and Contract Leverage Sentiment
In the past week, the average annualized yield of BTC funding was 0.3%, and the sentiment for contract leverage remained low.
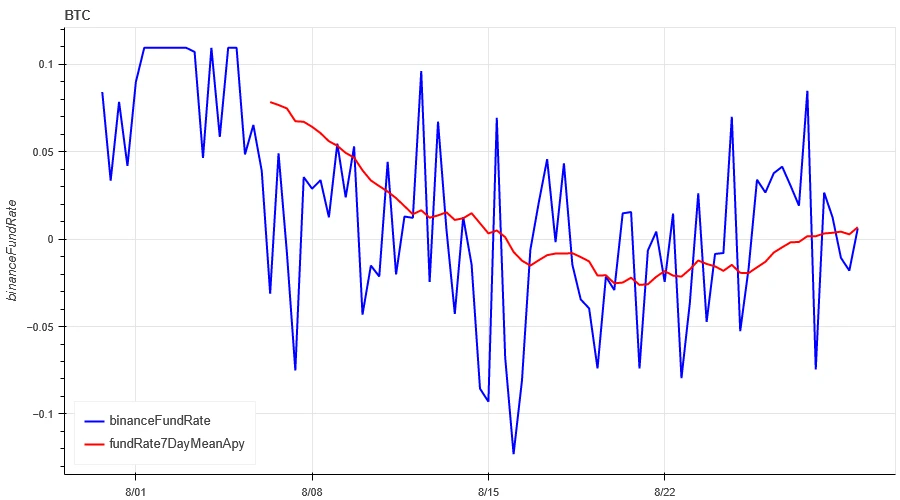
The blue line represents the funding rate of BTC on Binance, and the red line represents its 7-day average.
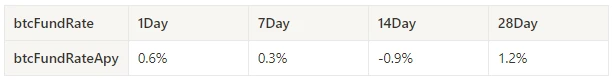
The table shows the average yield of BTC funding for different holding days in the past.
Market Correlation and Consistency Sentiment
In the past week, the correlation among the selected 129 coins was around 0.8, indicating high consistency among different varieties.
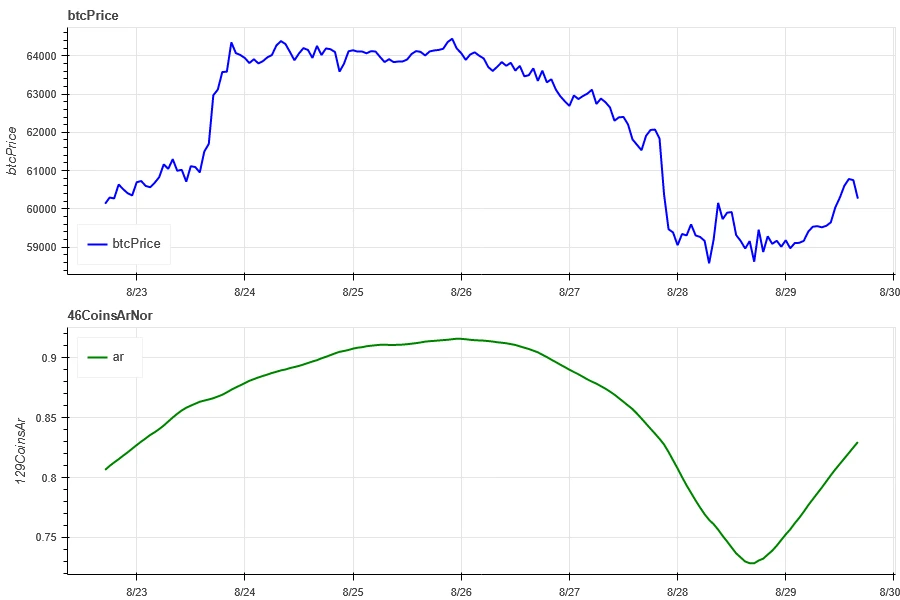
The above chart shows the overall correlation among different varieties with Bitcoin price in blue.
Market Breadth and Overall Sentiment
In the past week, among the selected 129 coins, 41% were above the 30-day moving average, relative to 48% for Bitcoin, 18% were more than 20% away from the 30-day low, and 10% were less than 10% away from the 30-day high. The market breadth indicator in the past week shows that most coins in the overall market have returned to a downward trend.
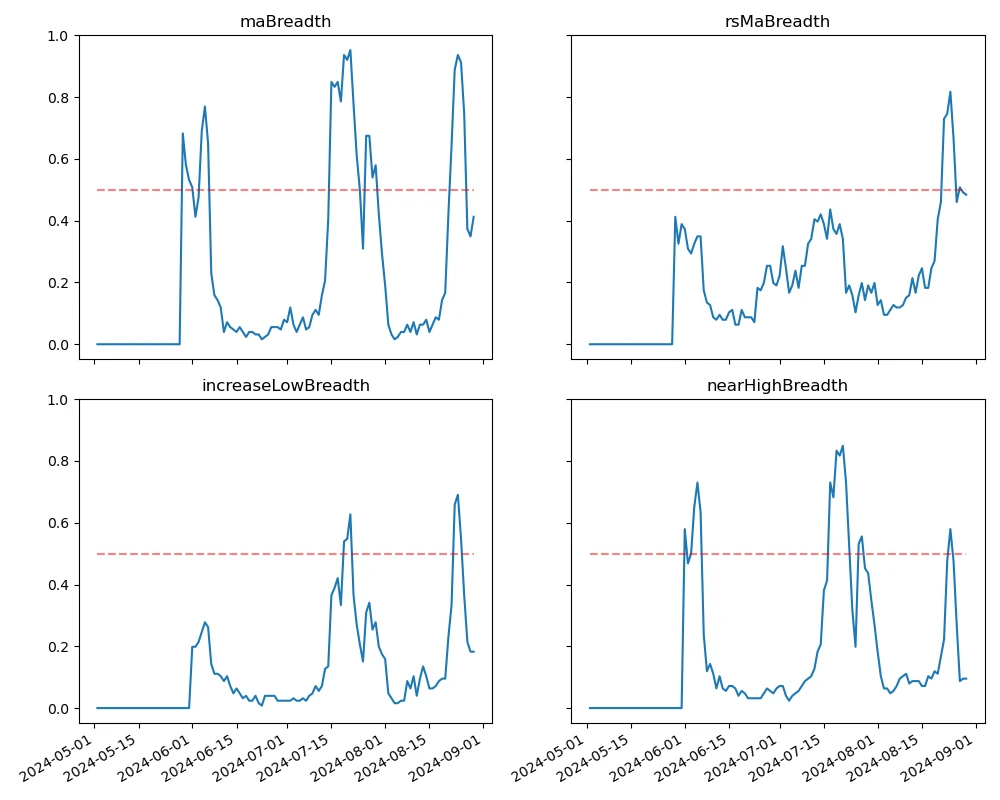
The above chart shows the 30-day width index distribution of the following assets: ['bnb', 'btc', 'sol', 'eth', '1000floki', '1000lunc', '1000pepe', '1000sats', '1000shib', '1000xec', '1inch', 'aave', 'ada', 'agix', 'ai', 'algo', 'alt', 'ankr', 'ape', 'apt', 'arb', 'ar', 'astr', 'atom', 'avax', 'axs', 'bal', 'band', 'bat', 'bch', 'bigtime', 'blur', 'cake', 'celo', 'cfx', 'chz', 'ckb', 'comp', 'crv', 'cvx', 'cyber', 'dash', 'doge', 'dot', 'dydx', 'egld', 'enj', 'ens', 'eos','etc', 'fet', 'fil', 'flow', 'ftm', 'fxs', 'gala', 'gmt', 'gmx', 'grt', 'hbar', 'hot', 'icp', 'icx', 'idu', 'imx', 'inj', 'iost', 'iotx', 'jasmy', 'jto', 'jup', 'kava', 'klay', 'ksm', 'ldo', 'link', 'loom', 'lpt', 'lqty', 'lrc', 'ltc', 'luna2', 'magic', 'mana', 'manta', 'mask', 'matic', 'meme', 'mina', 'mkr', 'near', 'neo', 'nfp', 'ocean', 'one', 'ont', 'op', 'ordi', 'pendle', 'pyth', 'qnt', 'qtum', 'rndr', 'robin', 'rose', 'rune', 'rvn', 'sand', 'sei', 'sfp', 'skl', 'snx', 'ssv', 'stg', 'storj', 'stx', 'sui', 'sushi', 'sxp', 'theta', 'tia', 'trx', 't', 'uma', 'uni', 'vet', 'waves', 'wif', 'wld', 'woo','xai', 'xem', 'xlm', 'xmr', 'xrp', 'xtz', 'yfi', 'zec', 'zen', 'zil', 'zrx' ].
Summary
In the past week, the prices of Bitcoin (BTC) and Ethereum (ETH) rose and then fell by -1.68% and -3.63% respectively. After a brief rise, their prices fell to densely traded areas at the lows. On August 27th, the prices of both sharply dropped, with the trading volume reaching its peak, while the open interest in contracts did not change significantly. In terms of volatility, historical volatility reached its peak on August 27th during the decline, however, implied volatility showed differentiation: BTC implied volatility decreased, while ETH increased. In the performance comparison of different assets, gold was the strongest among Bitcoin, Nasdaq, Hang Seng, and Shanghai-Shenzhen 300, while Bitcoin's performance was the weakest. The average annualized USD lending yield was 9.9%. The average annualized yield of BTC funding was 0.3%, indicating that the sentiment for contract leverage remained low. The correlation among the selected 129 coins remained around 0.8, indicating high consistency among different varieties. The market breadth indicator showed that most cryptocurrencies in the overall market have returned to a downward trend.
Twitter: @https://x.com/CTA_ChannelCmt
Website: channelcmt.com
免责声明:本文章仅代表作者个人观点,不代表本平台的立场和观点。本文章仅供信息分享,不构成对任何人的任何投资建议。用户与作者之间的任何争议,与本平台无关。如网页中刊载的文章或图片涉及侵权,请提供相关的权利证明和身份证明发送邮件到support@aicoin.com,本平台相关工作人员将会进行核查。


