This article is exclusively analyzed by Baiqi & Guanyuyu, representing the exclusive viewpoints of Baiqi & Guanyuyu. They have in-depth research and practical experience in BTC, ETH, and various altcoins. Due to the timing of the article, the following viewpoints and suggestions are not real-time and are for reference only. Please bear the risks and indicate the source when reposting. Reasonably control your position when trading, and do not over-leverage or go all in. For more cryptocurrencies and spot trading strategies, please follow the official account.
BTC
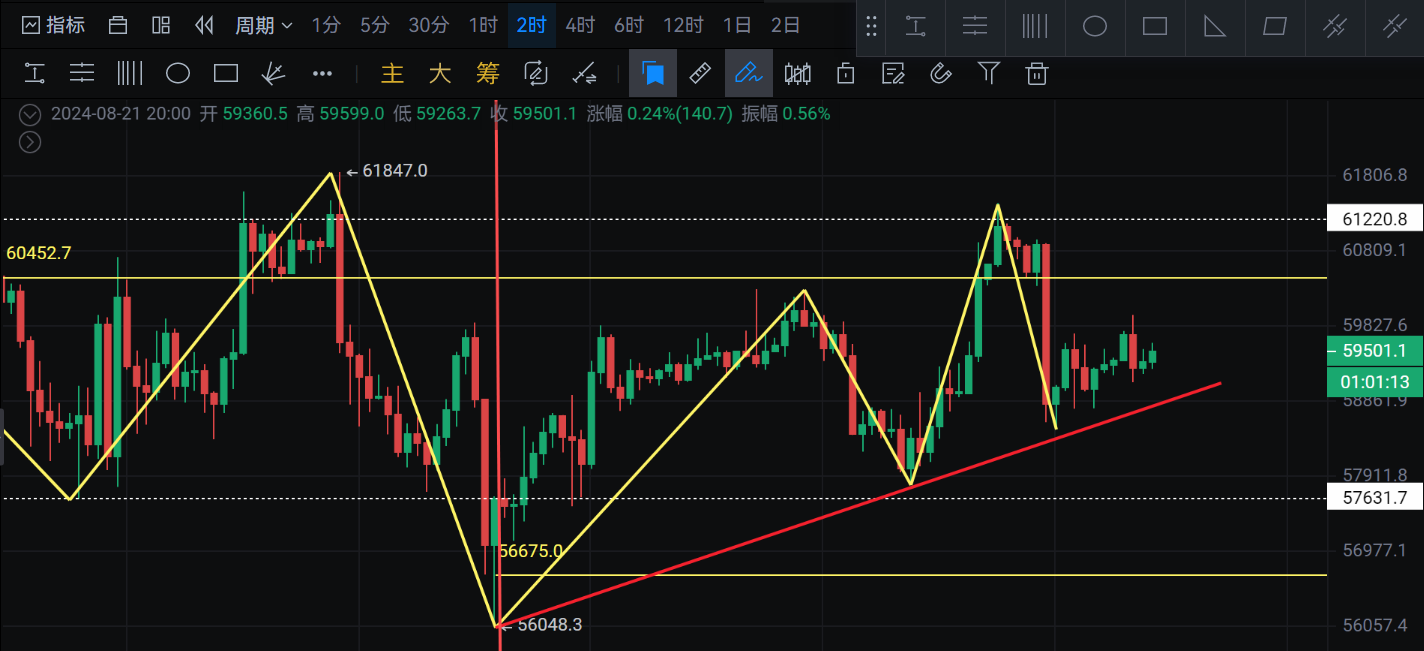
Yesterday's review: Yesterday, the rebound was given after the pullback to the M-top neckline at 57600 without breaking, and the rebound reached the M-top pressure level at 61200 without breaking.
Recent focus: Support at 54200-51800 below, support at 56500, and resistance in the range of 60400-59800 above.
Key focus: Support at 60000 and 58700 below, and resistance at 63700 above. The second test of the previous high in the range of 62500-61800. Extreme needle insertion point at 69800.
Whether the support levels at 60000 and 58700 are effective, go long if the breakthrough of 60000 is not broken on the pullback. Also, pay attention to the possibility of an accelerated downtrend if the 60000 level is breached.
Structural form: W-bottom on the 2-hour chart. Head and shoulders bottom on the 6-hour chart. Support at 58700 and resistance at 61400.
Trading ideas<<<<<<
Long position: Rebound in the range of 56600-56000 without breaking, go long when a bottom pattern signal appears on the 5-minute or 30-minute chart.
Short position: Rebound in the range of 63700-66300 without breaking, go short when a top pattern signal appears on the 5-minute or 30-minute chart.
Short position: Rebound in the range of 61200-60400 without breaking, go short when a top pattern signal appears on the 5-minute or 30-minute chart.
Personal viewpoint:
The upward slope line on the 2-hour chart has not been broken. Pay attention to the possibility of an accelerated downtrend if the slope line is broken tonight or tomorrow during the day, as well as the possibility of an accelerated uptrend on the pullback without breaking.
Currently, from the daily chart perspective, if the previous high from yesterday is not broken, the downtrend will continue. The W-bottom on the 2-hour chart from yesterday did not materialize, and the neckline was not held after the pullback. When monitoring the market, we must pay attention to the break and pullback of the slope line.
Pay attention to position management and avoid heavy positions.
Graphical explanation: The yellow line represents the structure and form, the red line represents the trend slope line, and the white line represents the key support and resistance at the neckline. Go short near the upper range within the range, and go long near the lower range. Lightly add to long positions or short positions if the entity breaks the support or resistance. Set stop-loss at the top and bottom of the breaking candle.
Today, pay attention to the break of the red slope line and the pullback without breaking.
In fast-moving markets, be cautious of both upward and downward swings, and avoid holding positions stubbornly. Exit when the profit reaches the expected level.
ETH
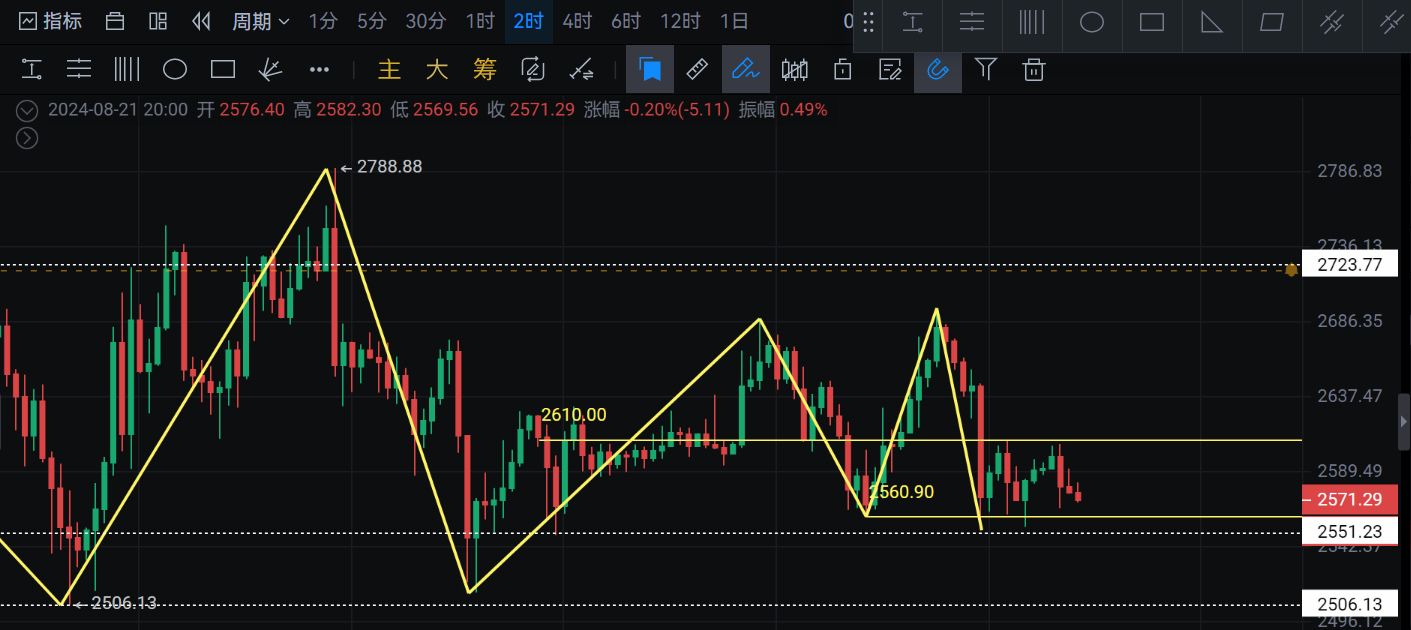
Yesterday's review: Yesterday, the rebound was given after the pullback to the M-top neckline without breaking, and the rebound reached the 2-hour pressure level at 2610 without breaking.
Recent focus: Resistance in the range of 2745-2725 above, extreme needle insertion point at the top in the range of 2880-2920.
Structural form: W-bottom on the 2-hour chart. Head and shoulders bottom on the 6-hour chart. Support at 2620 and resistance at 2720 at the neckline.
Points to note: Support at 2550 and 2510 below, and resistance at 2610 above.
Extreme upward needle at 2970-3000 or 3070-3100. Extreme downward needle at 2410 and 2230.
Trading ideas<<<<<<
Short position: Rebound in the range of 2730-2760 without breaking, go short when a top pattern signal appears on the 5-minute or 30-minute chart.
Short position: Rebound in the range of 2610-2630 without breaking, go short when a top pattern signal appears on the 5-minute or 30-minute chart.
Long position: Rebound in the range of 2340-2310 without breaking, go long when a bottom pattern signal appears on the 5-minute or 30-minute chart.
Long position: Rebound in the range of 2510-2480 without breaking, go long when a bottom pattern signal appears on the 5-minute or 30-minute chart.
Personal viewpoint:
The W-bottom on the 2-hour chart from yesterday did not materialize. Currently, there have been two double needle probes on the 2-hour chart, so everyone must pay attention to the possibility of an accelerated uptrend.
As mentioned in yesterday's article, do not consider going short if the 2550 level is not broken. Pay attention to the closing price of the 0:00 candle today. If it closes below 2678, you can continue to consider going short. If the price closes above 2678, there is still a possibility of an uptrend.
The daily chart and weekly K-line levels do not have enough shadow lines, indicating a bearish view. In combination with the above, after the price reaches the neckline, reduce short positions or exit for observation, and start to layout long positions. If the entity breaks the previous high on the daily chart, pay attention to the three-wave accelerated uptrend on the daily chart. The target price is at 3120.
Pay attention to position management and avoid heavy positions.
Graphical explanation: The yellow line represents the structure and form, the breaking of the large trend slope. The white line represents the key support and resistance at the neckline. Go short near the upper range within the range, and go long near the lower range. Lightly add to long positions or short positions if the entity breaks the support or resistance. Set stop-loss at the top and bottom of the breaking candle.
Fun fact of the day:
If the fluctuation of the candlestick can bring you wealth, then please patiently wait for the candlestick that can bring you wealth. Once it appears, cherish it - and firmly grasp it.
The analysis strategy is time-sensitive, please refer to real-time guidance on the official account!
[Friendly reminder]: The above content is original from Baiqi & Guanyuyu. The advertisements at the end of the article and in the comments section are not related to Baiqi & Guanyuyu. Please discern carefully, and thank you for your appreciation. Welcome all investors to follow the official WeChat account of Baiqi & Guanyuyu to learn more about real-time market analysis.

免责声明:本文章仅代表作者个人观点,不代表本平台的立场和观点。本文章仅供信息分享,不构成对任何人的任何投资建议。用户与作者之间的任何争议,与本平台无关。如网页中刊载的文章或图片涉及侵权,请提供相关的权利证明和身份证明发送邮件到support@aicoin.com,本平台相关工作人员将会进行核查。


