This article is exclusively analyzed by [WeChat Official Account: Day Trading Professional] and represents the exclusive views of [WeChat Official Account: Day Trading Professional].
For friends who want to verify their strength, follow the WeChat Official Account at the end of the article to find [Day Trading Professional]. The Moments will have irregular real-time strategy suggestions every day. The strategies here at [Day Trading Professional] only provide precise points, without ambiguous ranges or nearby levels. Friends who like [Day Trading Professional] can click to follow. Let's see today's sharing!
Important notice: In the future, daytime trading strategies will be released every day from 8 AM to 9 AM, and nighttime trading strategies from 8 PM to 9 PM. There will be two publications daily, hoping to provide references for everyone during day trading. Due to limited fluctuations in day trading, the price range may be a bit smaller, so please pay attention to monitoring operations. For more cryptocurrencies and real-time spot strategies, please follow the WeChat Official Account to receive them.
BTC
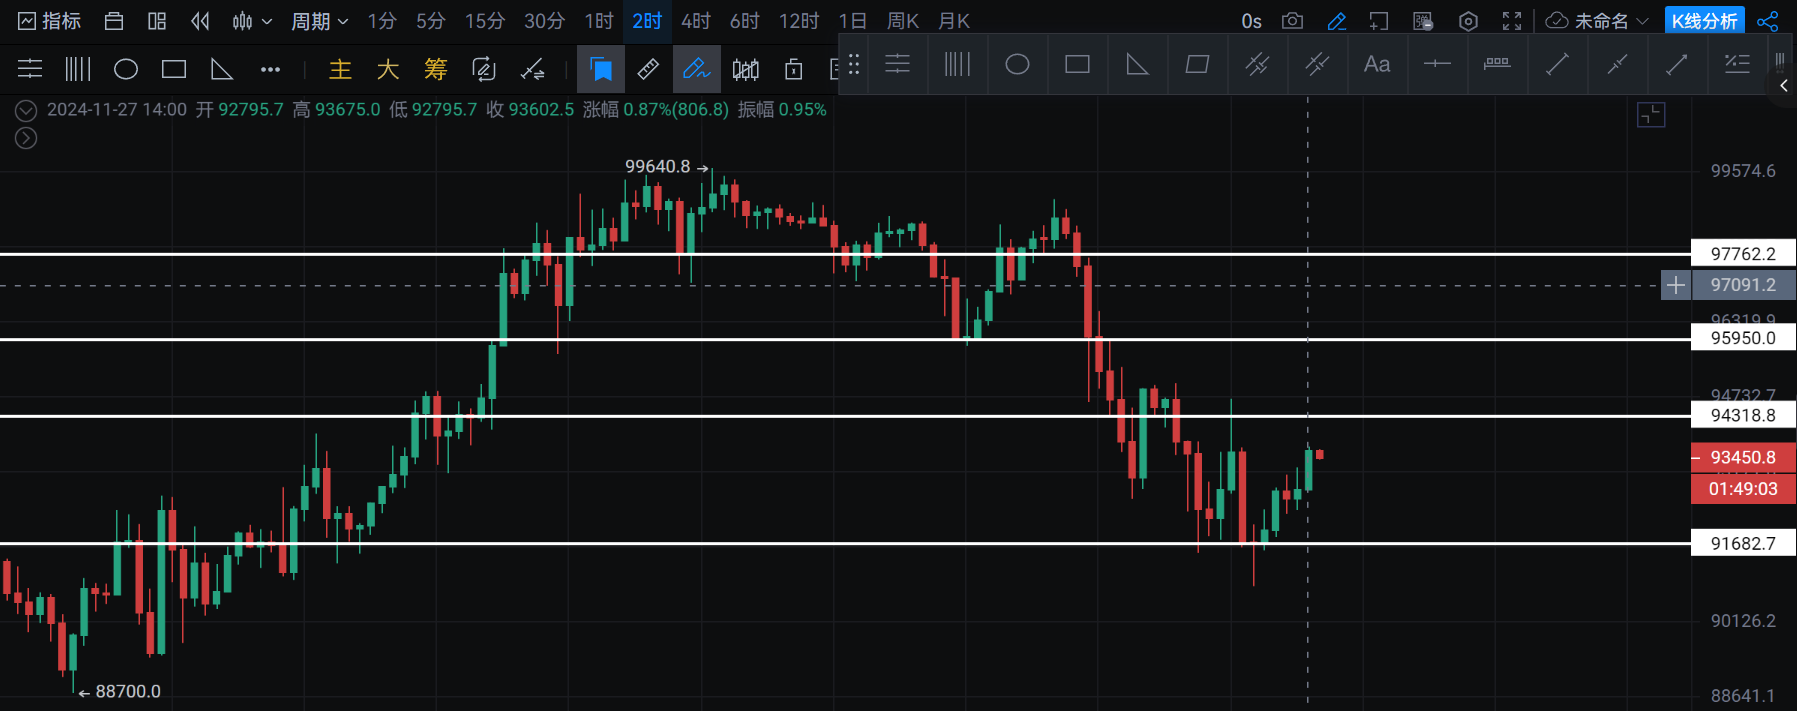
12-hour market review: After the line change in the early morning, it surged to 94,700 before falling back, hitting a new low of 90,800 and then rebounding to the current 93,600.
Recent focus: Resistance in the range of 94,300--96,000, support in the range of 91,000--90,000. Pay attention to acceleration if the range breaks.
Structural pattern: 2-hour PB signal, neck line resistance in the range of 94,300--95,000.
Trading ideas<<<<<<
Long position: If the entity does not break below the 90,000--91,000 range during the pullback, go long when a bottom pattern signal appears on the 5-minute or 30-minute chart.
Long position: If the entity does not break below the 86,300--88,000 range during the pullback, go long when a bottom pattern signal appears on the 5-minute or 30-minute chart.
Short position: If the entity does not break above the 94,300--95,000 range during the rebound, go short when a top pattern signal appears on the 5-minute or 30-minute chart.
Short position: If the entity does not break above the 97,700--99,900 range during the rebound, go short when a top pattern signal appears on the 5-minute or 30-minute chart.
Personal opinion:
I am currently bearish on BTC, and the high reference point is the historical high of 99,600. If it does not break 99,600, I will continue to open short positions on rebounds. Additionally, I will lay out long-term short positions until a PB signal appears on the daily chart level.
For long position strategies, the recent low of 90,800 during this pullback is a good reference. I believe there is no problem laying out long positions around the 90,000--90,800 range with a stop loss set at 90,000.
Of course, for all positions, whether long or short, at least a K-line signal must be seen on the 5-minute or 30-minute chart before opening a position. Do not open a position without a signal.
For real-time strategy orders, please follow the WeChat Official Account to receive them.
Everyone should pay attention to position management and be cautious with heavy positions.
Graphical explanation: The yellow line represents the structure and pattern lines, the red line represents the slope line of the wave segment, and the white line represents the support and resistance of the key neck line. Short positions should be made near the upper side of the range, and long positions should be made near the lower side of the range. If the entity breaks support and resistance, light positions can be used to chase shorts or longs. Set stop losses at the tops and bottoms of the breaking K-lines.
ETH
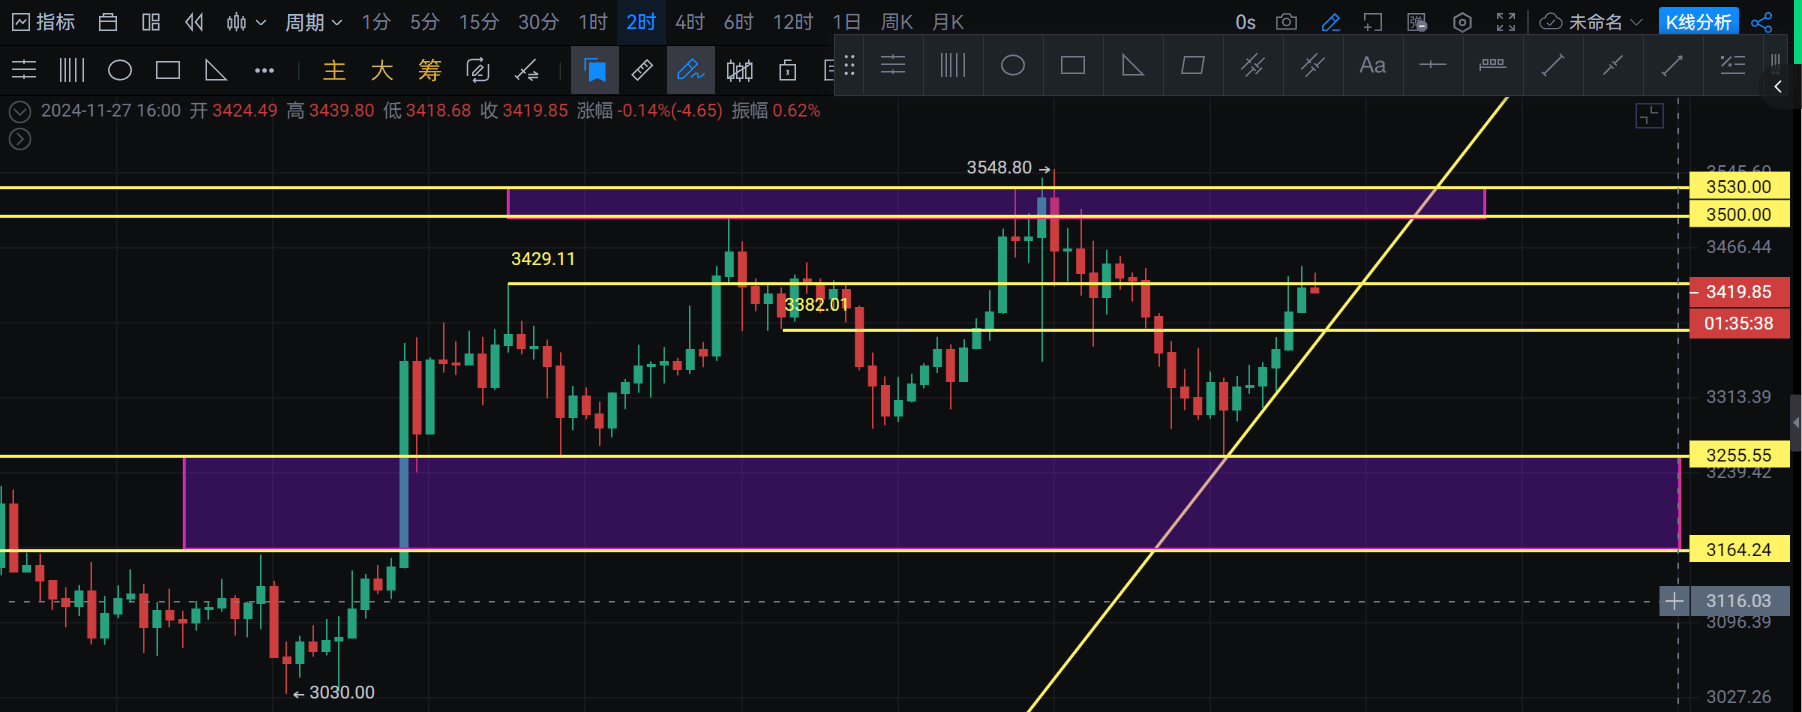
12-hour market review: After the line change in the early morning, it surged to 3,430 in a one-sided manner.
Recent focus: Resistance in the range of 3,500--3,530, support in the range of 3,255--3,160. Pay attention to acceleration downwards after breaking. Extreme low point: 3,060.
Structural pattern: 2-hour level PB signal, pay attention to the continued downward trend if the rebound does not break the previous high.
Trading ideas<<<<<<
Short position: If the entity does not break above 3,450--3,430 during the rebound, go short when a top pattern signal appears on the 5-minute or 30-minute chart.
Short position: If the entity does not break above 3,550--3,530 during the rebound, go short when a top pattern signal appears on the 5-minute or 30-minute chart.
Long position: If the entity does not break below the 3,280--3,250 range during the pullback, go long when a bottom pattern signal appears on the 5-minute or 30-minute chart.
Long position: If the entity does not break below the 3,050--3,100 range during the pullback, go long when a bottom pattern signal appears on the 5-minute or 30-minute chart.
Personal opinion:
I am also currently bearish on ETH. After this wave of increase, I have been opening short positions on BTC and ETH.
There are two reasons:
First: This rapid increase has no technical pullback.
Second: To prevent the occurrence of black swan events this year.
If this rebound does not break the high point of 3,550, I will continue to lay out short positions until a stop and reversal signal appears at the daily chart level.
For real-time strategy orders, please follow the WeChat Official Account to receive them.
Everyone should pay attention to position management and be cautious with heavy positions.
Graphical explanation: The yellow line represents the structure and pattern lines, the breaking of the slope of the large wave segment. The white line represents the support and resistance of the key neck line. Short positions should be made near the upper side of the range, and long positions should be made near the lower side of the range. If the entity breaks support and resistance, light positions can be used to chase shorts or longs. Set stop losses at the tops and bottoms of the breaking K-lines.
A cold knowledge a day:
How to lightly lay out long positions, divide the total position you want to enter into 2-4 entries. After entering, do not sell casually; for long positions, do not exit unless there are double K or triple K reversal signals at the daily chart level. (Lightly laying out positions should not be too heavy, otherwise, it cannot withstand the fluctuations of pin bars.)

Analysis strategies are time-sensitive; please refer to the real-time guidance of [WeChat Official Account: Day Trading Professional]!
[Warm reminder]: The above content is original by [Day Trading Professional]. The advertisements at the end of the article and in the comments section are not related to [Day Trading Professional]. Please be cautious in distinguishing them. Thank you for your appreciation.
The author has been engaged in financial market investment research for many years and currently mainly analyzes and guides stock, futures, and cryptocurrency contract/spot operations. If you want to know more about real-time guidance, position recovery consultation, and learning market observation skills, all investors are welcome to follow [Day Trading Professional]** WeChat Official Account for more real-time market analysis.**
免责声明:本文章仅代表作者个人观点,不代表本平台的立场和观点。本文章仅供信息分享,不构成对任何人的任何投资建议。用户与作者之间的任何争议,与本平台无关。如网页中刊载的文章或图片涉及侵权,请提供相关的权利证明和身份证明发送邮件到support@aicoin.com,本平台相关工作人员将会进行核查。