This article is exclusively analyzed by Baiqi & Guanyuyu, representing the exclusive viewpoints of Baiqi & Guanyuyu. They have in-depth research and practical experience in BTC, ETH, and various altcoins. Due to the timing of the article, the following viewpoints and suggestions are not real-time and are for reference only. Readers bear the risks, and please indicate the source when reposting. Reasonably control the position when trading, and avoid heavy or full positions. For more cryptocurrencies and spot strategies, please follow the official account.
BTC
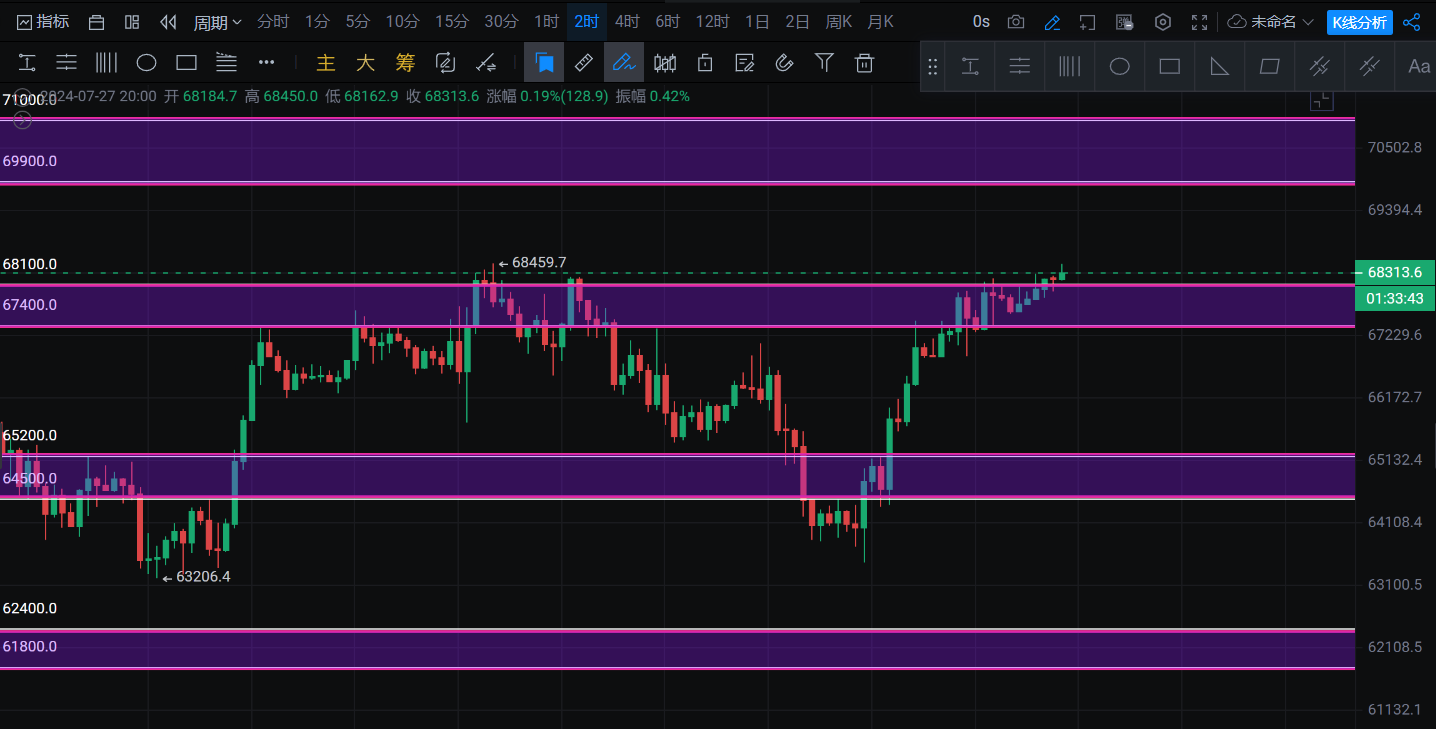
Yesterday's review: After bottoming out on the 2-hour timeframe, it unilaterally rose and then consolidated after the rise.
Recent focus: The upper range is 61700-69900, and the lower range to watch is 65200-64500 for support.
Structural form: Unilateral rise, retesting the previous high.
Points to note: Breaking the previous high will accelerate the uptrend, but also be aware of false breakouts. Not breaking the previous high will accelerate the downtrend.
Trading ideas<<<<<<
Long position: Buy in the 65200-64500 range on a pullback without falling below, and go long when a bottom pattern signal appears on the 5-minute or 30-minute chart.
Long position: Buy in the 62400-61800 range on a pullback without falling below, and go long when a bottom pattern signal appears on the 5-minute or 30-minute chart.
Short position: Sell in the 69900-71000 range on a rebound without breaking through, and go short when a top pattern signal appears on the 5-minute or 30-minute chart.
Key focus: Resistance at 69900-71000 and support at 64500-65200.
Personal viewpoint:
Currently, BTC has unilaterally risen on the 2-hour timeframe, with a decline followed by a rise on the weekly timeframe. The daily chart formed a large bullish candlestick yesterday and provided a clear high-low pattern.
Objectively, based on the candlestick signals, BTC is in an uptrend and should be bought on pullbacks. Respect the market signals.
Subjectively, if the previous high of 68450 and the historical high of 73880 are not broken, I will mainly take a short position. The reason is that I believe BTC has not fallen enough from a larger timeframe perspective. Of course, this is a subjective judgment, not an objective analysis. I will also use 73880 as the point to exit my position. If the previous high is not broken, I will continue to short. If the previous high is broken and the daily chart forms a bullish candlestick, I will buy on pullbacks. For a long time, we will find it very difficult to see BTC starting with a 5.
It is recommended to strictly control position management and never put all your assets into a single market trend. A successful trader only earns limited profits, so do not try to buy at the lowest, sell at the highest, buy at the highest, and sell at the lowest. Control the greed and fear of human nature.
ETH
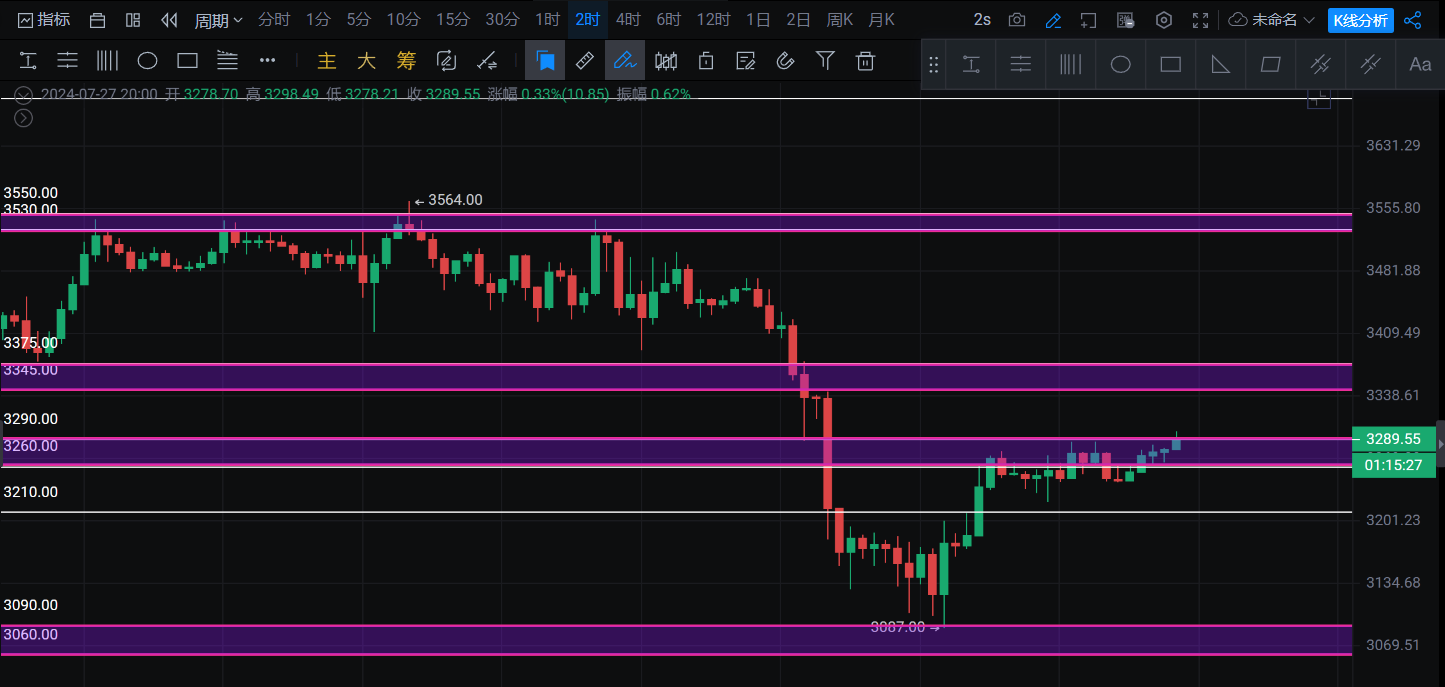
Yesterday's review: Sideways at high levels.
Recent focus: The upper range is 3345-3375, the upper range is 3290-3260, and the lower range is 3090-3060. The recent minor support level is 3210.
Structural form: Sideways at high levels on the 2-hour timeframe.
Points to note: Breakout after sideways at high levels on the 2-hour timeframe, with resistance at the high points of 3345-3375 and support on a pullback to 3210.
Trading ideas<<<<<<
Short position: Sell in the 3260-3290 range on a rebound without breaking through, and go short when a top pattern signal appears on the 5-minute or 30-minute chart.
Short position: Sell in the 3345-3375 range on a rebound without breaking through, and go short when a top pattern signal appears on the 5-minute or 30-minute chart.
Long position: Buy in the 3210-3190 range on a pullback without falling below, and go long when a bottom pattern signal appears on the 5-minute or 30-minute chart.
Long position: Buy in the 3060-3090 range on a pullback without falling below, and go long when a bottom pattern signal appears on the 5-minute or 30-minute chart.
Key focus: Resistance at 3290 and 3375, support at 3090.
Personal viewpoint:
The daily chart confirms a bearish 3+1 signal, currently testing the 3+1 signal on the rebound. Without breaking the previous high, I won't consider going long and will patiently wait for a pullback. Even if it's going to rise next week, I believe it needs to confirm the low point of 3100 on a pullback. If the retest does not break the support at 3100, I will consider holding a long position for the long term.
However, always respect the market and make objective analysis. We must trade based on what we see in the market, not what we imagine.
The analysis and strategies have a time limit, please refer to the real-time guidance on the official account!
[Friendly reminder]: The above content is original from Baiqi & Guanyuyu. The advertisements at the end of the article and in the comments section are not related to Baiqi & Guanyuyu. Please discern carefully, and thank you for your appreciation. Welcome all investors to follow the official WeChat account of Baiqi & Guanyuyu for more real-time market analysis.

免责声明:本文章仅代表作者个人观点,不代表本平台的立场和观点。本文章仅供信息分享,不构成对任何人的任何投资建议。用户与作者之间的任何争议,与本平台无关。如网页中刊载的文章或图片涉及侵权,请提供相关的权利证明和身份证明发送邮件到support@aicoin.com,本平台相关工作人员将会进行核查。


