Only with a calm mind can one achieve great success. Investing is only for making money, everything else is just empty talk. Making money is the only way. Hello everyone, I am Jinrui from the cryptocurrency circle!
There may be a strong upward trend on the daily chart, but it is important to remain calm and observe the market while expecting the market to heat up.
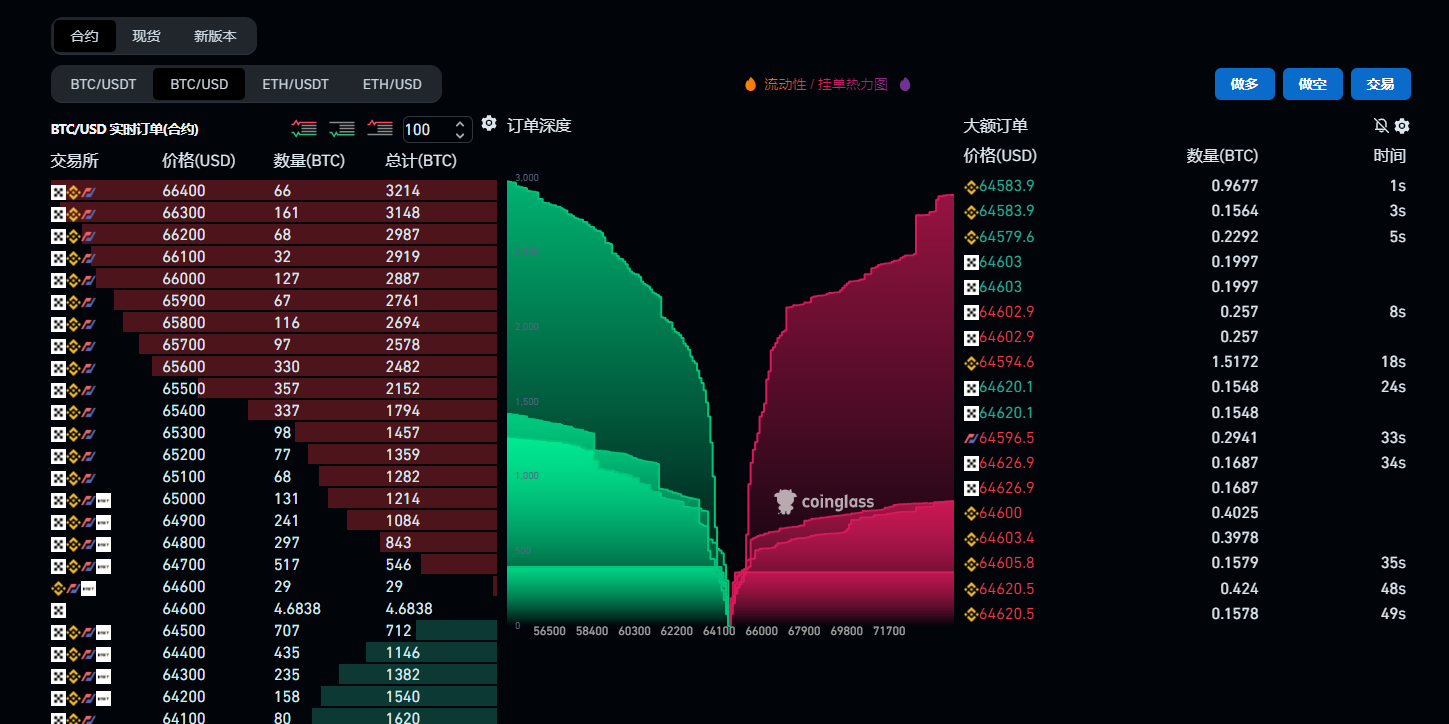
From the heat map, there has been a gradual increase in sell orders starting from the high point of $65,000.
In an upward trend, where should one enter the market? Jinrui will analyze the daily chart, 4-hour chart, and 1-hour chart.
【BTC Daily Chart】
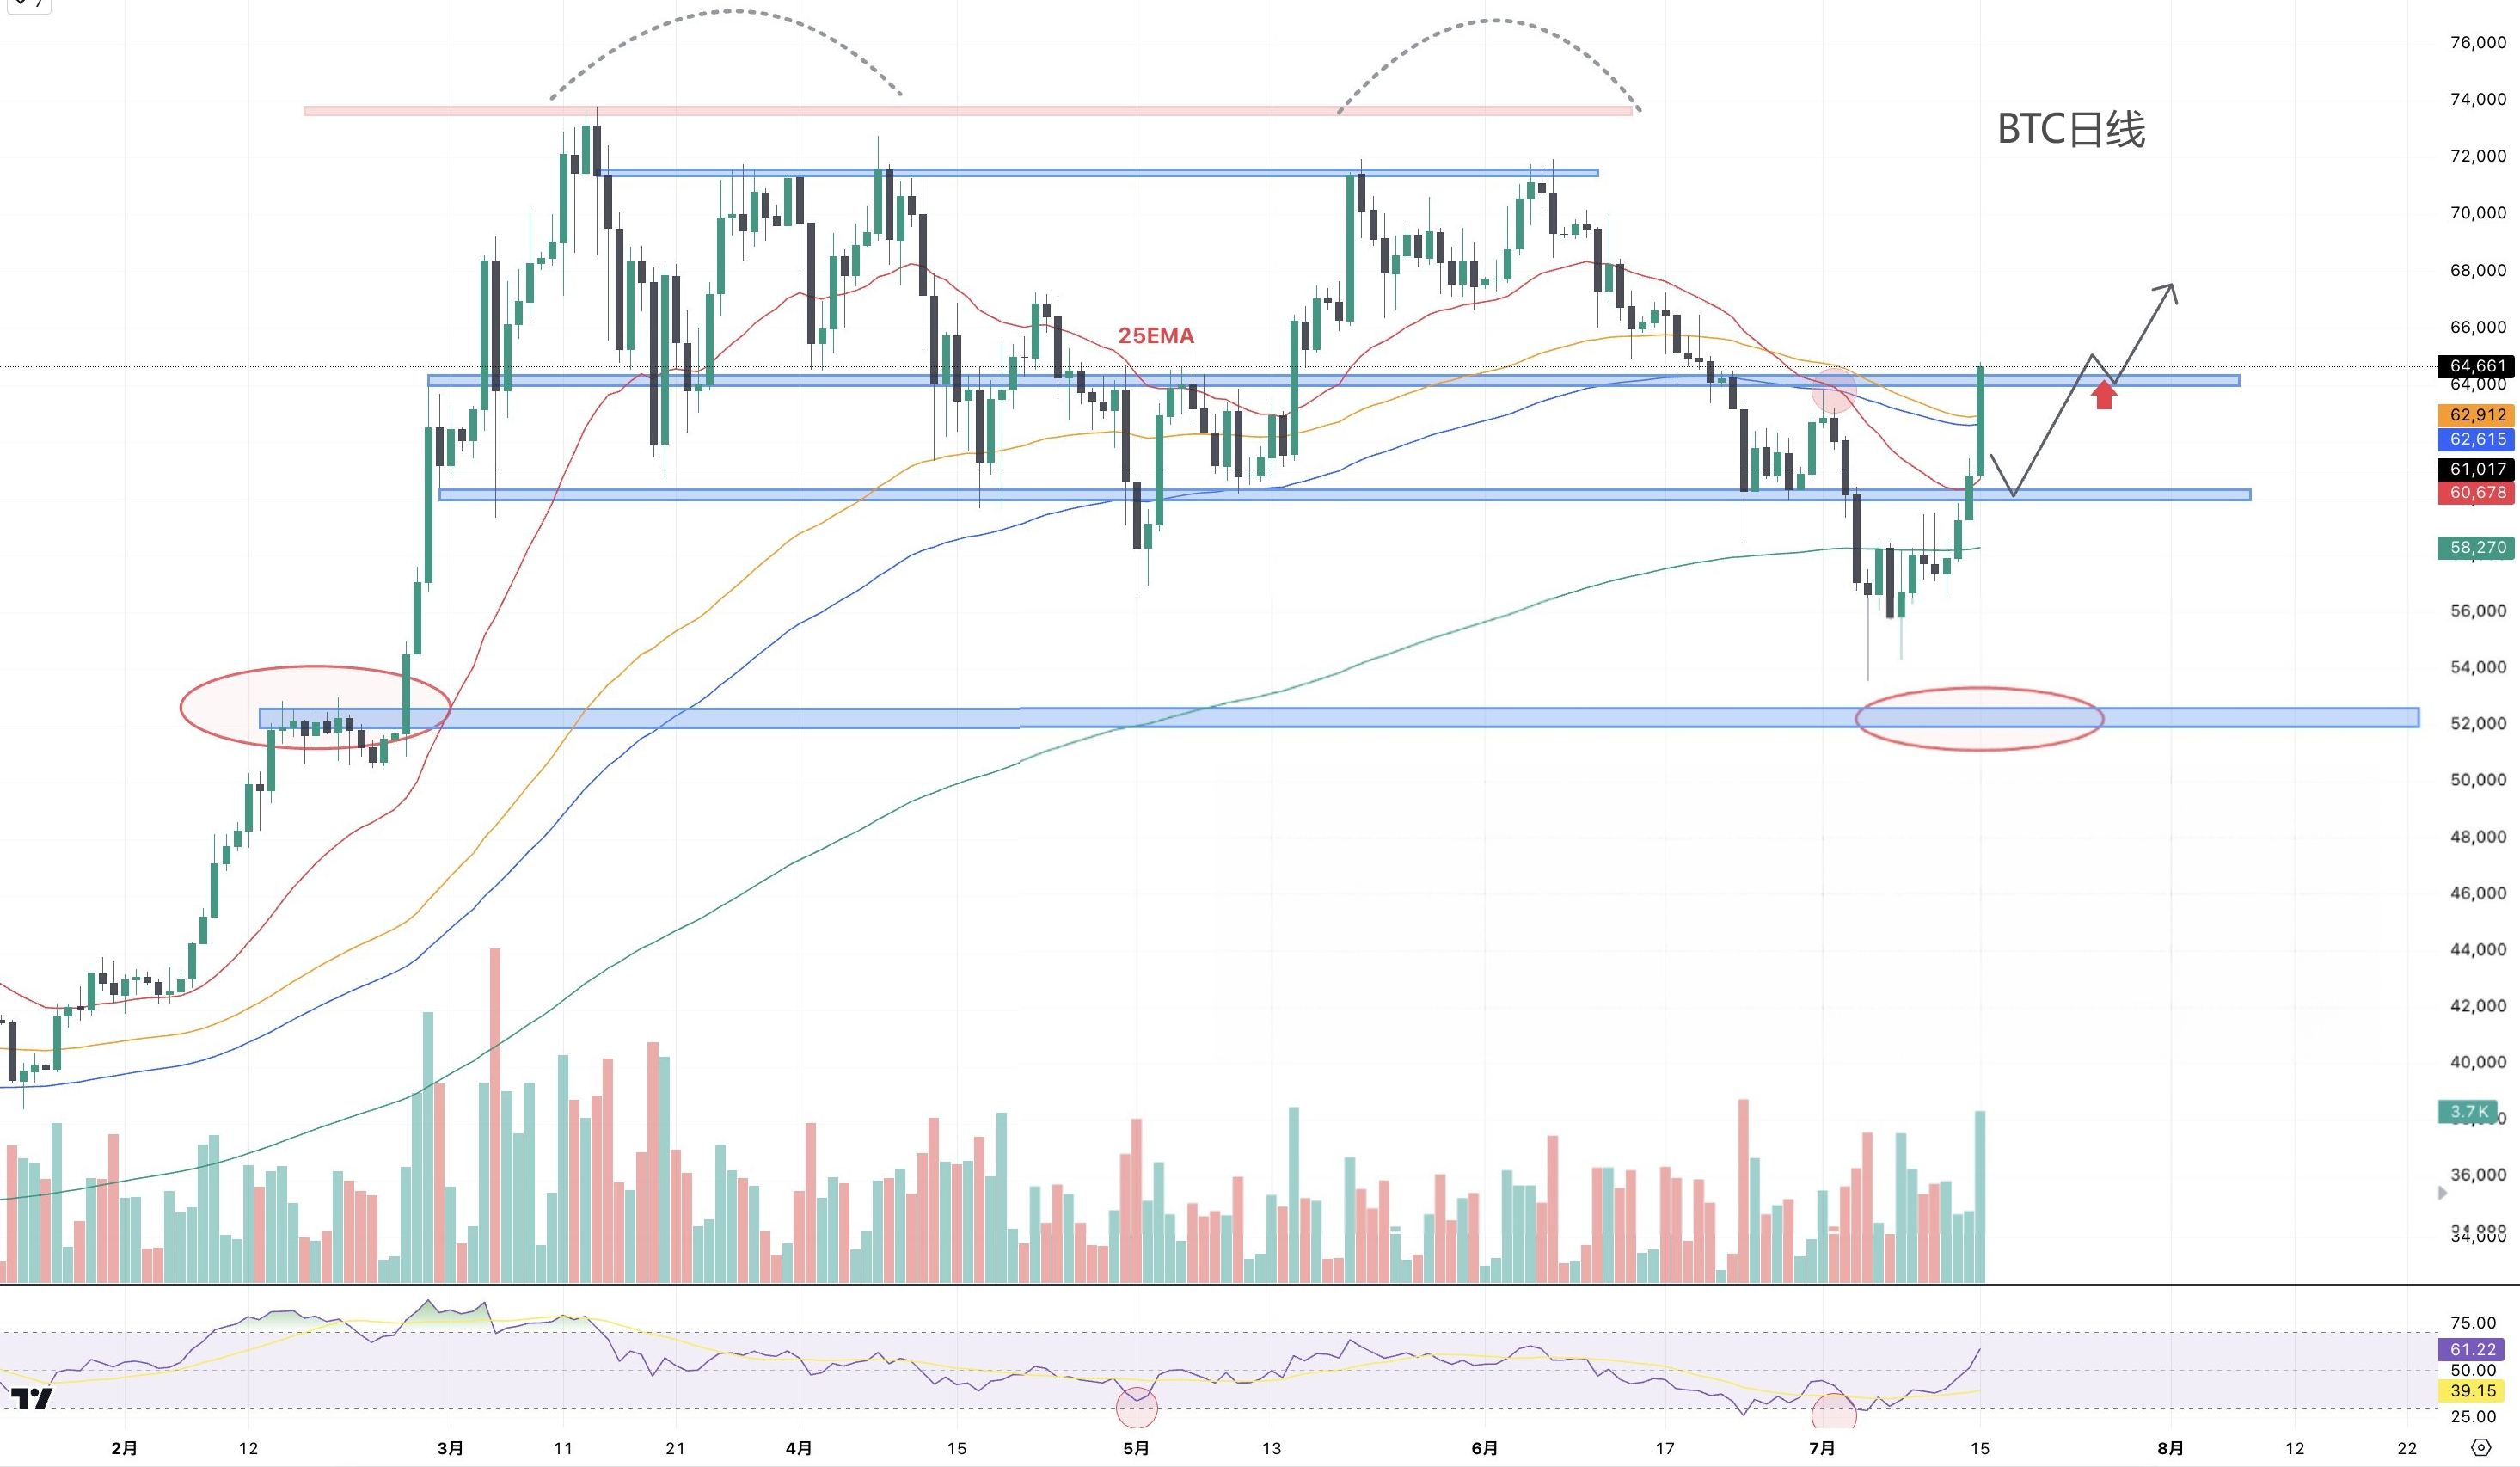
On the daily chart, the 25-day EMA has been broken through and the $60,000 mark has been surpassed, indicating a potential for continued upward movement.
The RSI is above 60 and still has room to rise, so attention should be paid to the potential upward trend. The $64,000 to $63,500 range is important. If support is formed in this area, a head and shoulders bottom pattern may emerge, bringing further potential for upward movement.
If there is a rebound supported by the 25-day moving average and an upward movement, a head and shoulders bottom pattern may be formed.
【BTC 4-hour Chart】
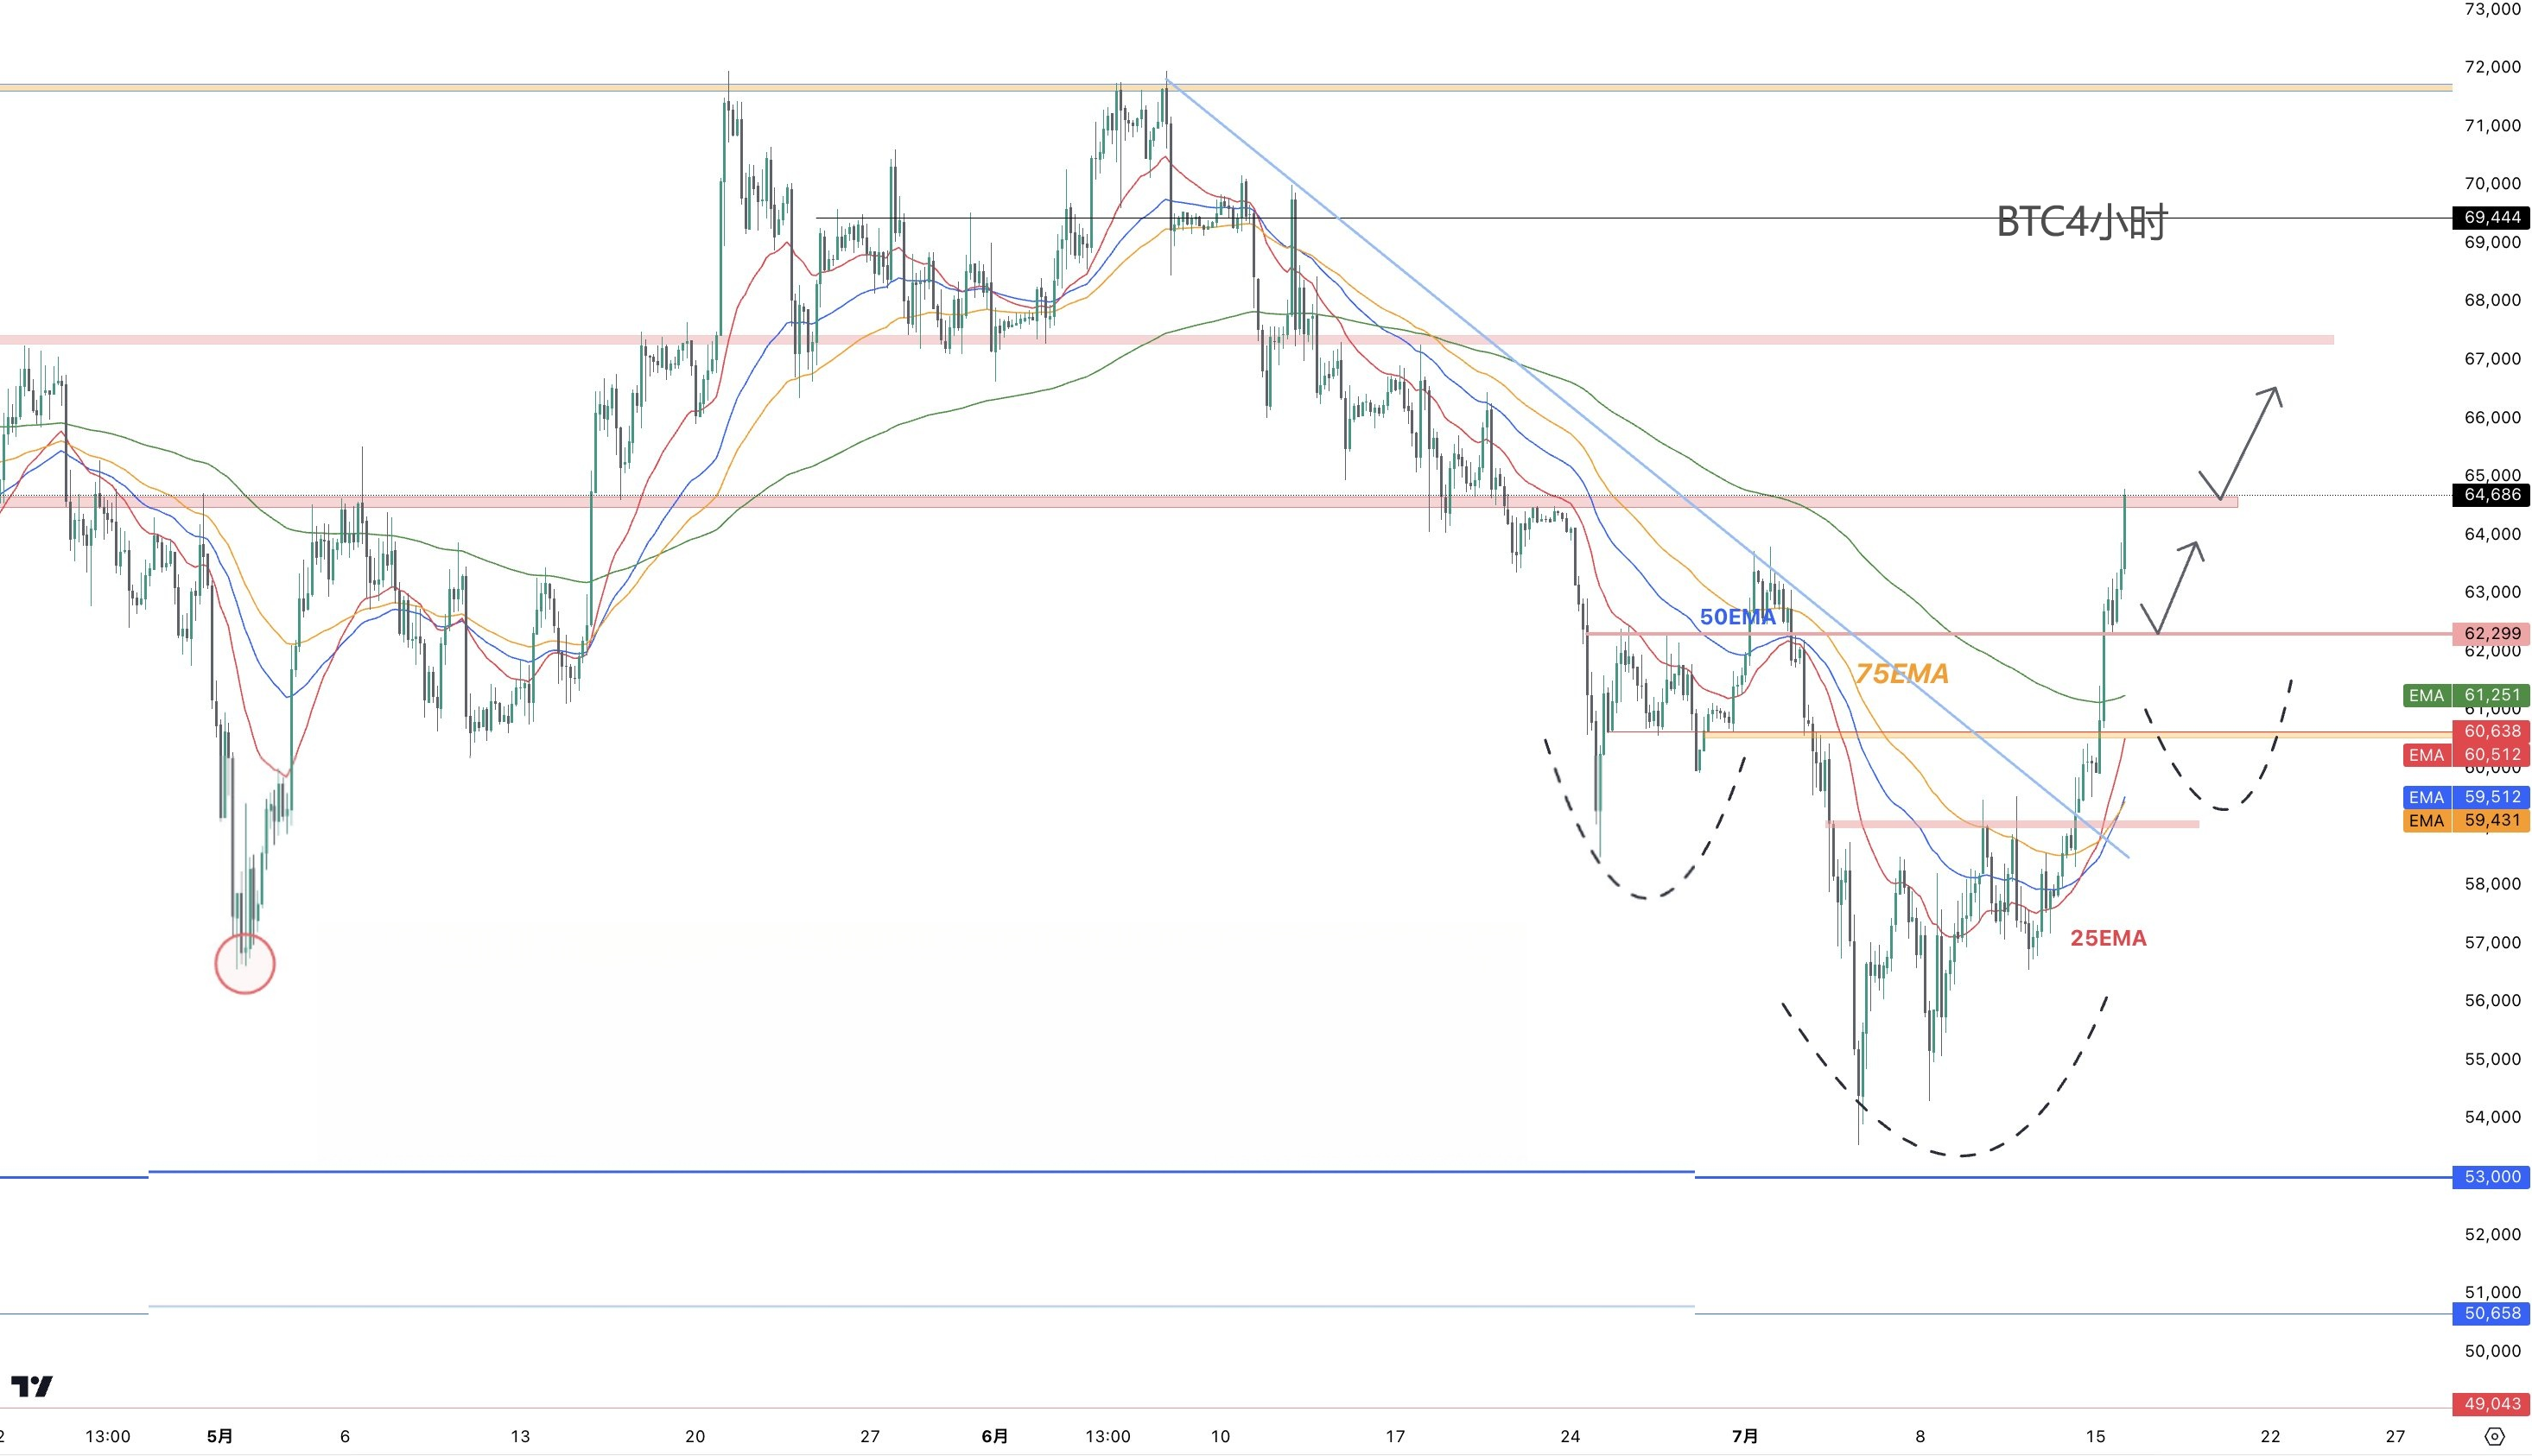
The market trend has already negated the downward channel and is showing an upward trend, making it suitable for long positions in the short term.
However, it is important to note that $64,500 is considered a resistance level. Considering the gap with the 25-day EMA, there may be a possibility of a short-term adjustment. Even from a risk-reward perspective, it is advisable to wait for a period of correction before entering the market.
【BTC 1-hour Chart】
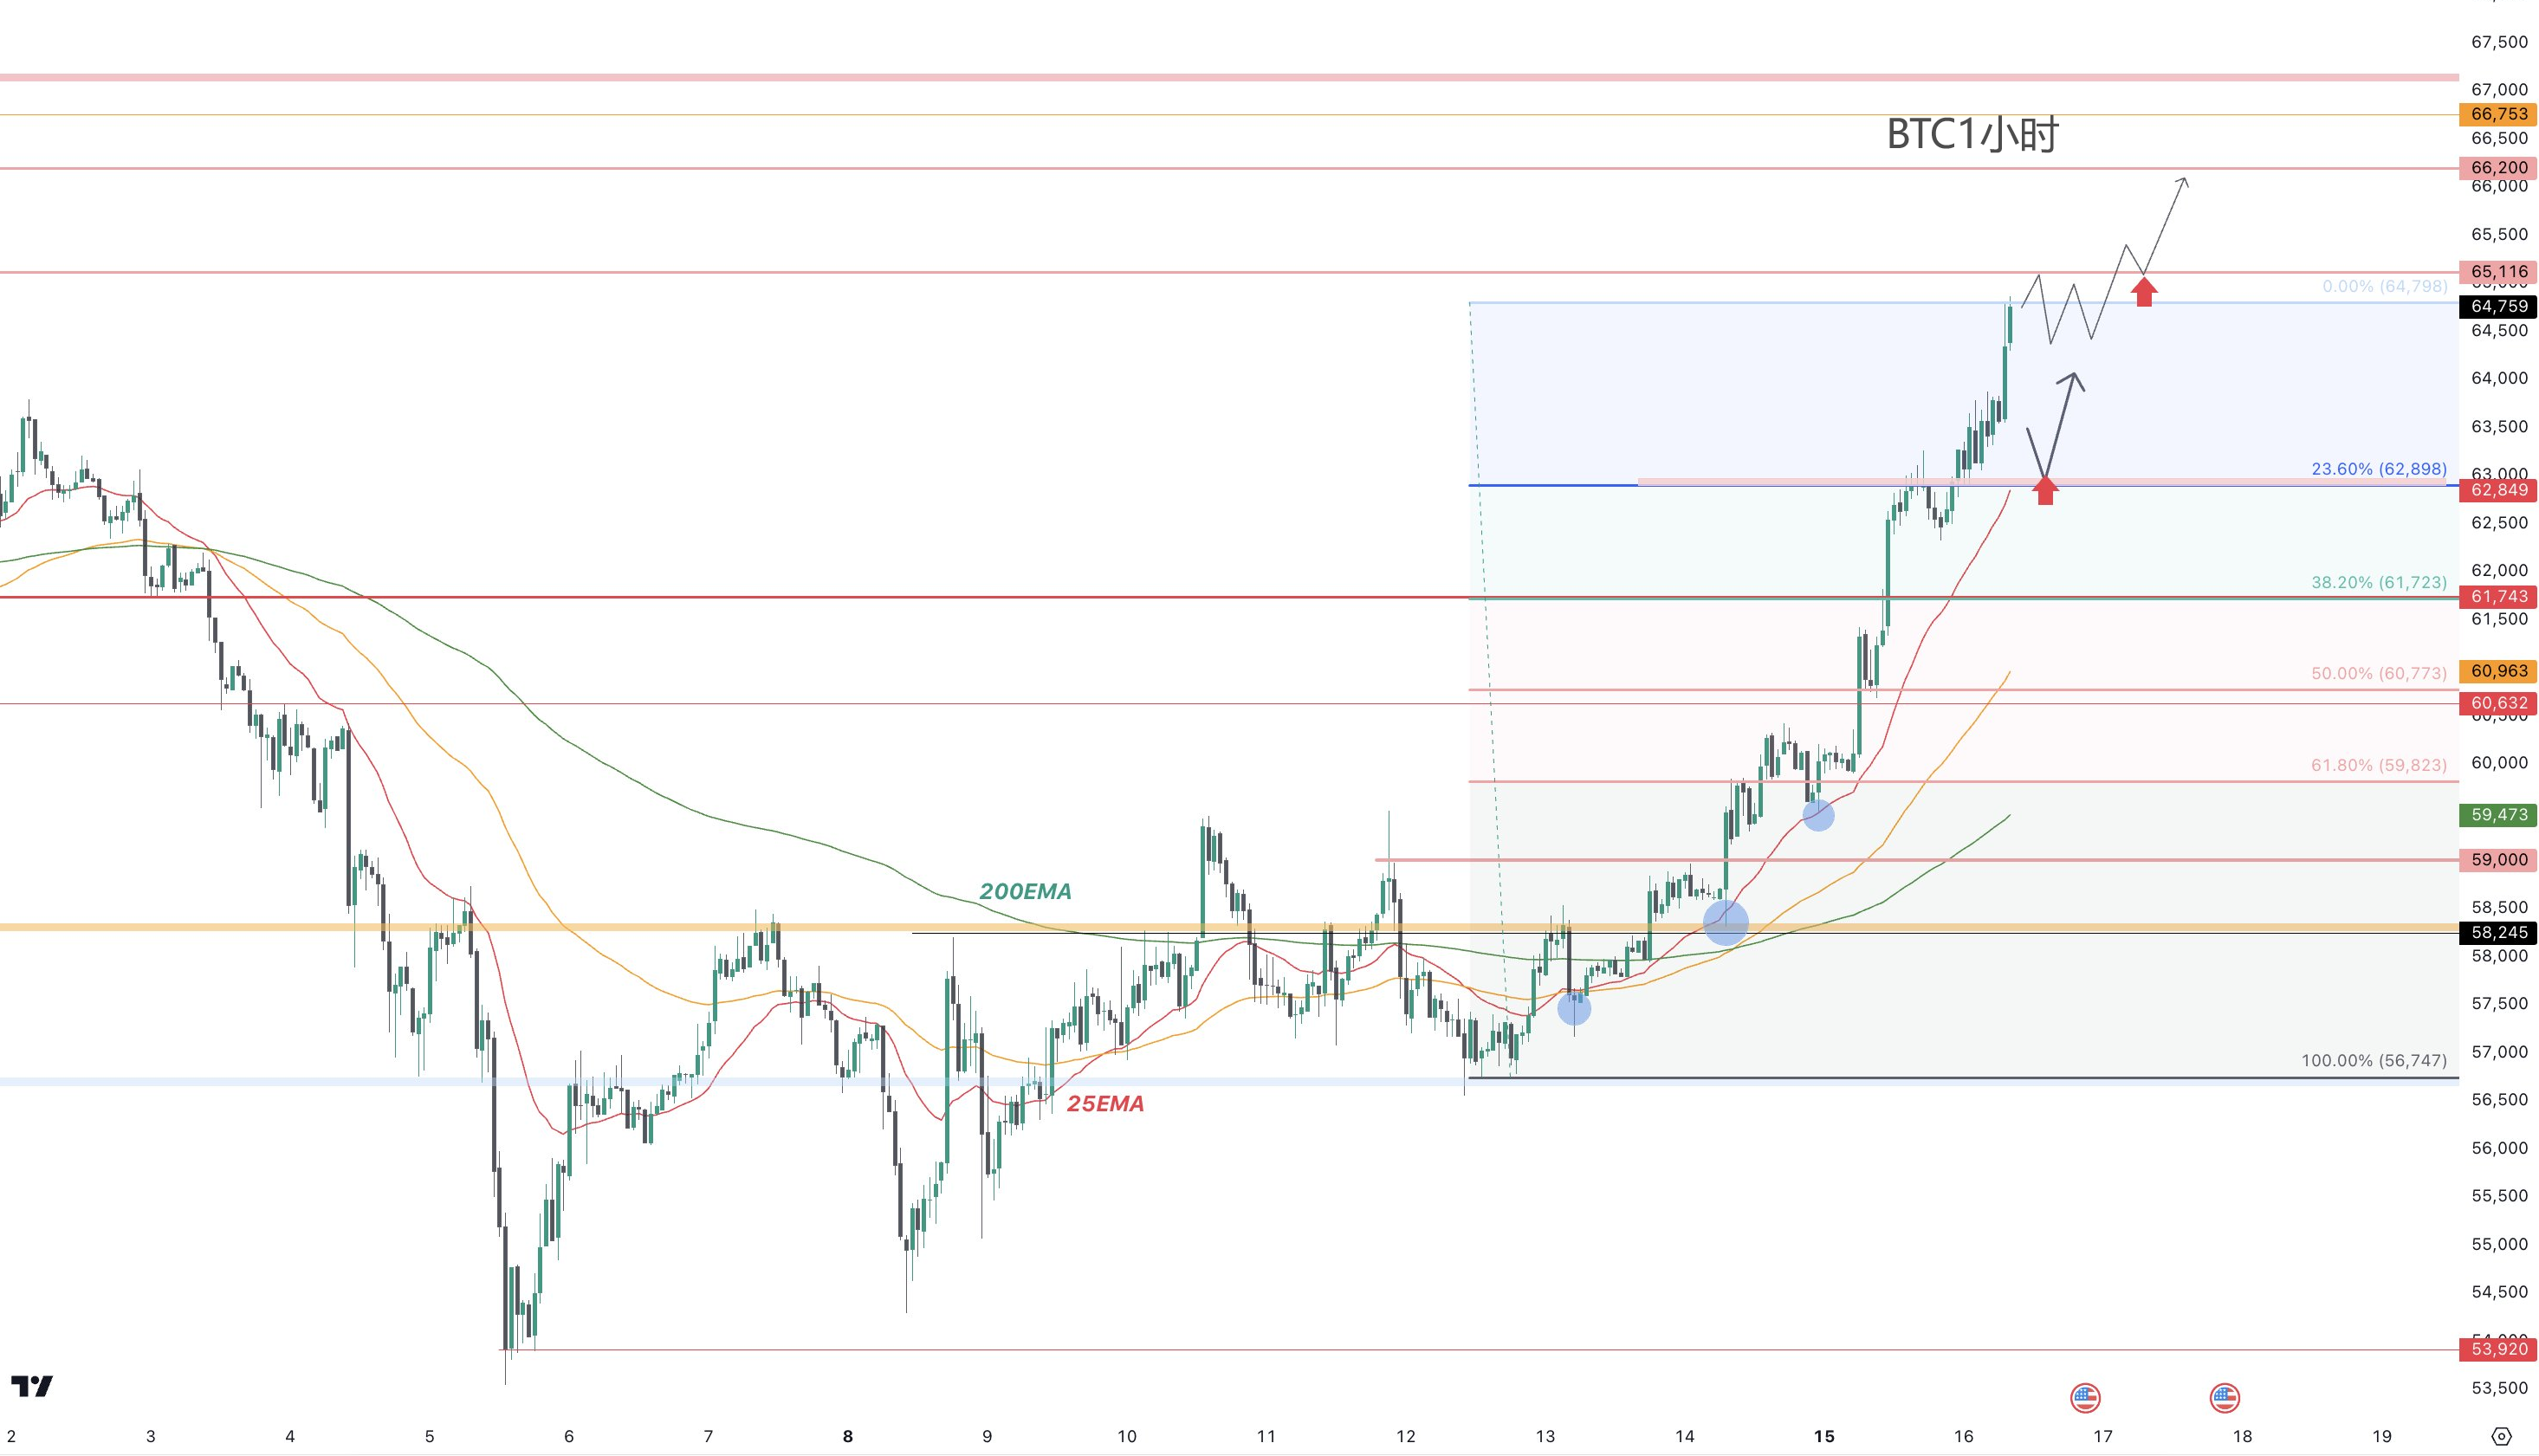
On the 1-hour chart, it is still necessary to wait for a correction to fill the gap with the 25-day moving average, or it is also ideal to enter the market after confirming the chart pattern.
~July 16th Ultra-short-term Entry Points~
① Long position with the 25-day moving average as support, near Fibonacci 23.6%.
Entry Price: $62,800 to $63,000
Stop Loss: $62,400
Target Price: $64,500
② After breaking through around $65,000 to $65,200, follow the trend for long positions, ideally after consolidating at the bottom. However, to cope with rapid rises, limit orders can also be set.
Stop Loss: $64,600
Target Price: $66,200
Jinrui remembers that some people thought BTC would drop to $20,000 to $30,000 last year, while others believed it would only rise. In fact, no one knows the answer. But Jinrui believes that the answer must be found in the chart, so paying attention to the dialogue with the chart is crucial.
No one can predict the future, all we can do is gradually accumulate profits by facing the chart.
If you want to receive real-time information later, please like & share to let me know 🙌🏻. If this is helpful to you, I hope you will like it ❤️ and follow, looking forward to your support.
I have years of in-depth research on spot contracts, BTC, ETH, and various altcoins. If you are not doing well in trading, experiencing long-term losses, or getting stuck in trades, you can follow my public account (Jinrui in the cryptocurrency circle). Investment involves risks, so be cautious when entering the market. The market fluctuates every day, and all I can do is to help you make correct investment decisions and manage your operations based on my years of practical experience.

The end of the article and other advertisements in the comments section are not related to me personally!! Please be cautious in distinguishing between true and false information. Thank you for reading.
免责声明:本文章仅代表作者个人观点,不代表本平台的立场和观点。本文章仅供信息分享,不构成对任何人的任何投资建议。用户与作者之间的任何争议,与本平台无关。如网页中刊载的文章或图片涉及侵权,请提供相关的权利证明和身份证明发送邮件到support@aicoin.com,本平台相关工作人员将会进行核查。


