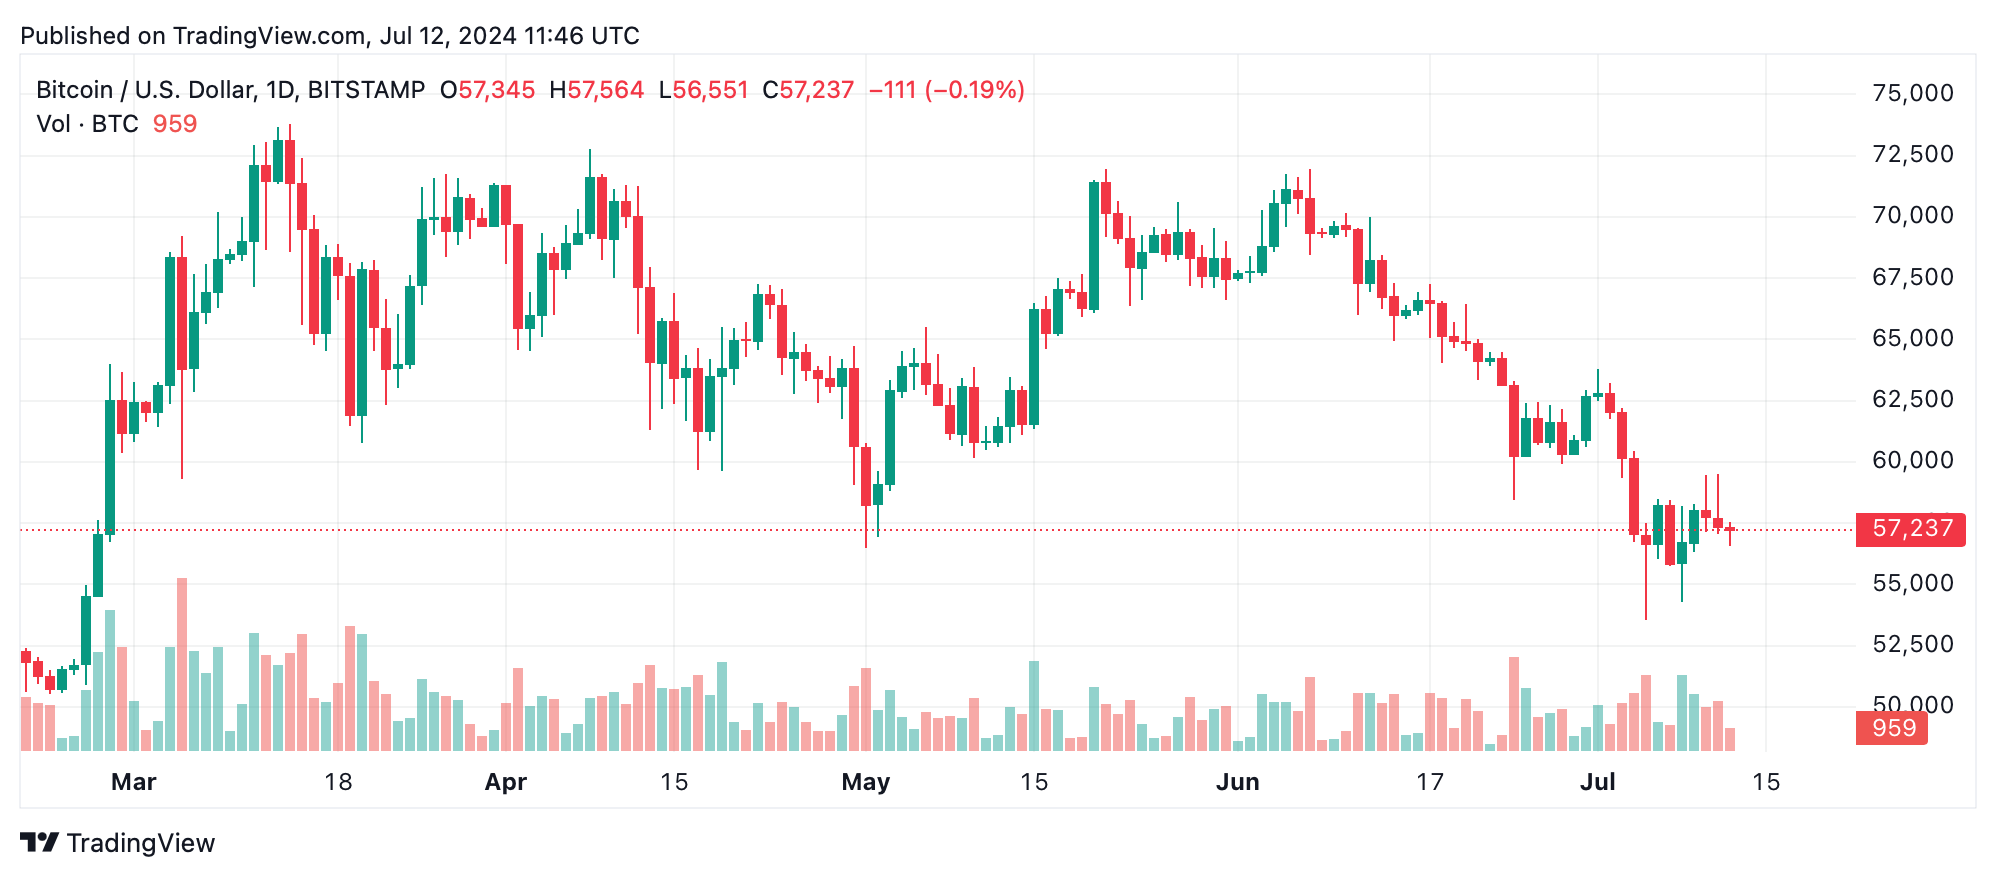
On the 1-hour chart, bitcoin shows a decline from a high of $59,516, forming lower highs and lower lows, indicative of a bearish trend. High trading volume is observed during significant price drops, especially around the larger ones, signifying stronger selling pressure. Conversely, the lower volume on the upswings points to weak buying interest.

BTC/USD daily chart on July 12.
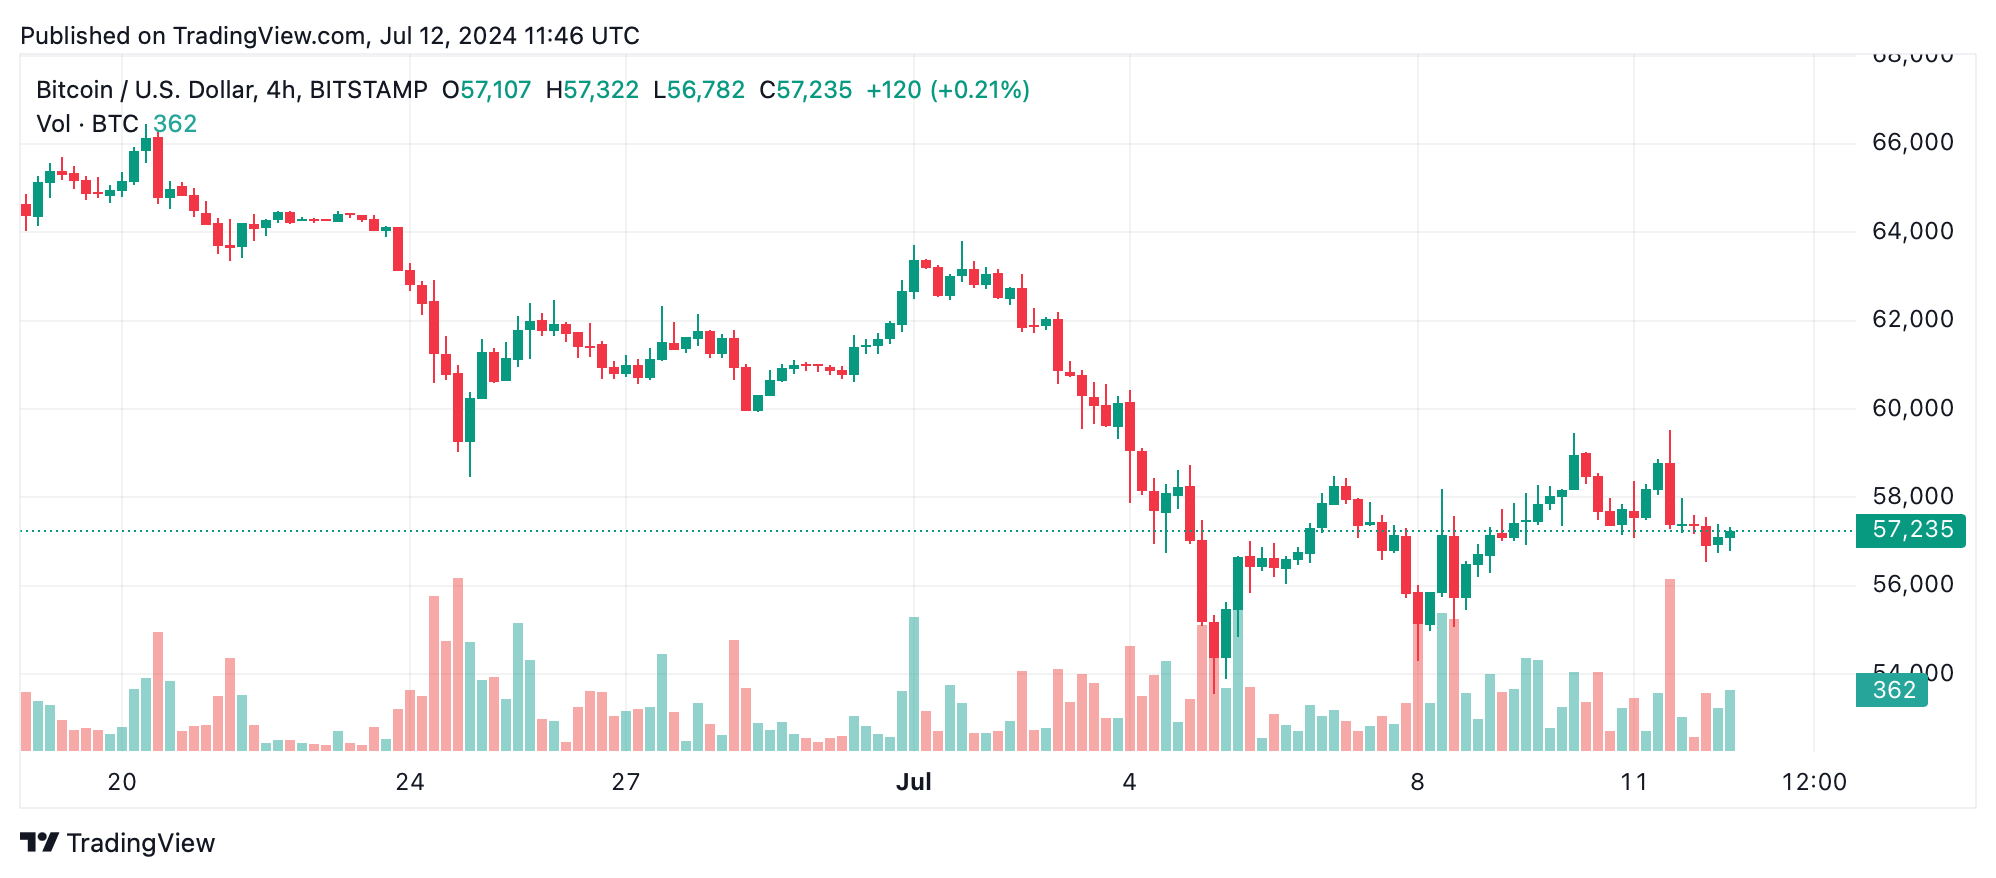
The 4-hour chart reflects a similar bearish pattern, more pronounced with highs at $59,516 and lows at $54,296. Strong selling pressure is evident from the volume spikes accompanying significant price movements, while weaker volume on the rises suggests unsuccessful attempts to push the price higher.

BTC/USD 4-hour chart on July 12.
Daily chart analysis shows a pronounced bearish trend with historical highs at $70,167 on June 9 and lows at $53,550 on July 4. Consistent lower highs and lower lows over a longer period reinforce the bearish outlook. High volume during price declines confirms strong selling pressure, while low volume on price increases indicates minimal bullish resistance.
Oscillators reveal mixed signals, with most indicators such as the relative strength index (RSI), Stochastic, and commodity channel index (CCI) in neutral zones, reflecting indecision in market momentum. Notably, the momentum indicator suggests a bullish signal, while the moving average convergence divergence (MACD) level indicates bearish pressure, presenting a conflicting short-term outlook. This necessitates careful monitoring of these indicators for any shifts in market sentiment.
Moving averages (MAs) across various periods (10, 20, 30, 50, 100, and 200) uniformly indicate a bearish signal, reinforcing the overall negative sentiment. The consistent selling pressure observed through these averages suggests that bitcoin may continue to face downward pressure unless a significant reversal occurs, supported by strong buying volume and positive market catalysts.
Bull Verdict:
Despite the current bearish indicators, if bitcoin’s price finds strong support around the $54,000 to $55,000 range and we see a significant increase in buying volume, a potential reversal could occur. Key exit targets around $58,000 to $59,000 would then present profitable opportunities, assuming resistance levels can be overcome.
Bear Verdict:
Given the consistent bearish trends across multiple timeframes, along with the dominant bearish signals from MAs and oscillators, bitcoin is likely to continue its downward trajectory. High selling pressure and weak buying interest suggest that entry points should be carefully considered around $55,500, with exit targets between $58,500 to $59,000 to capitalize on minor recoveries within the broader bearish market.
Register your email here to get weekly price analysis updates sent to your inbox:
免责声明:本文章仅代表作者个人观点,不代表本平台的立场和观点。本文章仅供信息分享,不构成对任何人的任何投资建议。用户与作者之间的任何争议,与本平台无关。如网页中刊载的文章或图片涉及侵权,请提供相关的权利证明和身份证明发送邮件到support@aicoin.com,本平台相关工作人员将会进行核查。


