The long and short positions of ETH are seriously divided. I plan to discuss it from two aspects.
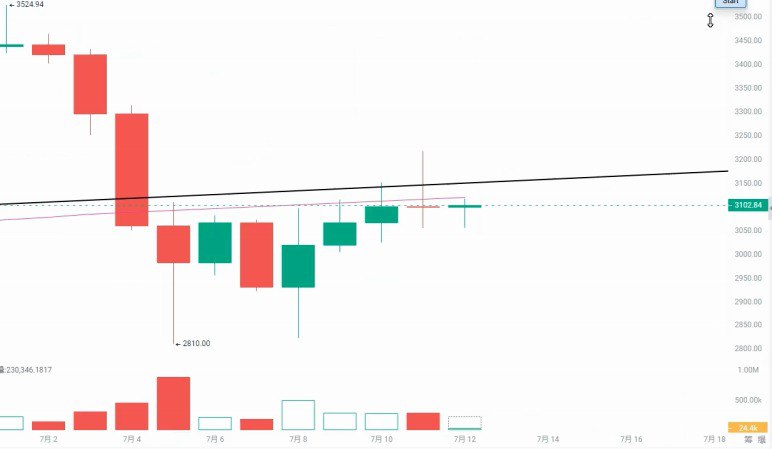
First, the 200-day moving average. The last time ETH fell below the 200-day moving average was on July 4th of this month, when a long shadow candlestick with significant volume was formed, and the price dropped to $3080. Since then, the price of Ethereum has repeatedly tested $2800, including the second test at $2820, all of which were strongly suppressed by the 200-day moving average. Previously, the 200-day moving average was a key support, but after breaking through, it has become an important resistance. For 7 days, the price has not been able to break through this moving average.
The closest candlestick to the 200-day moving average appeared yesterday, and after breaking through, it formed a doji with a stronger upper shadow, indicating stronger selling pressure above and relatively weak buying pressure. At the same time, there is also a channel line above the 200-day moving average, forming a double resistance. Therefore, it cannot be determined whether the price of Ethereum has reversed until it breaks through $3100 and stabilizes.
To achieve a reversal, it must stabilize at $3100, which means it is above the 200-day moving average and the channel line, at which point adding positions can be considered. During the downtrend, when it fell to $2820, it suggested a short-term trade. If there was no profit-taking, only after breaking through can positions be added, otherwise not.
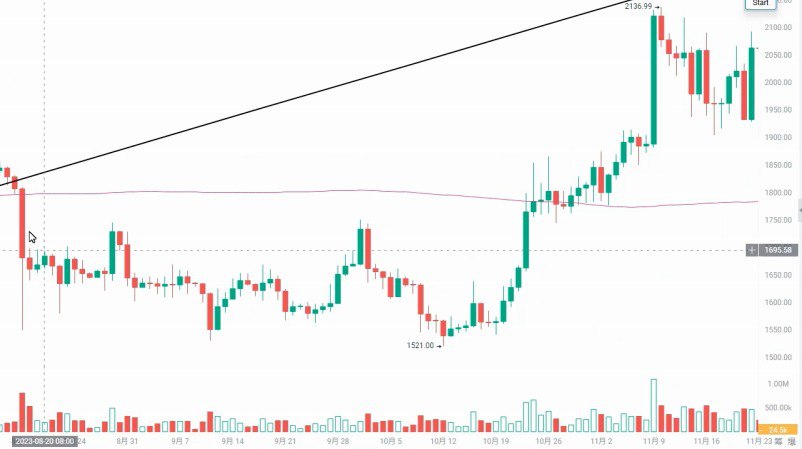
Looking back at the past trends, the performance of the 200-day moving average is extremely crucial. The most recent break occurred on August 17th, 23 years ago, also with significant volume, reaching a low of $1520, forming a consolidation range at the bottom, and two months later, it broke through and the price soared significantly.
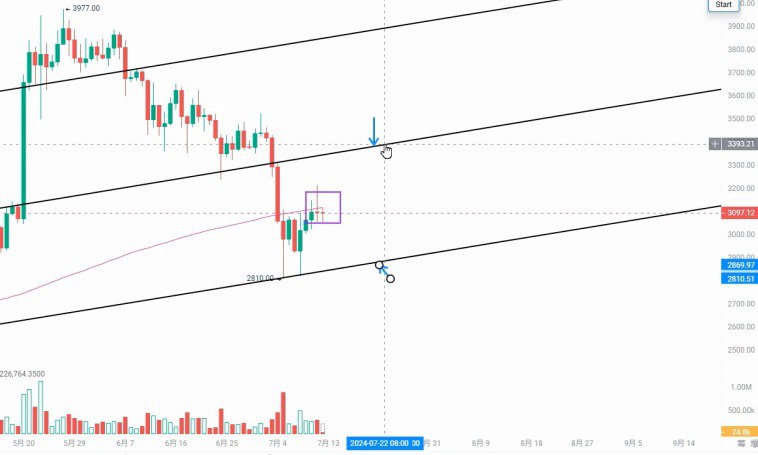
Second, analyzing the market from the perspective of the channel. The uniqueness of this channel lies in its ability to lock in the consolidation range at the top, consolidating within a relatively fixed range, with consistent height and amplitude. After the last consolidation area was broken, it will enter a new consolidation area, which ETH happens to meet.
This channel was also mentioned in the previous video, indicating the need for a consolidation after breaking through two. After breaking through two channels, it will undergo oscillating consolidation in another channel. By locking in the channel vertex, it is found that it has just broken through two channels and is located at the position of the 200-day moving average, which is extremely important. It must break through and stabilize to possibly usher in a good rebound market.
Similarly, shifting the channel downward, locking in the previous oscillation area, it happens to lock in the positions of the two candles at 2820-2810. Therefore, if it breaks through the 200-day moving average, the next target for Ethereum should be around $3400, but the premise is to break through. The current 200-day moving average becomes the mid-range. It is not suitable for long or short positions at this position. It seems that short positions have the advantage because a doji appeared at the position of the 200-day moving average, indicating a divergence between long and short positions, with the short positions slightly prevailing.
A better entry point is at 2800, 2860-2880, which is the lower channel, and short-term trading can be considered, but once it falls below 2810, that is, the breakthrough point, it must be stopped and exited. At the current position, shorting can be considered, with the stop-loss point being the breakthrough of the 200-day moving average. In summary, for trading opportunities, it is recommended to go long back to the lower channel at 2860 for short-term trading, go short at the upper channel, and remain cautious in the middle position.
The above is all the content analysis for today. For more content, please contact the assistant to join the VIP and get more wealth information.
免责声明:本文章仅代表作者个人观点,不代表本平台的立场和观点。本文章仅供信息分享,不构成对任何人的任何投资建议。用户与作者之间的任何争议,与本平台无关。如网页中刊载的文章或图片涉及侵权,请提供相关的权利证明和身份证明发送邮件到support@aicoin.com,本平台相关工作人员将会进行核查。


