Can BTC be bought at the bottom when others panic and I am greedy?

1. German government liquidates a large amount of Bitcoin
On-chain data shows that the German government recently transferred over $195 million worth of Bitcoin to various cryptocurrency exchanges, including Coinbase, Kraken, and Bitstamp, exacerbating market volatility. Critics believe that such large-scale selling by the government may have a long-term negative impact on the stability of the cryptocurrency market. These bitcoins were seized from the investigation of the illegal website Movie2k.to, and approximately 50,000 bitcoins were confiscated at that time.
2. Panic has not yet appeared, but irrational emotions may spread
Although the implied volatility of the market is currently at a low level, it has been on the rise in recent years. This indicates that market sentiment is becoming more unstable. While panic has not yet appeared, irrational emotions may spread.
3. Buying opportunities come after real panic occurs
When the market truly experiences panic, prices often fall significantly below the intrinsic value of the assets. This is the best opportunity for bottom fishing, as investors can purchase high-value assets at very attractive prices. Investors should remain calm, wait for further market developments, and seize the real opportunity to buy at the bottom.
Specific reference to several time points for Bitcoin:
March 2020 -33%, implied volatility 190
Bitcoin performance: In March 2020, the price of Bitcoin dropped to a low of about $4,000. This sharp decline was referred to as "Black Thursday," during which Bitcoin plummeted by over 50% from its high of about $9,000 in just a few days.
Bottom fishing signal: Despite strong market panic, this sharp decline also provided an excellent opportunity for bottom fishing. With governments and central banks around the world launching large-scale economic stimulus plans, Bitcoin quickly rebounded in the following months and had recovered and surpassed its historical high of $20,000 by the end of the year.
May 2021 -45%, implied volatility 160
Bitcoin performance: In May 2021, the price of Bitcoin dropped to around $30,000. This decline represented a halving of Bitcoin's price from its historical high of nearly $65,000 in April.
Bottom fishing signal: Despite panic selling in the market, bottom fishers and long-term investors quickly intervened, believing in the long-term prospects of Bitcoin. Subsequently, the price of Bitcoin gradually rebounded and once again surpassed the $60,000 level by the end of 2021.
June and November 2022 -22%, implied volatility 110
Bitcoin performance: In November 2022, the price of Bitcoin dropped to around $16,000. This decline reflected a significant blow to market confidence in the cryptocurrency industry, especially a crisis of trust in some major trading platforms.
Bottom fishing signal: Nevertheless, some investors saw this as an excellent entry point for holding Bitcoin in the long term. As the market gradually digested the negative news, the price of Bitcoin stabilized in the following months and showed signs of a rebound.
July 2024 -8%, implied volatility increased to 57.5, waiting for the right time to buy at the bottom
Although the implied volatility of the market has increased, it has not yet reached a true panic level. Investors should closely monitor market trends and wait for more obvious panic signals before buying at the bottom.
Conclusion
The sharp declines and subsequent bottoms at the several time points mentioned above have provided valuable lessons for investors. Short-term market fluctuations should not affect the evaluation of the long-term value of Bitcoin. Patient investors often discover undervalued assets after panic selling, leading to substantial returns when the market recovers.
Approximately 24 days until the next Federal Reserve interest rate meeting (2024.08.01)
https://hk.investing.com/economic-calendar/interest-rate-decision-168
Market Technical and Sentiment Analysis

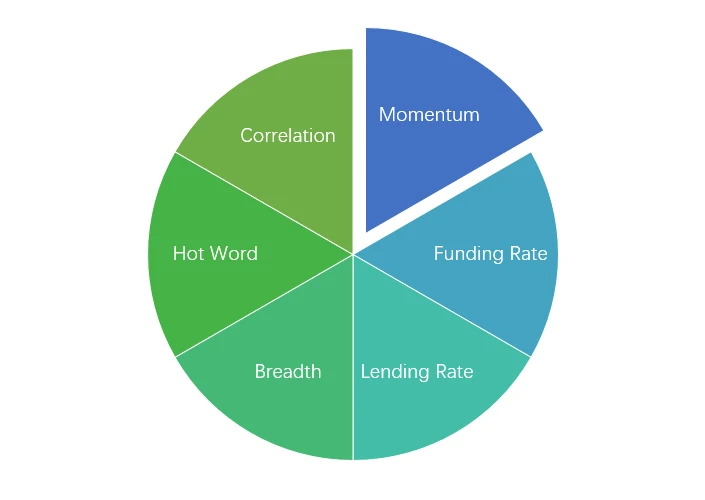
Emotion Analysis Composition

Technical Indicators
Price Trend
BTC price dropped by -7.55% and ETH price dropped by -11.32% in the past week.
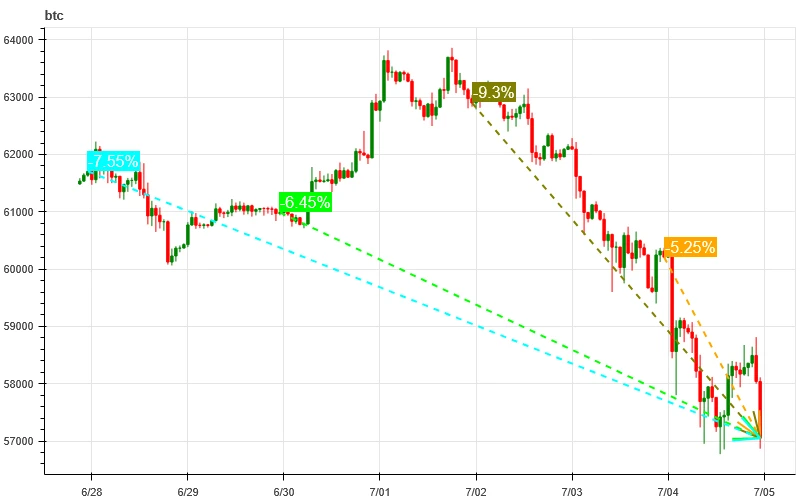
The above chart shows the price trend of BTC over the past week.
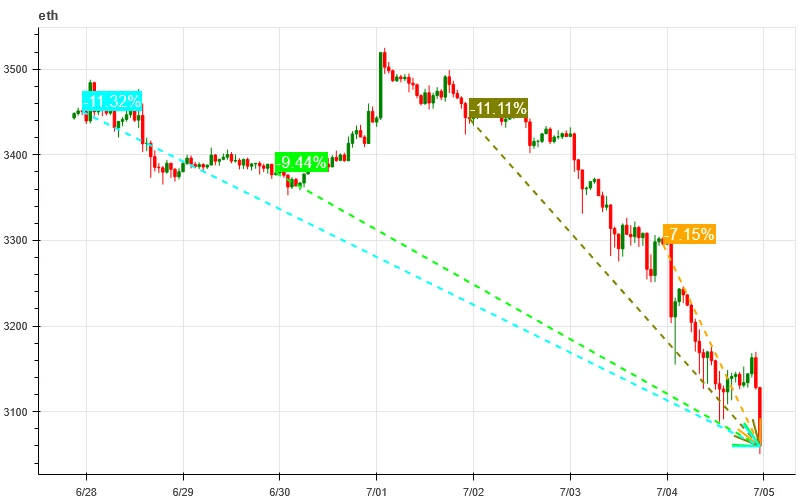
The above chart shows the price trend of ETH over the past week.
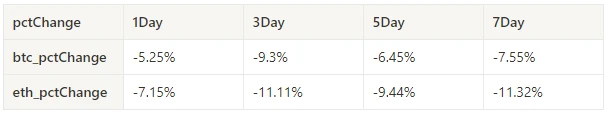
The table shows the price change rate over the past week.
Price-Volume Distribution Chart (Support and Resistance)
BTC and ETH continued to decline after breaking through the dense trading area on July 4th.
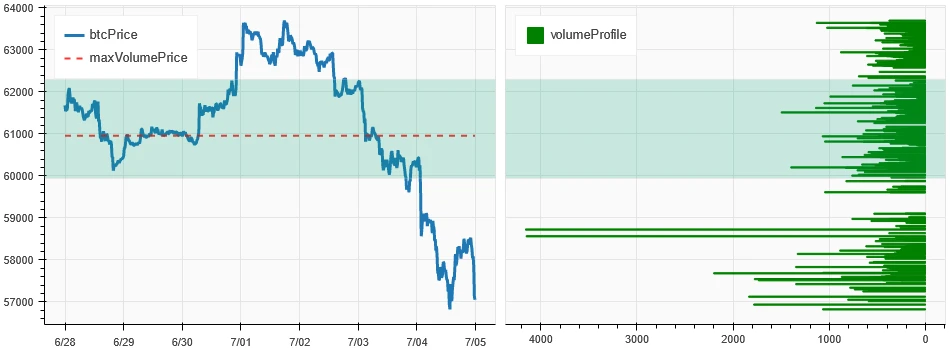
The above chart shows the distribution of the dense trading area for BTC over the past week.
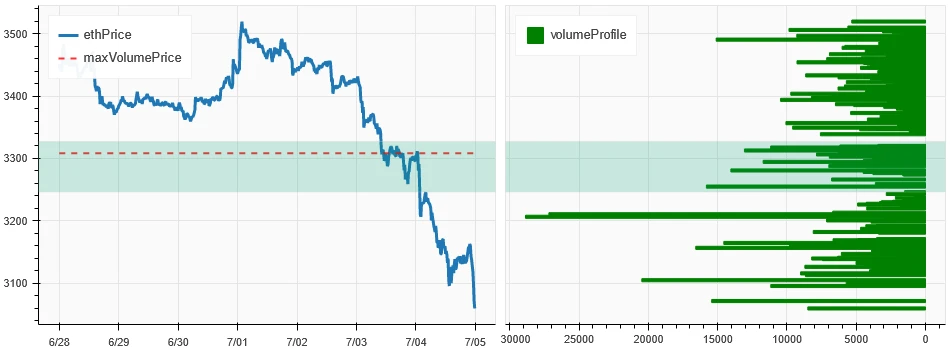
The above chart shows the distribution of the dense trading area for ETH over the past week.
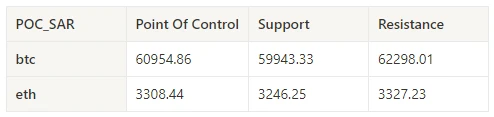
The table shows the dense trading intervals for BTC and ETH over the past week.
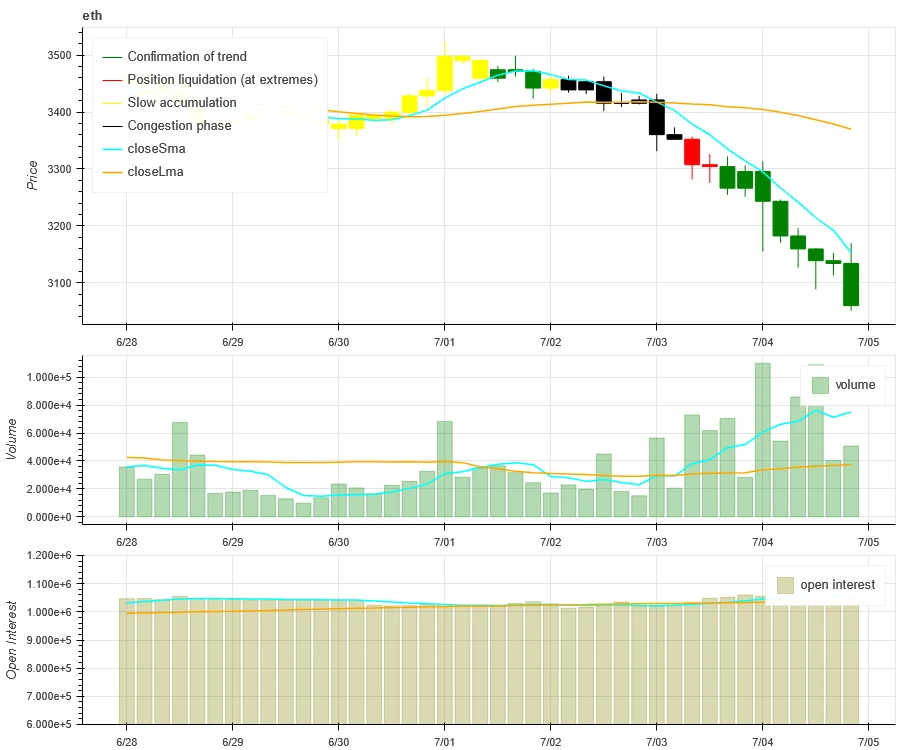
Volume and Open Interest
The past week saw the highest trading volume for BTC and ETH on July 4th, while the open interest for both BTC and ETH continued to rise.
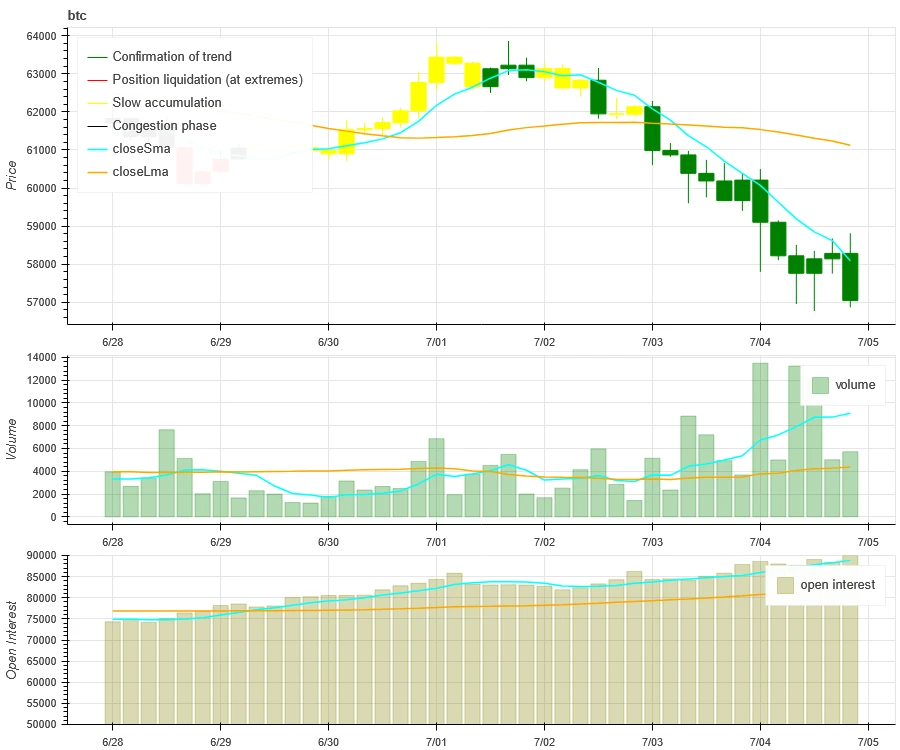
The top section of the above image shows the price trend for BTC, with the middle section displaying the trading volume and the bottom section showing the open interest. The light blue line represents the 1-day average, and the orange line represents the 7-day average. The color of the candlesticks indicates the current status: green for price increase with volume support, red for liquidation, yellow for slow accumulation, and black for congestion.
The top section of the above image shows the price trend for ETH, with the middle section displaying the trading volume and the bottom section showing the open interest. The light blue line represents the 1-day average, and the orange line represents the 7-day average. The color of the candlesticks indicates the current status: green for price increase with volume support, red for liquidation, yellow for slow accumulation, and black for congestion.
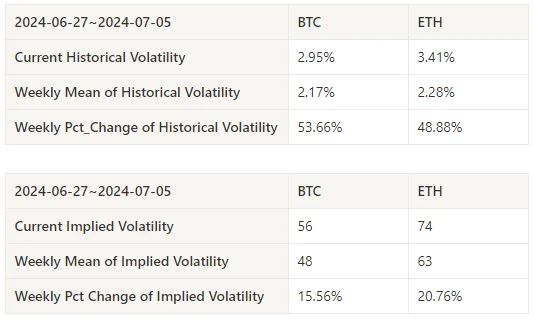
Historical Volatility and Implied Volatility
The historical volatility for BTC and ETH was highest on July 4th, while the implied volatility for both BTC and ETH increased simultaneously.
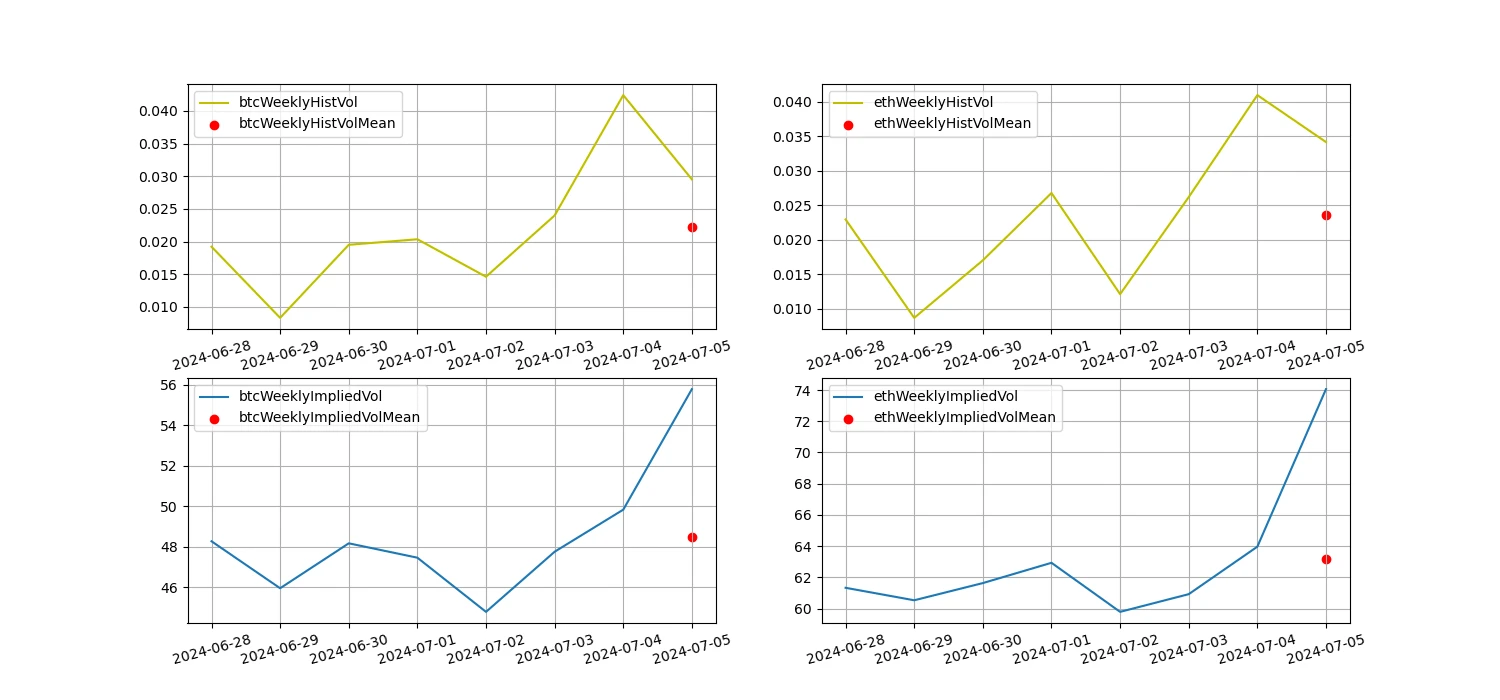
The yellow line represents historical volatility, the blue line represents implied volatility, and the red dots represent the 7-day average.
Event-Driven
No data was released in the past week.
Sentiment Indicators
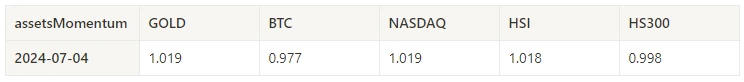
Momentum Sentiment
In the past week, gold was the strongest performer among Bitcoin, gold, Nasdaq, Hang Seng, and CSI 300, while Bitcoin performed the worst.
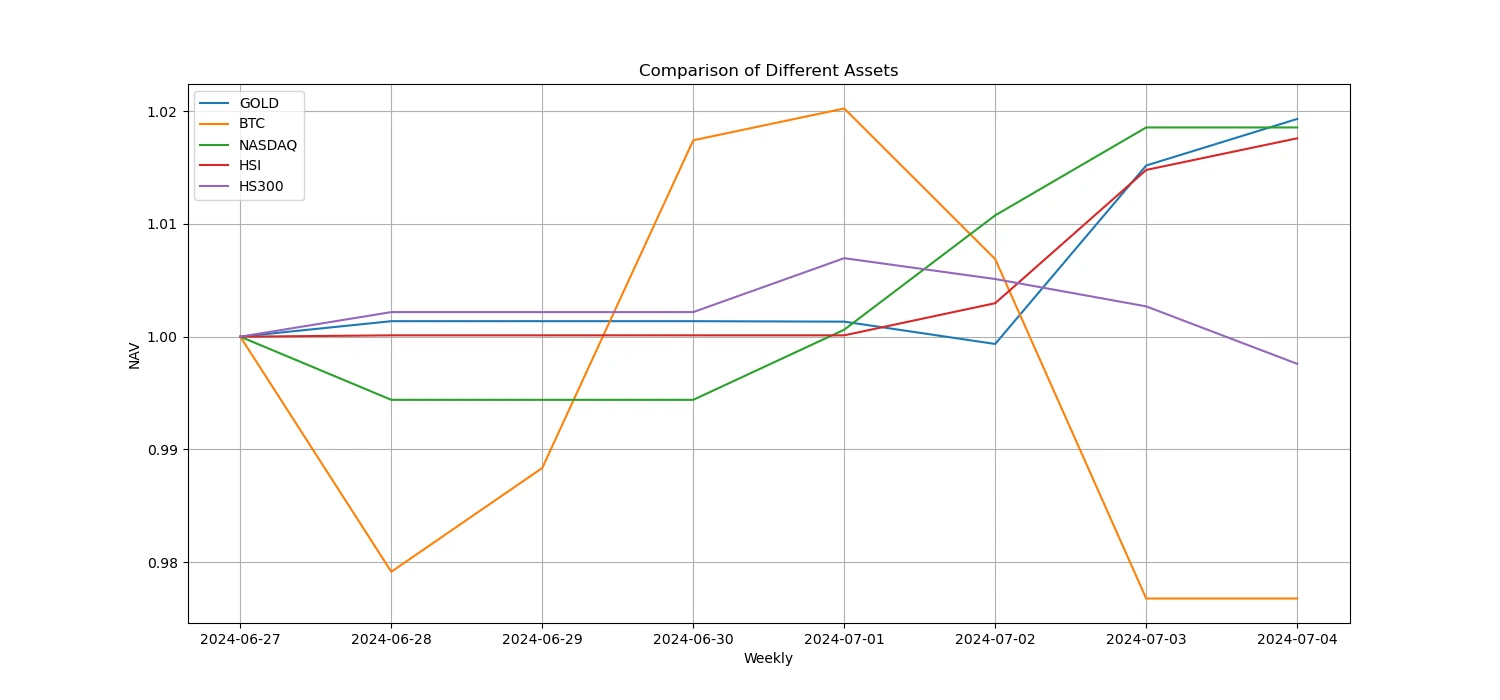
The above image shows the performance of different assets over the past week.
Lending Rate - Borrowing Sentiment
The average annualized USD lending yield in the past week was 11.4%, with short-term rates remaining at 12.8%.
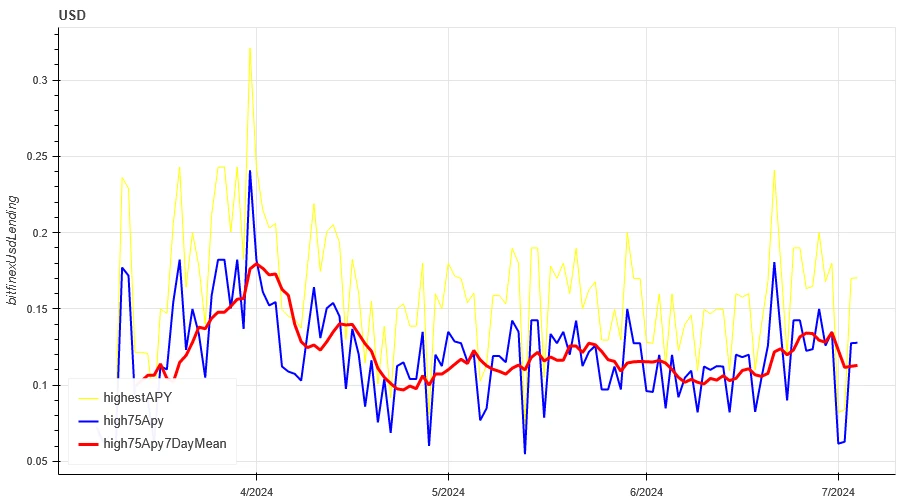
The yellow line represents the highest USD lending rate, the blue line represents 75% of the highest rate, and the red line represents the 7-day average of 75% of the highest rate.
The table shows the average yield of USD lending for different holding periods in the past.
Funding Rate - Contract Leverage Sentiment
The average annualized yield for BTC funding in the past week was 10.9%, and the contract leverage sentiment remained at a relatively low level.
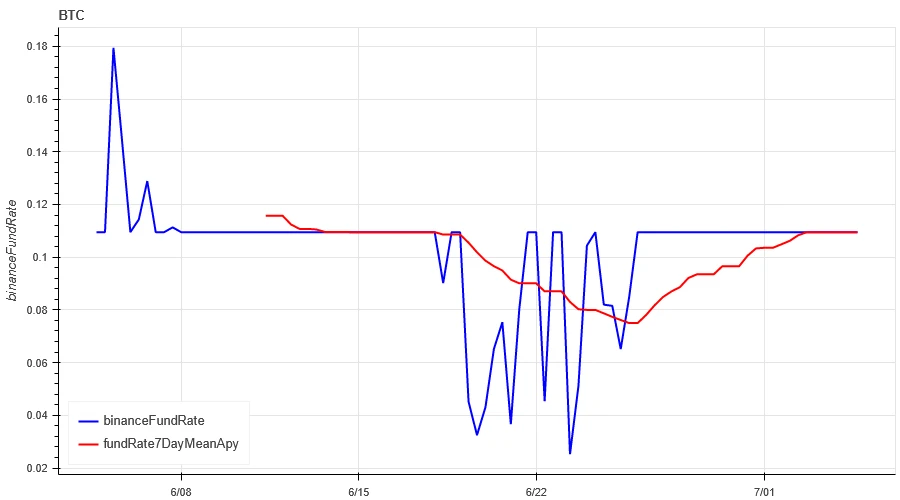
The blue line represents the funding rate for BTC on Binance, and the red line represents the 7-day average.
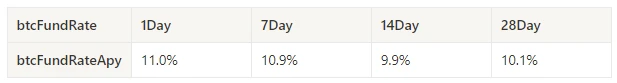
The table shows the average yield of BTC funding for different holding periods in the past.
Market Correlation - Consistency Sentiment
The correlation among the selected 129 coins decreased to around 0.73 in the past week, while the consistency among different varieties increased significantly.
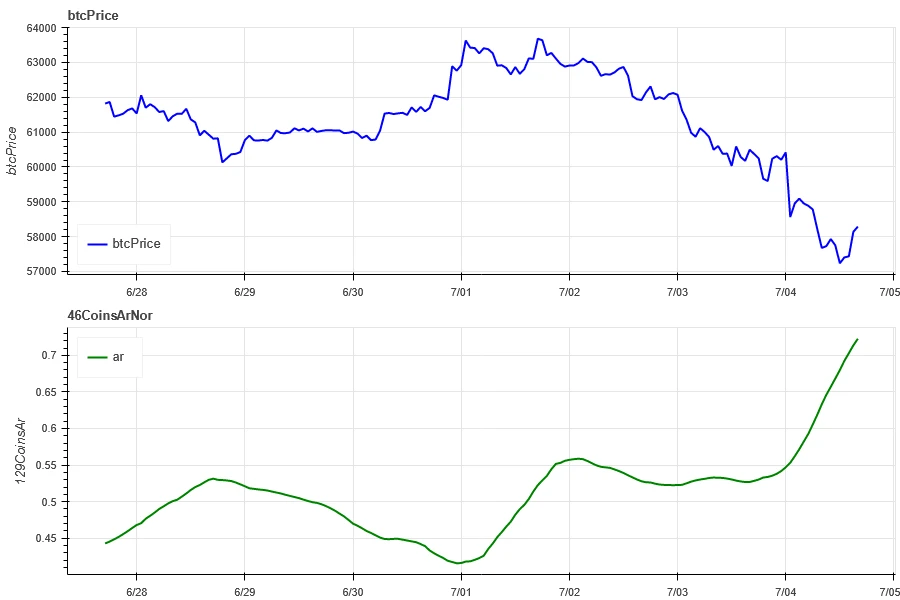
The blue line in the above chart represents the price of Bitcoin, while the green line represents the overall correlation of the following tokens: ['1000floki', '1000lunc', '1000pepe', '1000shib', '1000xec', '1inch', 'aave', 'ada', 'agix', 'algo', 'ankr', 'ant', 'ape', 'apt', 'arb', 'ar', 'astr', 'atom', 'audio', 'avax', 'axs', 'bal', 'band', 'bat', 'bch', 'bigtime', 'blur', 'bnb', 'btc', 'celo', 'cfx', 'chz', 'ckb', 'comp', 'crv', 'cvx', 'cyber', 'dash', 'doge', 'dot', 'dydx', 'egld', 'enj', 'ens', 'eos','etc', 'eth', 'fet', 'fil', 'flow', 'ftm', 'fxs', 'gala', 'gmt', 'gmx', 'grt', 'hbar', 'hot', 'icp', 'icx', 'imx', 'inj', 'iost', 'iotx', 'jasmy', 'kava', 'klay', 'ksm', 'ldo', 'link', 'loom', 'lpt', 'lqty', 'lrc', 'ltc', 'luna2', 'magic', 'mana', 'matic', 'meme', 'mina', 'mkr', 'near', 'neo', 'ocean', 'one', 'ont', 'op', 'pendle', 'qnt', 'qtum', 'rndr', 'rose', 'rune', 'rvn', 'sand', 'sei', 'sfp', 'skl', 'snx', 'sol', 'ssv', 'stg', 'storj', 'stx', 'sui', 'sushi', 'sxp', 'theta', 'tia', 'trx', 't', 'uma', 'uni', 'vet', 'waves', 'wld', 'woo', 'xem', 'xlm', 'xmr', 'xrp', 'xtz', 'yfi', 'zec', 'zen', 'zil', 'zrx’].
Market Breadth - Overall Sentiment
In the past week, out of the selected 129 tokens, the percentage of tokens with prices above the 30-day moving average was 3.9%, relative to BTC's percentage of 16.5%. The percentage of tokens with a distance from the 30-day low of more than 20% was 2.3%, and the percentage of tokens with a distance from the 30-day high of less than 10% was also 2.3%. The market breadth indicator in the past week shows that the majority of tokens continued to be in a downtrend.
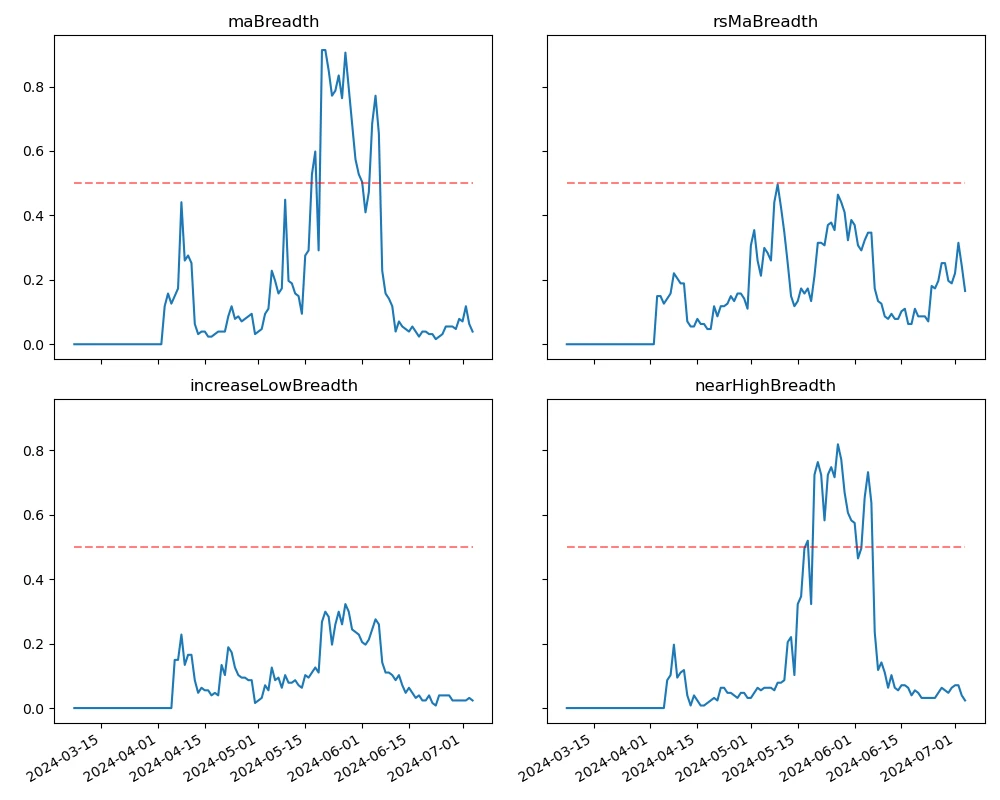
The above image shows the percentage of various breadth indicators for the tokens listed in the previous paragraph over the past 30 days.

Summary
In the past week, the prices of Bitcoin (BTC) and Ethereum (ETH) continued to decline, with their volatility and trading volume reaching their highest levels on July 4th during the decline. The open interest for Bitcoin and Ethereum both increased. Additionally, the implied volatility for Bitcoin and Ethereum also increased simultaneously. The funding rate for Bitcoin remained at a low level, which may reflect the continued low leverage sentiment among market participants for Bitcoin. The market breadth indicator shows that the majority of cryptocurrencies continued their downtrend, indicating a sustained weak trend in the overall market over the past week.
Twitter: @https://x.com/CTA_ChannelCmt
Website: channelcmt.com
免责声明:本文章仅代表作者个人观点,不代表本平台的立场和观点。本文章仅供信息分享,不构成对任何人的任何投资建议。用户与作者之间的任何争议,与本平台无关。如网页中刊载的文章或图片涉及侵权,请提供相关的权利证明和身份证明发送邮件到support@aicoin.com,本平台相关工作人员将会进行核查。


