This article is exclusively analyzed by Baiqi & Guanyuyu, representing their exclusive viewpoints. They have in-depth research and practical experience in BTC, ETH, and various altcoins. Due to the timing of the article, the following viewpoints and suggestions are not real-time and are for reference only. Please bear the risks, and indicate the source when reposting. Control your positions reasonably, and avoid heavy or full positions. For more cryptocurrencies and spot strategies, please follow the official account.
BTC
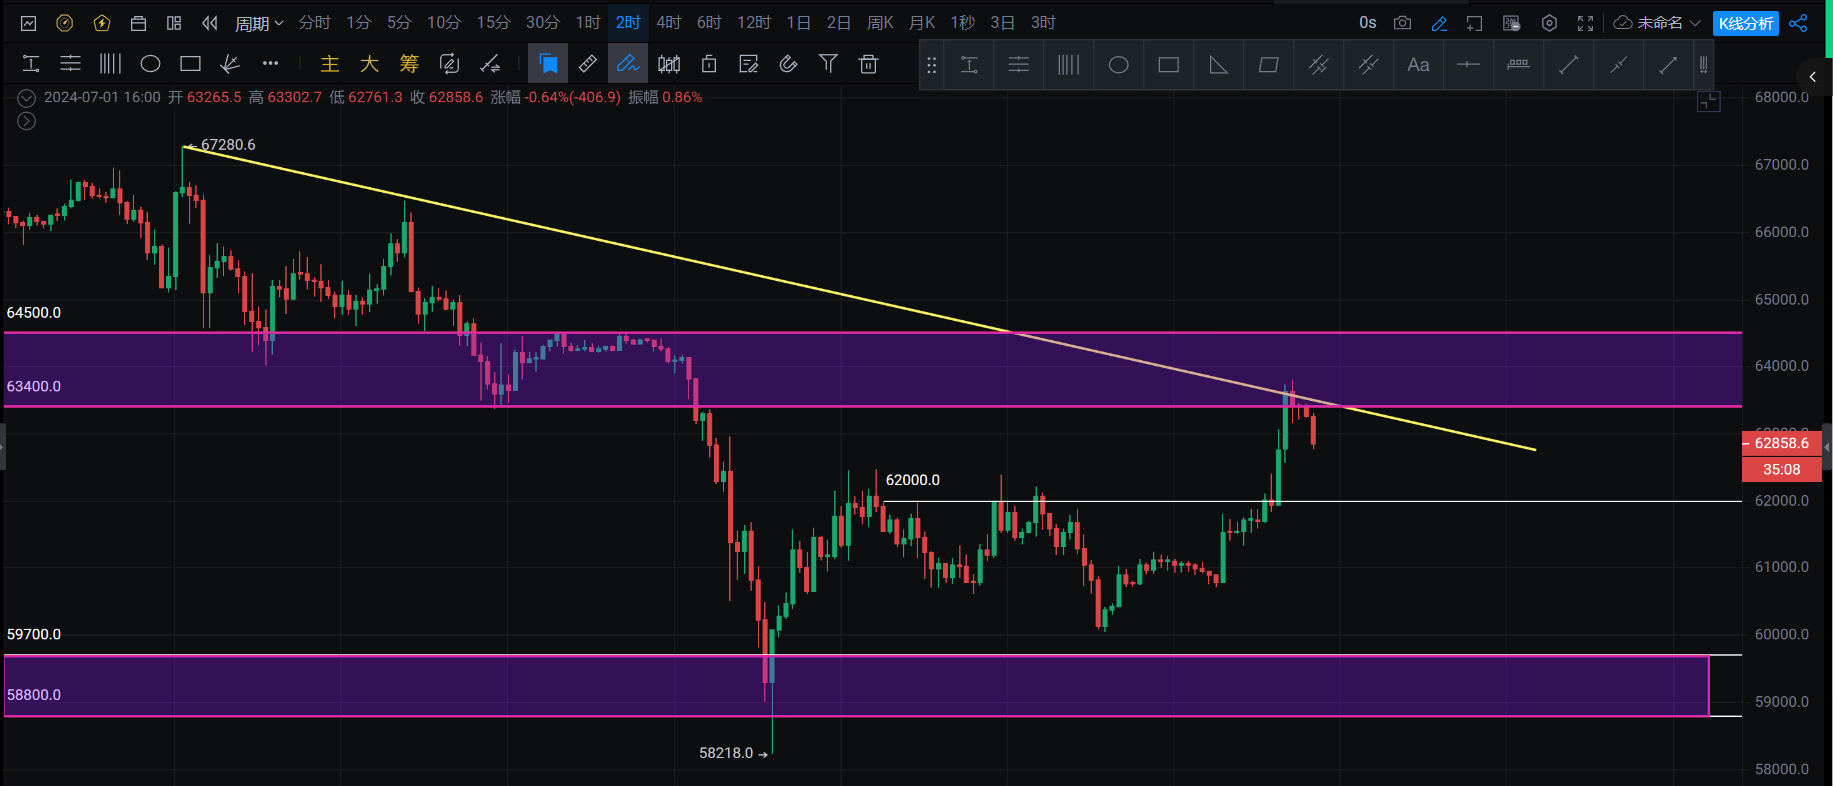
Yesterday's Review: The price rose yesterday to test the resistance zone of 64500-65000, and is currently falling to test the support at 62000. Short positions were entered and profitable yesterday.
Recent Focus: The upper range is 64500-65000, with support at 62000 in the middle. The bottom needs to focus on the support range of 59700-58800.
Structural Form: In the chart, it can be seen that the yellow sloping line was tested above, and the yellow sloping line effectively suppressed the price.
Points to Note: If the price falls to test 62000 and breaks through, it will accelerate the downward movement to test the support range of 59700-58800. Also, pay attention to the top resistance at 64500-65000.
Long Position: If the price falls to the range of 62000-62200 without breaking through, and a bottom pattern signal is given on the 5-minute or 30-minute chart, go long.
Short Position: If the price rebounds in the range of 64500-65000 without breaking through, and a top pattern signal is given on the 5-minute or 30-minute chart, go short.
Key Focus: The price falling below 62000 and the downward acceleration, as well as testing the resistance at 64500-65000.
ETH
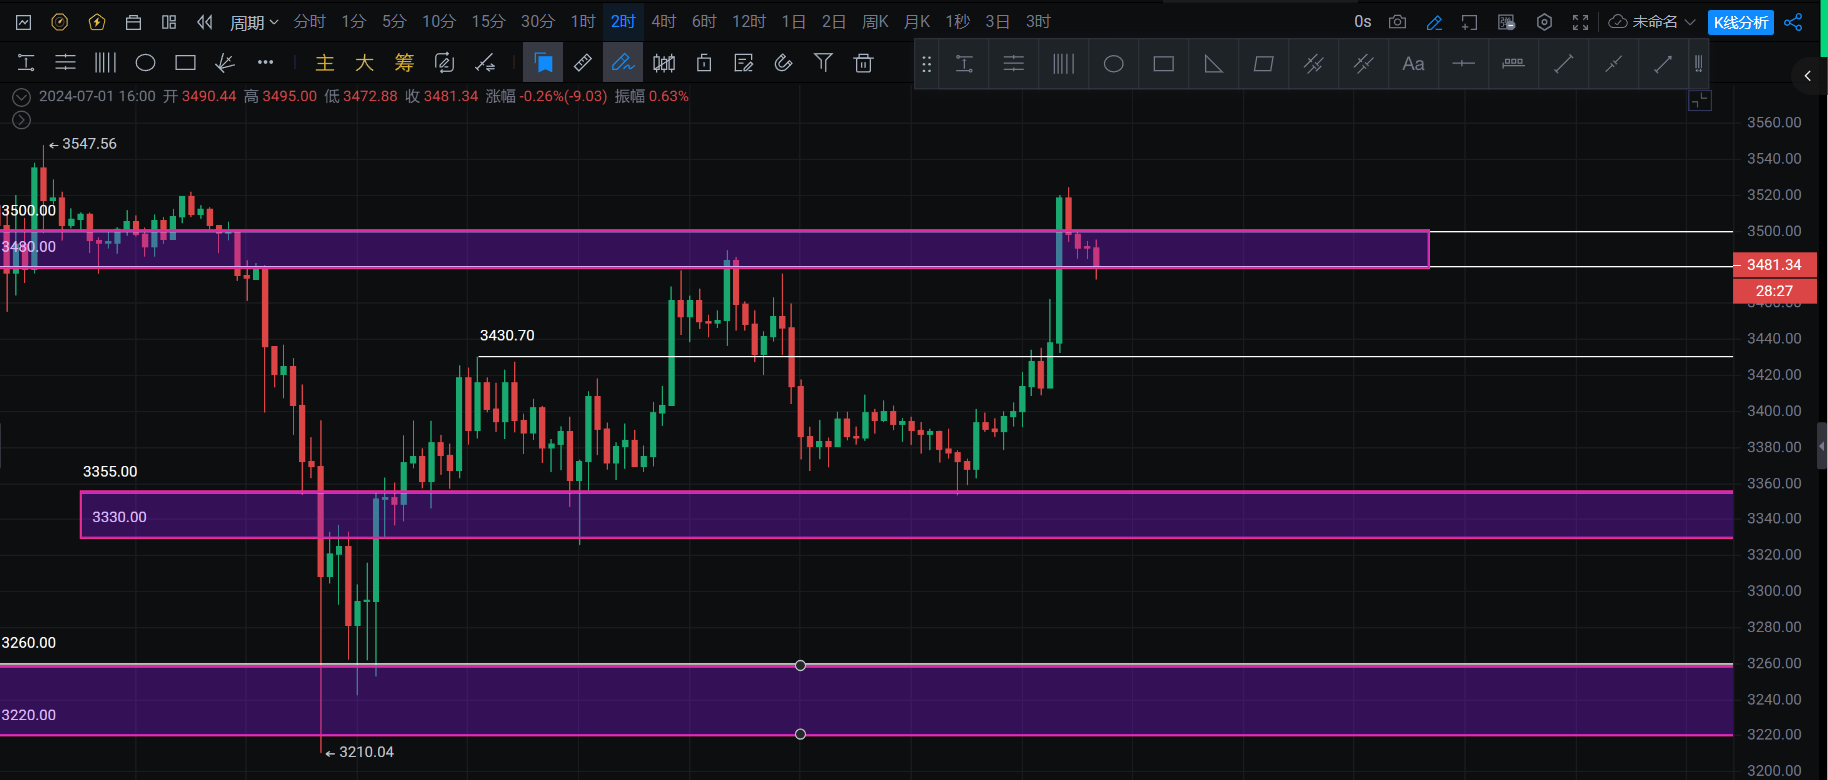
Yesterday's Review: The price rose to 3520 yesterday, and is currently falling to test the support range of 3500-3480.
Recent Focus: The upper range is 3500-3520, with the middle range at 3430-3400, and the lower range at 3355-3330.
Structural Form: In the chart, it can be seen that the support at the neckline of the head and shoulders pattern was effective. After testing the neckline, a strong upward movement occurred.
Points to Note: Pay attention to the top of the head and shoulders neckline at the range of 3355-3330, watch for the acceleration of the downward movement if 3480 is broken, and pay attention to touching the support range of 3355-3330.
Trading Ideas:
Short Position: If the price rebounds in the range of 3500-3530 without breaking through, go short, and if a top pattern signal is given on the 5-minute or 30-minute chart, go short.
Long Position: If the price falls to the range of 3355-3330 without breaking through, and a bottom pattern signal is given on the 5-minute or 30-minute chart, go long.
Long Position: If the price falls to the range of 3260-3220 without breaking through, and a bottom pattern signal is given on the 5-minute or 30-minute chart, go long.
Key Focus: Whether the support at the range of 3355-3330 is effective.
The analysis strategy is time-sensitive, and please refer to the real-time guidance on the official account!
[Friendly Reminder]: The above content is original from Baiqi & Guanyuyu. The advertisements at the end of the article and in the comments section are not related to Baiqi & Guanyuyu. Please discern carefully, and thank you for your appreciation. Investors are welcome to follow the Baiqi & Guanyuyu WeChat official account to learn more about real-time market analysis.

免责声明:本文章仅代表作者个人观点,不代表本平台的立场和观点。本文章仅供信息分享,不构成对任何人的任何投资建议。用户与作者之间的任何争议,与本平台无关。如网页中刊载的文章或图片涉及侵权,请提供相关的权利证明和身份证明发送邮件到support@aicoin.com,本平台相关工作人员将会进行核查。


