This article is exclusively analyzed by Baiqi & Guanyuyu, representing their exclusive viewpoints. They have in-depth research and practical experience in BTC, ETH, and various altcoins. Due to the timing of the article, the following viewpoints and suggestions are not real-time and are for reference only. Readers should bear the risks and indicate the source when reposting. It is important to control positions reasonably, avoid heavy or full positions, and pay attention to more currencies and spot strategies by following the official WeChat account.
BTC
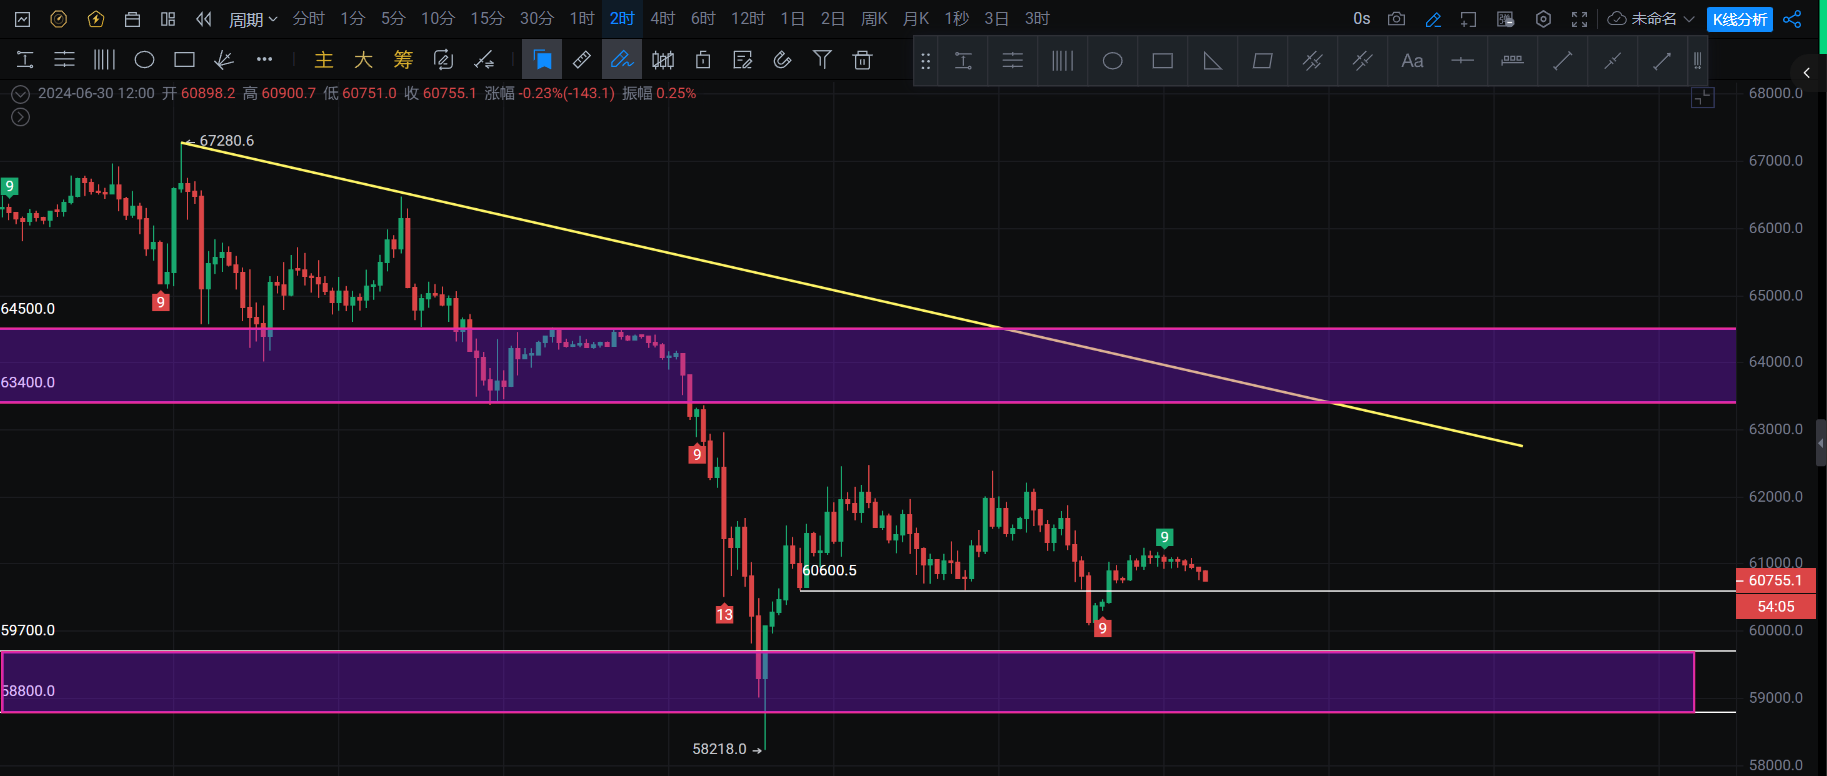
Yesterday's Review: Yesterday, it fell to test the 60000 support, rebounded to 61000. Currently, it is falling back to test the 60600 support.
Recent Focus: The upper range is 64500-65000, with the middle support at 60600. At the bottom, it is necessary to see if the 59700-58800 range can provide effective support.
Structural Form: In the chart, it can be seen that the 62500 level formed a top, and it retraced to the support at 59700-58800.
Points to Note: If the price falls below 60600, pay attention to whether the 59700-58800 range provides effective support. Also, watch for upward testing of the 62500-M top pressure.
Long Position: If the 59700-58800 range retracement does not fall below, and a bottom formation signal is given on the 5-minute or 30-minute chart, consider taking a long position.
Short Position: If the rebound between 62000-62500 does not break through, and a top formation signal is given on the 5-minute or 30-minute chart, consider taking a short position.
Key Focus: Pay attention to the price falling below 60600 and the testing of the 62500 range pressure.
ETH
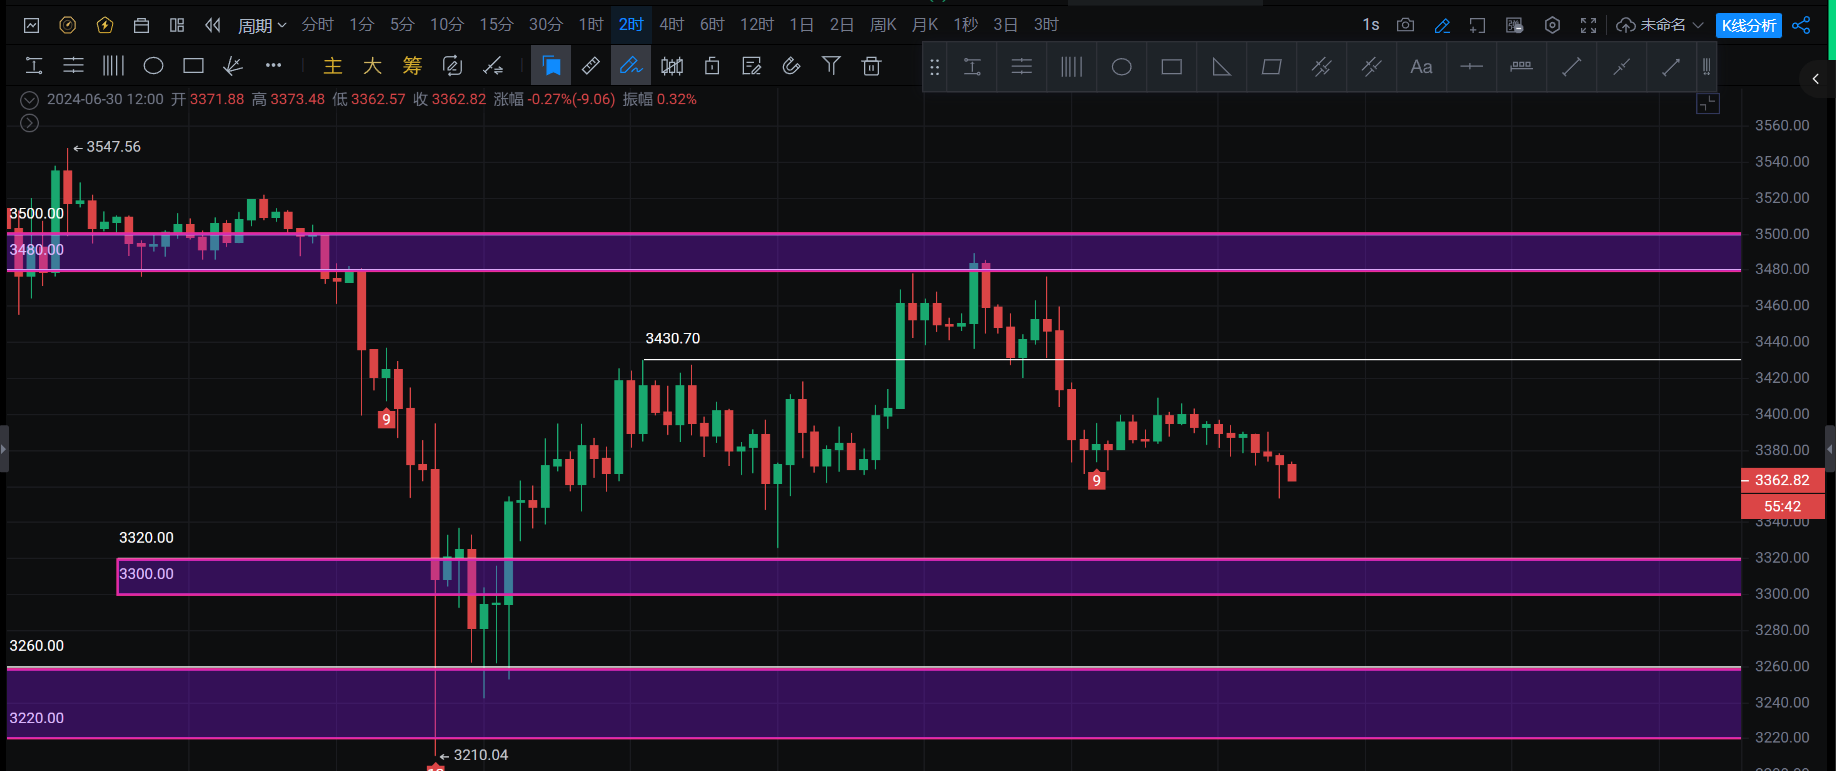
Yesterday's Review: It fell to test the 3355-3330 range and then rebounded, reaching the resistance at 3400 before falling back.
Recent Focus: The upper range is 3460-3480, with the middle at 3350-3330, and the lower range at 3260-3220. It is important to see if the area near 3430 can serve as effective resistance.
Structural Form: In the chart, it can be seen that a head and shoulders pattern has formed at the top.
Points to Note: If the price retraces to the head and shoulders neckline at 3355-3330, pay attention to the breakthrough of 3430 on the upside and the testing of the support range at 3260-3220.
Trading Strategies:
Short Position: If the rebound between 3460-3480 does not break through, and a top formation signal is given on the 5-minute or 30-minute chart, consider taking a short position.
Short Position: If the rebound between 3430-3400 does not break through, and a top formation signal is given on the 5-minute or 30-minute chart, consider taking a short position.
Long Position: If the retracement between 3355-3330 does not fall below, and a bottom formation signal appears on the 5-minute or 30-minute chart, consider taking a long position.
Long Position: If the retracement between 3260-3220 does not fall below, and a bottom formation signal appears on the 5-minute or 30-minute chart, consider taking a long position.
Key Focus: 1: Whether the support range at 3260-3280 is effective. 2: Whether the head and shoulders neckline is broken for an accelerated downward movement.
The analysis strategy is time-sensitive. Please refer to real-time guidance on the official WeChat account!
[Friendly Reminder]: The above content is original by Baiqi & Guanyuyu. The advertisements at the end of the article and in the comments section are unrelated to Baiqi & Guanyuyu. Please discern carefully. Thank you for your appreciation. Investors are welcome to follow the official WeChat account of Baiqi & Guanyuyu to learn more about real-time market analysis.

免责声明:本文章仅代表作者个人观点,不代表本平台的立场和观点。本文章仅供信息分享,不构成对任何人的任何投资建议。用户与作者之间的任何争议,与本平台无关。如网页中刊载的文章或图片涉及侵权,请提供相关的权利证明和身份证明发送邮件到support@aicoin.com,本平台相关工作人员将会进行核查。


