How much upside potential can Ethereum ETF provide?
Author: Andrew Kang
Translation: J1N, Techub News
The approval of the Bitcoin spot ETF has opened the door for many new buyers to enter the cryptocurrency market, allowing them to allocate Bitcoin in their portfolios. However, the impact of the approval of the Ethereum spot ETF is not as obvious.
When the application for the BlackRock Bitcoin spot ETF was submitted, I was strongly bullish on the price of Bitcoin. At that time, the price of Bitcoin was $25,000, and now the return on Bitcoin is 2.6 times, while the return on Ethereum is 2.1 times. From the bottom of the cycle, the return on Bitcoin is 4 times, and the return on Ethereum is also 4 times. So, how much upside potential can the Ethereum ETF provide? I believe that unless Ethereum develops new patterns to improve its economic situation, there won't be much upside potential.
On June 19, 2023, I stated, "The approval rate of the BlackRock Bitcoin spot ETF is as high as 99.8%, which is the most positive news we have heard recently, potentially opening the floodgates for hundreds of billions of dollars in capital flow. However, the price of Bitcoin has only risen by 6%, and the price performance did not meet expectations."
Traffic Analysis
Overall, although the Bitcoin spot ETF has accumulated $50 billion in assets under management, when excluding the pre-existing GBTC assets under management and swaps (selling futures or spot buying spot ETF) to segment the net inflow since its launch, you will get a net inflow of $14.5 billion. However, these are not actual inflows because there are many delta-neutral flows to consider, such as basis trading (selling futures, buying spot ETF) and selling spot to buy spot ETF. By looking at CME data and analyzing ETF holders, I estimate that approximately $4.5 billion in net flow can be attributed to basis trading. ETF experts indicate that large holders like BlockOne have also converted a significant amount of spot Bitcoin into spot ETF, estimated to be around $5 billion. Deducting these flows, we arrive at the true net purchase amount of the Bitcoin spot ETF as $5 billion.
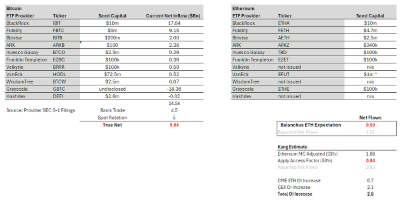
In this way, we can simply infer what the funding flow of Ethereum might be. Bloomberg ETF analyst @EricBalchunas estimates that the Ethereum flow may be 10% of Bitcoin's. This makes the true net purchase flow within 6 months $500 million, with reported net flow of $1.5 billion. Although @EricBalchunas' predictions are not highly accurate, I believe he represents the attitude of many traditional financial institutions.
Personally, I believe that the Ethereum flow may be 15% of Bitcoin's. Starting from the true net purchase amount of $5 billion for Bitcoin (as mentioned above), by adjusting for Ethereum's market cap (33% of Bitcoin's) and a "visitation coefficient" of 0.5, we can arrive at a true net purchase amount of $8.4 billion and a reported net purchase amount of $25.2 billion. There are some reasonable arguments that the premium of ETHE (Grayscale Ethereum Futures ETF) is less than that of GBTC, so I believe the optimistic scenario is a true net purchase amount of $15 billion and a reported net purchase amount of $45 billion. This accounts for approximately 30% of Bitcoin's flow.
In any case, the estimated true net purchase amount of $15 billion for the Ethereum spot ETF is far lower than the current $28 billion inflow of Ethereum derivatives, not including spot front-running (referring to buying spot in anticipation of a market rise). This means that the funding flow before the listing of the Ethereum spot ETF has already exceeded the estimated funding flow of the Ethereum spot ETF to a large extent, so the price of the Ethereum spot ETF has largely been priced by the market.
"Visitation coefficient": Adjusted based on the liquidity achieved by the ETF, considering different holder bases, Bitcoin clearly benefits more than Ethereum. For example, Bitcoin is a macro asset, more attractive to institutions with admission issues (macro funds, pension funds, endowments, sovereign wealth funds). Ethereum, on the other hand, is more like a technical asset, more attractive to institutions with less strict restrictions on cryptocurrency admission, such as VCs, cryptocurrency funds, technical experts, and retail investors. The 50% figure is derived from comparing the CME OI (Open Interest, derivative open interest) to market cap ratio of Ethereum and Bitcoin.
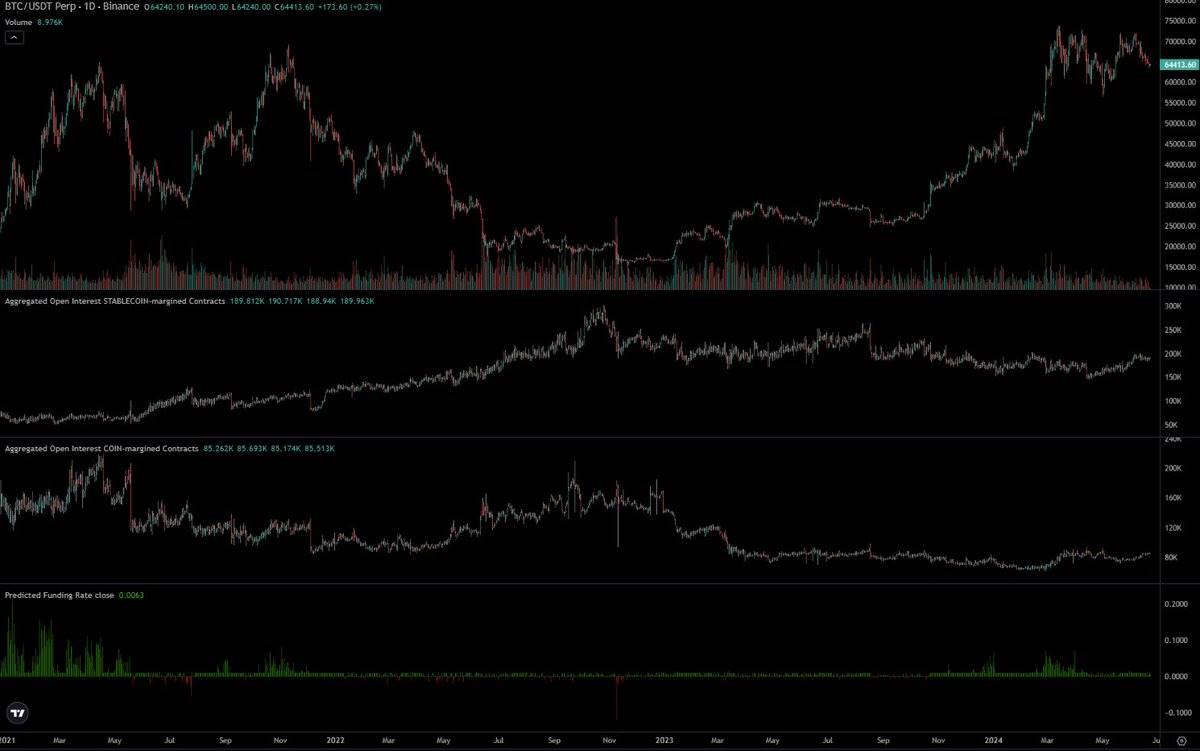
Looking at CME data, before the launch of the Ethereum spot ETF, the OI of Ethereum was significantly lower than that of Bitcoin. The OI represents approximately 0.3% of the supply for Ethereum, while it is 0.6% for Bitcoin. Initially, I thought this was an early sign, but it could also be said that this masked the lack of interest from traditional financial funds in the Ethereum ETF. Wall Street traders tend to trade Bitcoin spot ETFs and often have first-hand information, so if they are not using the same trading method for Ethereum, there must be good reason, possibly indicating insufficient information about Ethereum liquidity.
How did $50 billion push Bitcoin from $40,000 to $65,000?
The most direct and clear answer is that $50 billion alone cannot achieve this, because there are many other buyers in the spot market. Bitcoin is a truly recognized key investment portfolio asset globally and is held long-term by many large institutions such as Saylor, Tether, family offices, and high-net-worth individual investors. Although Ethereum also has large institutional holdings, I believe the magnitude is lower than that of Bitcoin.
Remember, before the launch of the Bitcoin spot ETF, the highest price of Bitcoin had already reached $69,000, with a market value of over $1.2 trillion. Market participants and institutions hold a large amount of spot cryptocurrencies. Coinbase holds $193 billion, with over $100 billion from other institutions. In 2021, Bitgo reported an AUC of $60 billion, and Binance holds over $100 billion. Six months later, the Bitcoin spot ETF held 4% of the total Bitcoin supply.
On February 12, I tweeted about the scale of the cryptocurrency market, stating, "I estimate that the long-term demand for Bitcoin this year is over $40-130 billion. One of the most common mistakes made by cryptocurrency investors is underestimating the world's wealth, people's income, the liquidity of funds, and their impact on cryptocurrencies. We often hear statistics about the market value of gold, stocks, and real estate, to the point where cryptocurrencies may be overlooked by many. Many cryptocurrency practitioners are trapped in their own limited thinking, but the more you travel and meet other entrepreneurs, high-net-worth individuals, etc., the more you realize how unimaginable the amount of dollars in the world is, and how much of it can enter Bitcoin or other cryptocurrencies.
Let me explain this point through a rough exercise in demand scale. The average household income in the United States is $105,000. There are 124 million households in the United States, which means the annual total income of individuals in the United States is $13 trillion. The United States accounts for 25% of the GDP, so the global total income is approximately $52 trillion. The global average cryptocurrency ownership rate is 10%. In the United States, this ratio is approximately 15%, and in the UAE, it is as high as 25-30%. Assuming cryptocurrency owners allocate only 1% of their income annually, the annual cost of purchasing BTC is $520 billion, or $1.5 billion per day."
At the time of the launch of the Bitcoin spot ETF, MSTR (Microstrategy) and Tether purchased billions of dollars of Bitcoin, as well as investors who entered the market at that time, and their holding costs were also at a low level. At that time, people generally believed that the approval of the Bitcoin spot ETF was a signal to sell. Therefore, billions of dollars of short-term, medium-term, and long-term positions were sold and needed to be repurchased. Most importantly, once the flow of the Bitcoin spot ETF formed a significant upward trend, the shorts needed to cover. Before the launch of the Bitcoin spot ETF, the open interest contracts actually decreased, which was crazy.
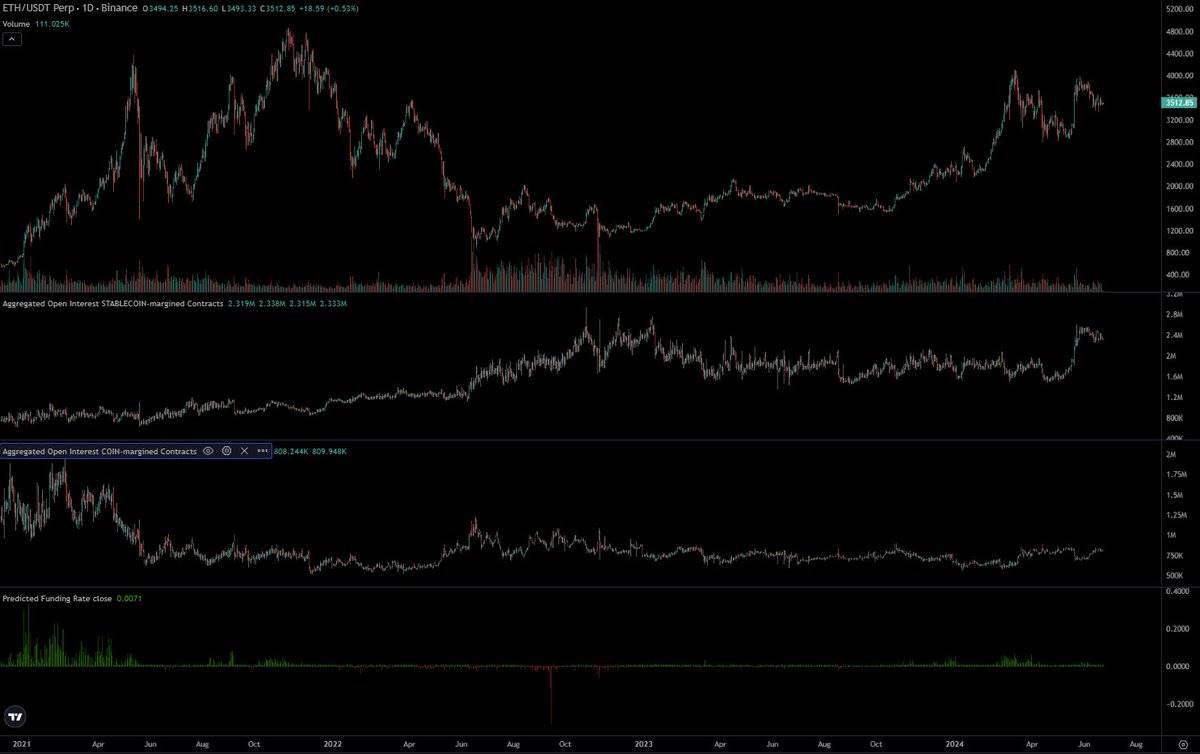
The positioning of the Ethereum spot ETF is very different. The price of Ethereum is now 4 times higher than the low point before the spot ETF was launched, while Bitcoin is 2.75 times higher. The native cryptocurrency CEX OI has increased by $2.1 billion, bringing the OI close to ATH (all-time high) levels. The market is efficient. Of course, many native cryptocurrency holders saw the success of the Bitcoin spot ETF and have similar expectations for Ethereum, positioning it accordingly.
Personally, I believe that the expectations of native cryptocurrency users have been exaggerated and are disconnected from the real preferences of the traditional financial market. This leads to a relatively higher psychological share and purchase volume of Ethereum for those deeply involved in the cryptocurrency space. In reality, the purchase volume of Ethereum as a key investment portfolio allocation is much lower for many large non-native capital groups.
One of the most common promotions in traditional finance is that Ethereum is a "technology asset." It powers global computers, Web3 app stores, decentralized financial settlement layers, and more. This is a good promotion, and I bought into it in the previous cycle, but it's hard to accept when you look at actual returns.
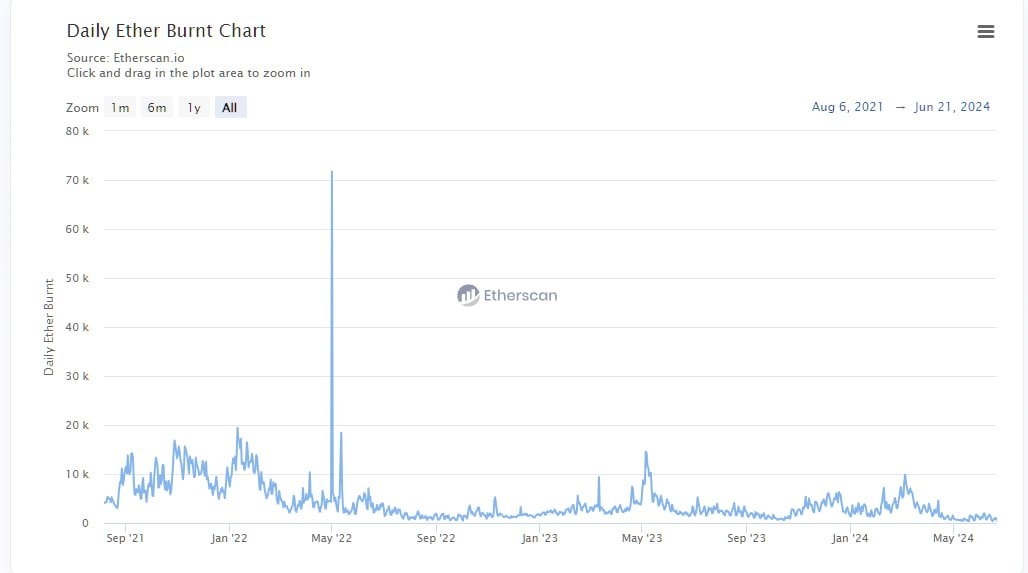
In the previous cycle, you could point to the growth rate of fees and argue that DeFi and NFTs would generate more fees, cash flow, etc., and present a convincing case for it as a technology investment from a perspective similar to tech stocks. But in this cycle, the quantification of fees is the opposite. Most charts show flat or negative growth. Ethereum is an ATM, generating $1.5 billion in 30 days based on its annualized rate, with a P/E ratio of 300, and a negative P/E ratio after factoring in inflation. How will analysts prove to their family offices or macro fund bosses that this price is reasonable?
I even expect that the "fugazi" (usually referring to large trading volume that doesn't actually result from real fund inflows) flow in the past few weeks will be lower for two reasons. First, the unexpected approval of the Ethereum spot ETF didn't give issuers much time to convince large holders to convert their Ethereum into spot ETF form. Second, the attractiveness of the conversion is lower because holders would need to give up staking or the yield on Ethereum in DeFi. However, it's worth noting that the current staking rate for Ethereum is only 25%.
Does this mean Ethereum will go to zero? Of course not. At some price, it will be considered a good value, and it may not necessarily rise with Bitcoin in the future. Before the spot ETF was launched, I expected Ethereum's trading price to be between $3,000 and $3,800. After the spot ETF launch, my expectation is $2,400 to $3,000. However, if Bitcoin rises to $100,000 in Q4 2024 or Q1 2025, this could potentially push Ethereum's price above ATH, but Ethereum may decline after Bitcoin. In the long run, there are some developments to look forward to, and you have to believe that BlackRock and Fink are doing a lot of related work, building some financial infrastructure on the blockchain, and tokenizing more assets. The value this can bring to Ethereum, and the specific timing, is still uncertain.
I expect Ethereum to continue its downward trend compared to Bitcoin, with a ratio between 0.035 and 0.06 in the next year. Although our sample size is small, we do see Ethereum hitting lower highs in each cycle, so this should not be surprising.
免责声明:本文章仅代表作者个人观点,不代表本平台的立场和观点。本文章仅供信息分享,不构成对任何人的任何投资建议。用户与作者之间的任何争议,与本平台无关。如网页中刊载的文章或图片涉及侵权,请提供相关的权利证明和身份证明发送邮件到support@aicoin.com,本平台相关工作人员将会进行核查。


