The U.S. Securities and Exchange Commission (SEC) approved the 19B-4 trading rule change for 8 Ethereum spot ETFs on May 24, marking an important step towards the listing of Ethereum spot ETFs. The market is closely watching for when the SEC will approve the S-1 registration statement for formal listing.
Bloomberg ETF analysts announced yesterday that the launch date of the Ethereum spot ETF has been brought forward to July 2, following favorable news that the S1 filing is expected to be approved. This advancement in the Ethereum spot ETF launch schedule brings greater accuracy, leading to a rapid rebound in the price of ETH from $3360. Currently, the Ethereum price is at a low level, with a majority of short positions, and bullish sentiment being suppressed, with implied volatility lower than actual volatility. Next, let's take a look at the intraday trend of Ethereum.
Ethereum four-hour chart
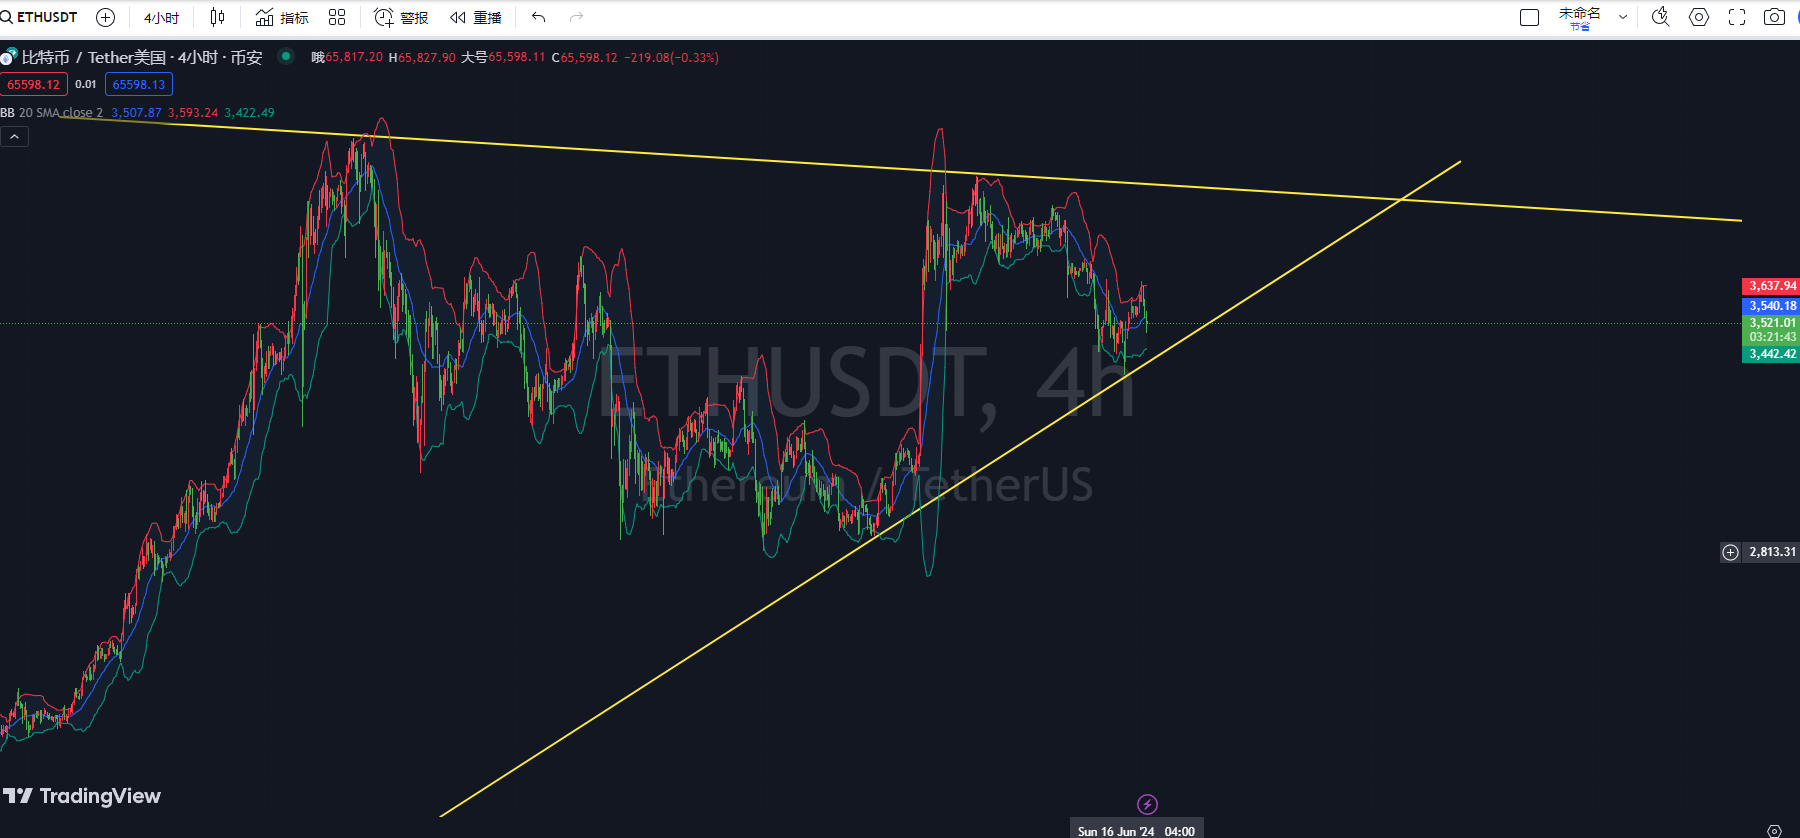
According to the MACD indicator on the 4-hour chart, the DIF line is above the DEA line, and the MACD histogram is positive, indicating the current trend is upward. However, it is important to note that the MACD histogram is showing a decreasing trend, which may indicate a weakening upward momentum.
According to the KDJ indicator on the 4-hour chart, both the K line and the D line are below 50, especially with the J line close to 0, indicating that the market is oversold and there is a possibility of a rebound. However, the current K line and D line are in a dead cross state (K line below D line), indicating that there is still downward pressure on the price in the short term.
According to the Bollinger Bands indicator on the 4-hour chart, the current Ethereum price is between the middle band and the lower band of the Bollinger Bands, with a trend of touching the lower band downwards, indicating that the price may continue to decline in the short term. If the price falls below the lower band and continues to decline, it may further test the support level.
Comprehensive analysis: Based on the analysis of MACD and KDJ, Ethereum may face some downward pressure in the short term, especially with the oversold state indicated by the KDJ indicator and the weakening of the MACD histogram, suggesting that the price may continue to decline first. With the KDJ indicator in an oversold state, once a golden cross of the K line and D line occurs, there may be an opportunity for a rebound. Pay attention to the support strength of the lower Bollinger Band. If the price is supported near the lower band (3441) and rebounds, it may return to the middle band at 3538.
In summary, the following suggestions are provided for reference:
Suggestion 1: Short near 3520, target 3440, stop loss at 3550.
Suggestion 2: Long near 3440, target 3550, stop loss at 3400.
Instead of giving you a 100% accurate suggestion, it's better to provide you with the correct mindset and trend, after all, teaching someone to fish is better than giving them a fish. The focus is on the mindset, grasping the trend, and planning for market layout and position. What I can do is to provide assistance based on my practical experience, guiding your investment decisions and management in the right direction.
Drafting time: (2024-06-17, 20:10)

(By - Coin Master) Disclaimer: The publication on the internet may have a delay, and the above suggestions are for reference only. The author is dedicated to research and analysis in the investment fields of Bitcoin, Ethereum, altcoins, foreign exchange, stocks, and has been involved in the financial market for many years, possessing rich experience in actual trading operations. Investment involves risks, so caution is advised when entering the market.
免责声明:本文章仅代表作者个人观点,不代表本平台的立场和观点。本文章仅供信息分享,不构成对任何人的任何投资建议。用户与作者之间的任何争议,与本平台无关。如网页中刊载的文章或图片涉及侵权,请提供相关的权利证明和身份证明发送邮件到support@aicoin.com,本平台相关工作人员将会进行核查。


