This article is exclusively analyzed by Baiqi & Guanyuyu, representing the exclusive viewpoints of Baiqi & Guanyuyu. They have in-depth research and practical experience in BTC, ETH, and various altcoins. Due to the timing of the article, the following viewpoints and suggestions are not real-time and are for reference only. Please bear the risk responsibly. When reposting, please indicate the source. Reasonably control the position of the order and avoid heavy or full position operations.
BTC
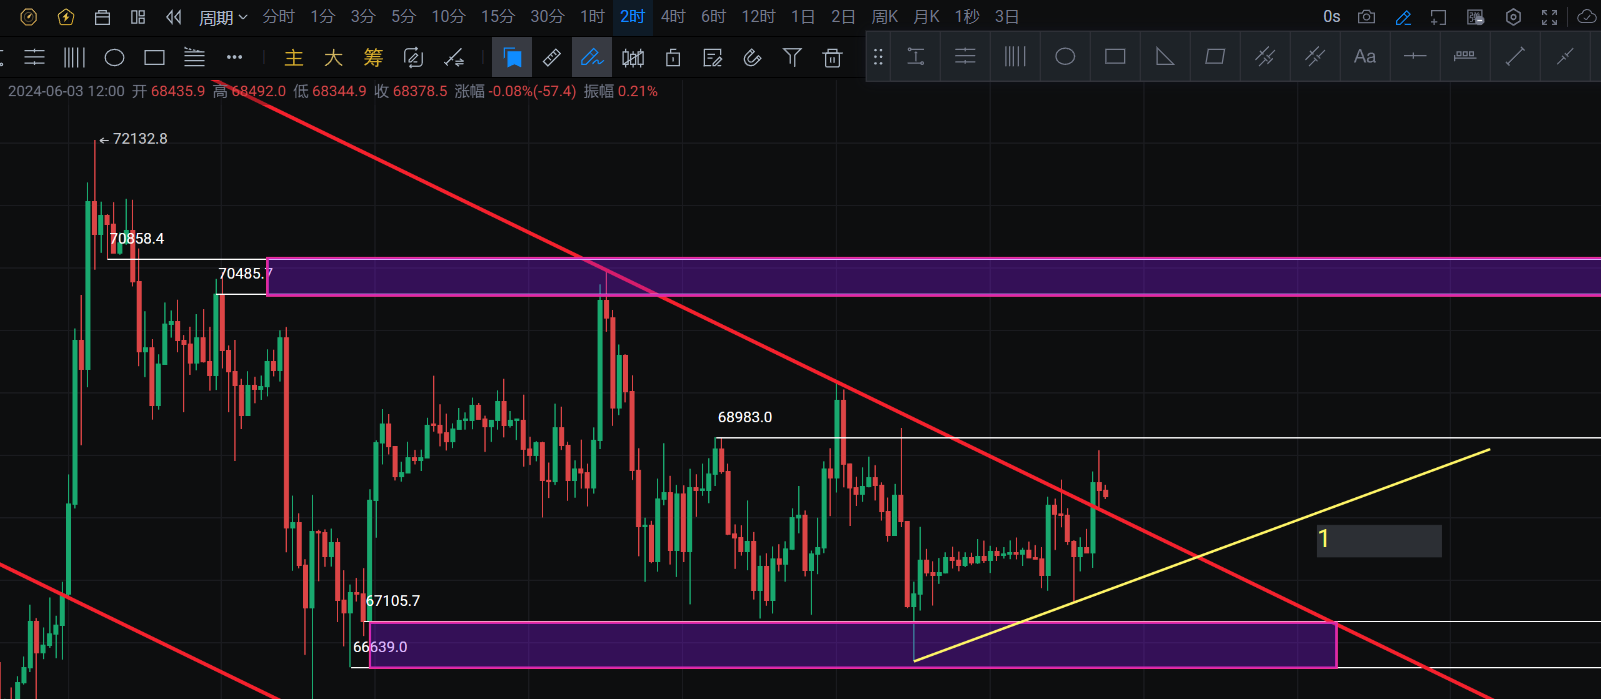
Recent focus: The range above is 70850-70450, and the range below is 67100-66600. It is necessary to pay attention to whether the high point of 69000 can effectively suppress.
Structural form: The red price channel line in the chart has been broken, and the upward slope line yellow line 1 is given. The white price line range is the pressure and support range.
Points to note: When the price retraces to the upward slope line yellow line 1 in the chart, pay attention to whether the slope line is effective. Also, pay attention to the acceleration market after the support of the downward slope line yellow line 1 and the white price line range is broken.
Trading ideas:
Long position: Rebound without breaking through the range of 67100-66600, and go long when a bottom form signal appears on the 5-minute or 30-minute chart.
Short position: Go short if the rebound near the 69000 level does not break through, and go short when a top form signal appears on the 5-minute or 30-minute chart.
Short position: Go short if the rebound in the range of 70850-70450 does not break through, and go short when a top form signal appears on the 5-minute or 30-minute chart.
Key focus: The breakthrough of the white price line of 69000 in the chart will trigger an acceleration market and touch the range of 70850-70450.
ETH
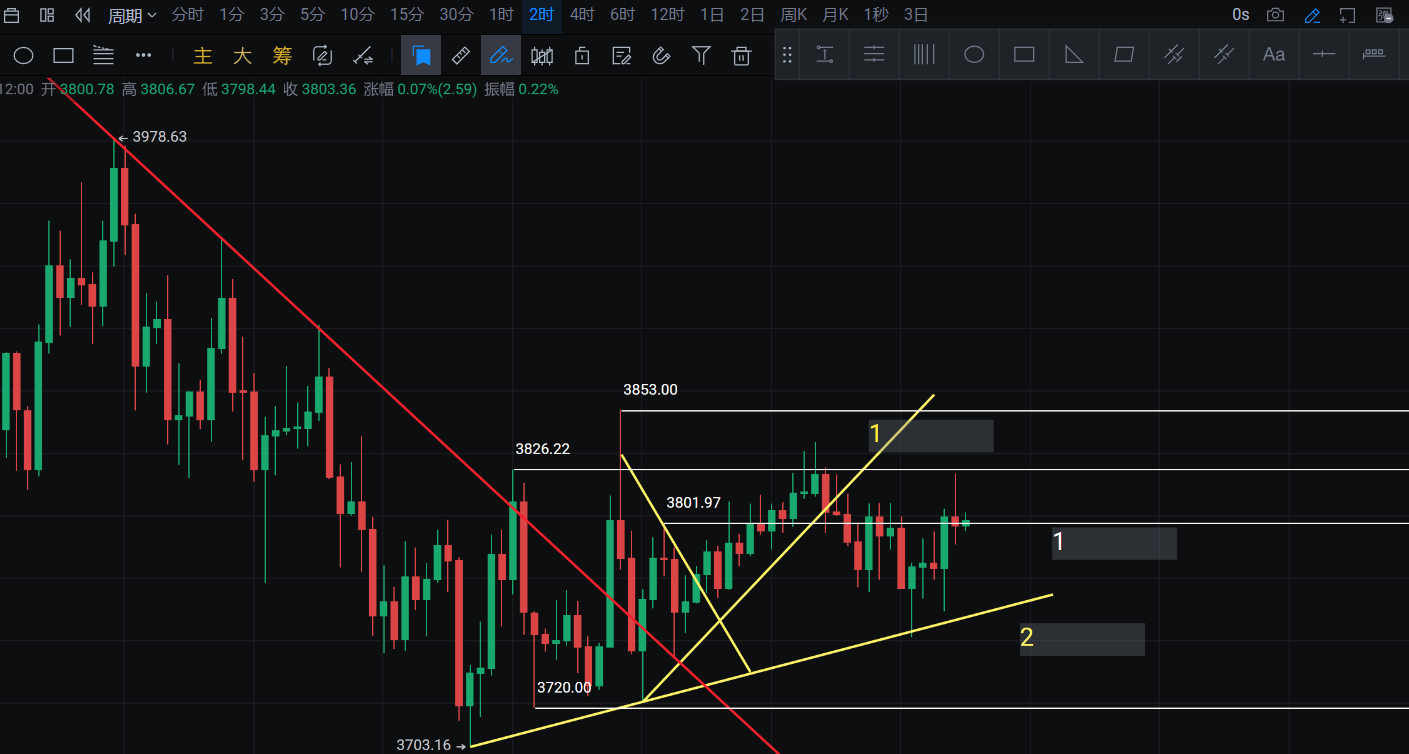
Recent focus: The range above is 3820-3860, and the range below is 3720-3700.
Structural form: The red slope line in the chart has been broken, and a bottom form is given. The yellow slope line 1 in the chart is broken, and successfully retraced to the yellow slope line 2.
Yellow slope line 2 forms a flat top converging triangle with the pressure range above.
Points to note: The flat top converging triangle formed by the yellow slope line 2 and the pressure range above, pay attention to the acceleration market after the triangle is broken, and the retracement neckline position.
Trading ideas:
Long position: Rebound without breaking through the range of 3720-3700, and go long when a bottom form signal appears on the 5-minute or 30-minute chart.
Short position: Go short if the rebound in the range of 3820-3860 does not break through, and go short when a top form signal appears on the 5-minute or 30-minute chart.
Key focus: Whether the support of the yellow slope line 2 is effective, the acceleration market after the flat top converging triangle is broken, and the retracement neckline position.
Whether the white line 1, 3800 support is effective. Whether the white price line 3853 above can serve as an effective suppression.
The analysis strategy is time-sensitive, please refer to the real-time guidance on the official WeChat account!
[Friendly reminder]: The above content is original by Baiqi & Guanyuyu. The advertisements at the end of the article and in the comment section are not related to Baiqi & Guanyuyu. Please discern carefully, thank you for your appreciation. Investors are welcome to follow the WeChat public account of Baiqi & Guanyuyu to learn more about real-time market analysis.

免责声明:本文章仅代表作者个人观点,不代表本平台的立场和观点。本文章仅供信息分享,不构成对任何人的任何投资建议。用户与作者之间的任何争议,与本平台无关。如网页中刊载的文章或图片涉及侵权,请提供相关的权利证明和身份证明发送邮件到support@aicoin.com,本平台相关工作人员将会进行核查。


