"Livermore once said: Excellent investors are always waiting, always patient, waiting for the market to confirm their judgment. Remember, do not completely believe in your own judgment until the market itself confirms your view."
BTC 4-hour chart
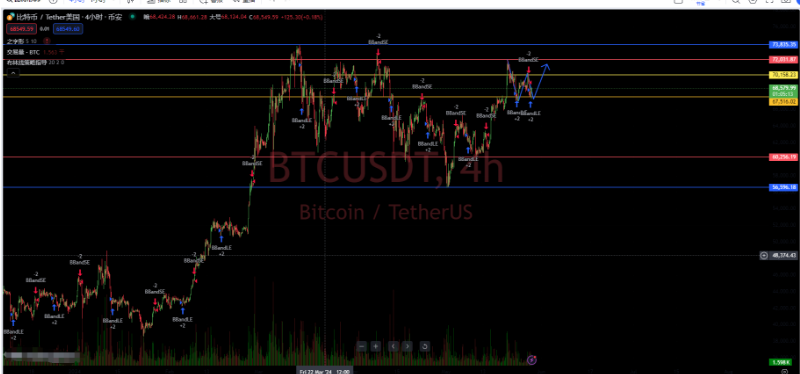
4H MACD: From the 4-hour chart, we can see that the current DIF line and DEA line are both below the zero axis, and the DIF line is running downward, indicating a downward trend. The green histogram shows strong bearish momentum.
4H KDJ: Currently, the KDJ indicator shows that both the K line value and the D line value are hovering around 50, and the J line value is below 30, close to oversold territory. Although it shows a weak state, it is important to pay attention to any signs of a rebound.
4H MA: The 7MA has started to turn downward and is expected to approach the 30MA. If the 7MA crosses below the 30MA, it will form a death cross structure, indicating a risk of further decline.
4H BOLL: The current price of BTC is close to the middle track of the Bollinger Bands (68580). The upper and lower bands of the Bollinger Bands are narrowing, indicating a decrease in price volatility. It is necessary to pay attention to whether it will break through the middle track and move up and down.
BTC 1-hour chart
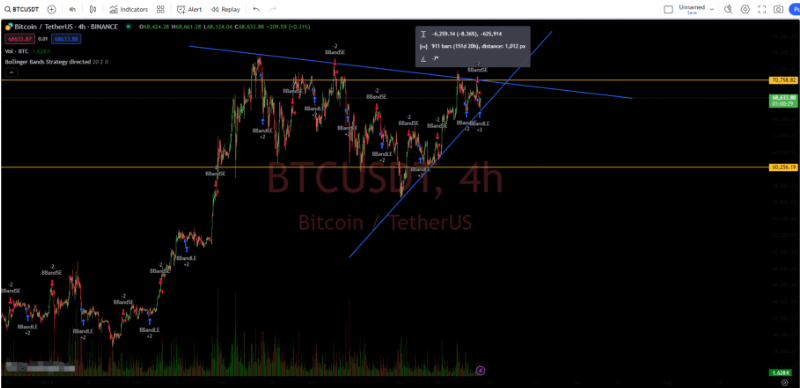
1H MACD: In the current 1-hour chart, the DIF line of the MACD is below the DEA line, and both are below the zero axis. The red histogram is getting longer, indicating a weakening selling pressure and signs of a rebound.
1H KDJ: The current K line value and D line value are both at low levels, but the J line value has started to rebound, showing signs of moving towards a golden cross, indicating a short-term opportunity for a rebound.
1H MA: The 7MA is currently below the 30MA, indicating a bearish trend in the short term. However, the 7MA moving average has an upward trend, possibly approaching the 30MA and forming a golden cross.
1H BOLL: Currently, the price of BTC is below the middle track of the Bollinger Bands, close to the lower track, indicating an oversold condition and the possibility of a rebound at any time.
Comprehensive analysis: From the KDJ and BOLL indicators, the price is close to the lower track of the Bollinger Bands, and the J line of the KDJ shows signs of a rebound, indicating a possible short-term rebound. The trend shown by the MACD indicator is still bearish, and the price has not yet crossed the 7MA and 30MA moving averages. Therefore, unless there is a clear reversal signal, long-term caution is still needed.
In summary, the following suggestions are provided for reference by the expert:
Long position at the 68300-68500 level for Bitcoin, with a target towards 70160 and a defensive position at 67650. (The above points are all at the time of writing.)
Instead of giving you a 100% accurate suggestion, it's better to give you the correct mindset and trend, after all, teaching someone to fish is better than giving them a fish. The suggestion is to earn for a moment, but learning the mindset to earn for a lifetime! Emphasize the mindset, grasp the trend, and plan the layout and position of the market. What I can do is to use my practical experience to help everyone make investment decisions and manage operations in the right direction.
Writing time: (2024-05-29, 06:00)

(By - Da Xian Shuo Bi) Special statement: The publication on the internet has a delay, and the above suggestions are for reference only. The author is committed to research and analysis in the investment fields of Bitcoin, Ethereum, altcoins, foreign exchange, gold, stocks, and has been involved in the financial market for many years, with rich experience in actual trading. Investment involves risks, so entry into the market should be cautious. For more real-time market analysis, please follow Da Xian Shuo Bi for discussion and exchange.
免责声明:本文章仅代表作者个人观点,不代表本平台的立场和观点。本文章仅供信息分享,不构成对任何人的任何投资建议。用户与作者之间的任何争议,与本平台无关。如网页中刊载的文章或图片涉及侵权,请提供相关的权利证明和身份证明发送邮件到support@aicoin.com,本平台相关工作人员将会进行核查。


