Market Analysis
When the water is full, it overflows; when the moon is full, it wanes; self-satisfaction leads to failure, and self-conceit leads to foolishness. Those who evade reality will have a less than ideal future. In the market, only the strong maintain their elegance. Going against the tide has become the norm. When many people are bearish, a bull market may be imminent. The rapid switch between bull and bear always catches people off guard. The shift in strength happens in an instant.
Market Review

In yesterday's article, the expert suggested a long position at the 68300 level. After a day of fluctuation and consolidation, Bitcoin reached the high point of 70700 in the early hours of today, successfully gaining a profit of over 2000 points.
Bitcoin Four-hour Chart
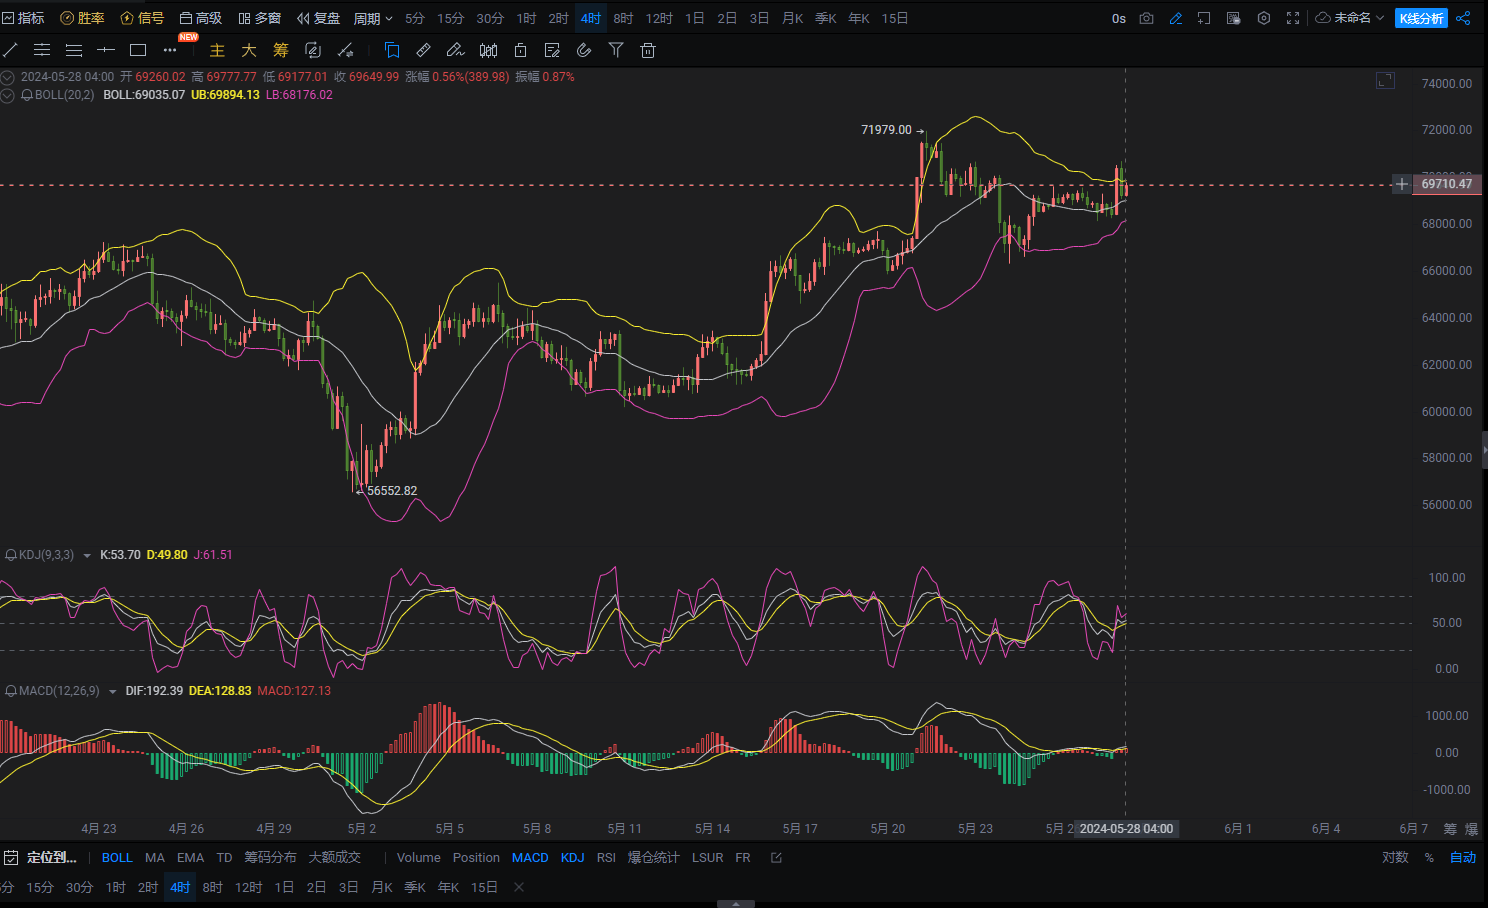
4H MACD: The DIF line and DEA line are above the zero axis and show signs of becoming parallel. The red MACD histogram has shortened, indicating a weakening upward momentum for Bitcoin, with the possibility of a market correction or consolidation.
4H KDJ: Both the K line and D line values are near 50, and the J line value is slightly higher but does not show clear overbought or oversold signals, indicating that the current price is in a neutral state with no clear direction.
4H Bollinger Bands: The current price of Bitcoin is fluctuating near the midline of the Bollinger Bands (69669), and the Bollinger Bands channel is wide open, indicating that the price of Bitcoin will experience increased volatility. If the price breaks through the upper band, it will further rise; if it falls below the lower band, there will be a pullback.
Bitcoin One-hour Chart
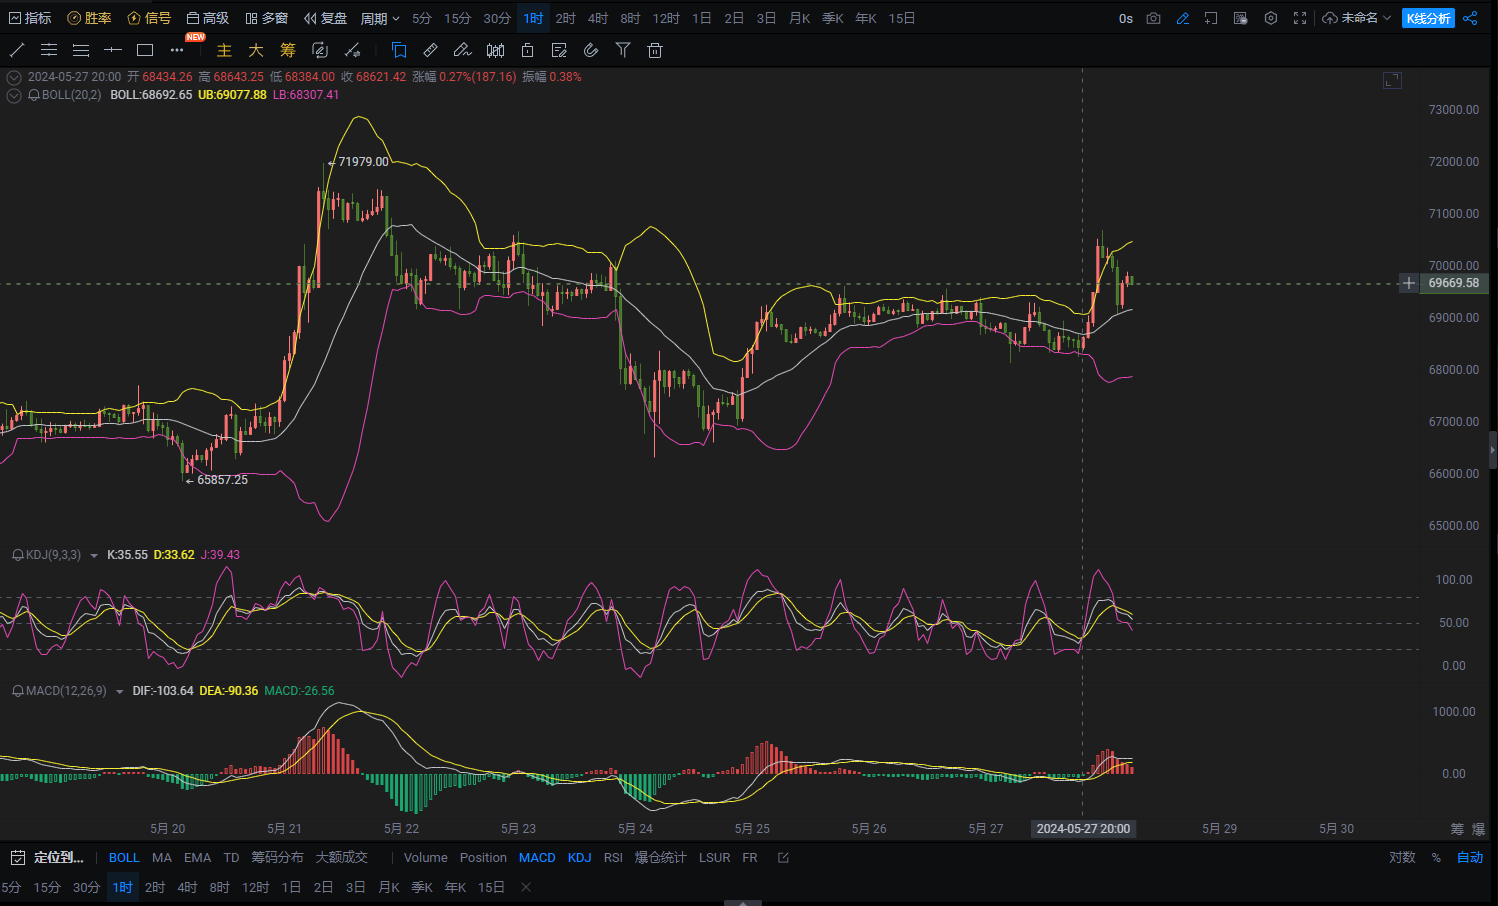
1H MACD: The current DIF line is above the DEA line and shows signs of starting to become parallel or even crossing. The red MACD histogram is shrinking, indicating a weakening upward momentum for Bitcoin and the need to be cautious about a short-term pullback.
1H KDJ: The values of the K, D, and J lines are currently below 50, and the K and D line values are trending downward, indicating that the current price is leaning towards oversold territory and will face downward pressure in the short term.
1H Bollinger Bands: The current price of Bitcoin is oscillating near the midline, and the upper and lower bands are narrowing, indicating that the price may consolidate near the midline. If it breaks through the upper band, the price will further rise; if it falls below the lower band, there will be a further pullback.
Comprehensive Analysis: The current price of Bitcoin may face short-term downward pressure, but the overall trend is still unclear. The price may consolidate near the midline of the Bollinger Bands. If it breaks through the upper band, it is expected to continue rising; if it falls below the lower band, there is a risk of further pullback.
In conclusion, the expert does not provide specific position strategies today, but suggests relying on the following support and resistance levels for long and short positions:
Resistance: 70500
Support: 67900
Instead of giving you a 100% accurate recommendation, it's better to provide you with the correct mindset and trend. After all, teaching someone to fish is better than giving them a fish. The focus is on mindset, grasping the trend, and planning positions in the market. What I can do is to use my practical experience to help you make investment decisions and manage your operations in the right direction.
Drafting time: (2024-05-28, 06:00)

(By - Coin Expert) Disclaimer: Online postings have a delay, and the above suggestions are for reference only. The author is dedicated to research and analysis in the investment fields of Bitcoin, Ethereum, altcoins, forex, and stocks, with years of experience in the financial markets. Investment involves risks, so caution is advised when entering the market. For more real-time market analysis, please follow Coin Expert for discussions and exchanges.
免责声明:本文章仅代表作者个人观点,不代表本平台的立场和观点。本文章仅供信息分享,不构成对任何人的任何投资建议。用户与作者之间的任何争议,与本平台无关。如网页中刊载的文章或图片涉及侵权,请提供相关的权利证明和身份证明发送邮件到support@aicoin.com,本平台相关工作人员将会进行核查。


