PRO Version K-Line - Professional Trading Guide
Welcome to use AICoin PRO Version K-Line! This is tailored for professional traders to reveal deep market opportunities, help you grasp market dynamics, and discover the code to wealth.
Here, you can enjoy the following features:
Master the Dynamics of Main Force - Insight into large order dynamics, accurately track market trends.
Comprehensive Depth Chart - Advanced support and resistance analysis, insight into market strength comparison.
Interpretation of Chip Distribution - Insight into distribution and absorption of chips, deconstruct market trends.
Unique Contract Data - Precisely understand position liquidation data, optimize contract trading strategies.
Customized Timeframes - Professional analysis breaking limitations, revealing hidden market trends.
Second-level Market Pulse - Ultra-fast data updates, capturing every opportunity.
Advanced Combination K-Line Tools - Fine-grained arbitrage analysis, multi-strategy combination application.
Multi-window Layout on the Same Screen - Personalized multi-screen settings, freely switch between 9 layouts.
Intelligent Fund Flow - Innovative algorithm filters impurities, insight into real fund flows.
Direct Access to Specific Historical Dates - Efficient retrieval tool, precise positioning of historical nodes.
Enhanced Index Applications - Expand analysis boundaries, freely add optional and auxiliary chart indicators.
Most Comprehensive Historical Data Resources - Data depth tracing back to 2011, meticulous support for 1-second level data.
Exclusive Alerts - Real-time push of market dynamics, policy changes, industry information, not to miss important information.
Smart K-Line Analysis by Xiao A - Predict market trends with multiple indicators, provide buy and sell signals and position advice.
Detailed Explanation of PRO Version K-Line Features
Main Force Large Orders
Main Force Large Orders (AICoin Whale Orders) is independently developed by the AI team, based on order book data, to monitor the real-time status of large orders, helping investors grasp trading opportunities.
For example:
Through main force large orders, you can observe and judge the strength and direction of the main force, such as order amount, order duration, transaction situation, and position changes; measure and compare the intentions and behaviors of the main force, such as buy order volume, sell order volume, order difference, transaction difference, buy average price, sell average price, buy count, sell count, etc.
How to Judge the Main Force Direction with Main Force Large Orders?
[Length] The longer the horizontal line, the longer the order duration; the shorter the horizontal line, the shorter the order duration.
[Thickness] The thicker the horizontal line, the larger the order amount; the thinner the horizontal line, the smaller the order amount.
[Depth] Dark color indicates a transaction, light color indicates no transaction. Red represents sell orders, green represents buy orders.
(The larger the order amount, the stronger the manipulation power of the main force).

(Perpetual BTC/USDT, 5 minutes) There were two waves of main force large order chip changes from 12:00 to 22:00 on February 1, 2024.
First wave: At $41920, there was a $6.3 million super large order buy, with $6.3 million in transactions; at $42285.5, there was a $4.4 million large order sell, with $4.4 million in transactions. Trading based on main force large orders yielded approximately 0.87% in this wave.
Second wave: At $42000, there was an $8.4677 million super large order buy, with $7.7375 million in transactions (91.38%); at $42549, there was a $4.2608 million large order sell, with $4.1284 million in transactions (96.89%). Trading based on main force large orders yielded approximately 1.3% in this wave.
Advanced content (Main Force + Open Interest Indicator):
(1) In the case of increasing open interest: the appearance of large sell orders may indicate opening short positions, which may be a good selling point at this time; the appearance of large buy orders may indicate opening long positions, which may be a good buying point at this time.
(2) In the case of decreasing open interest, the appearance of large sell orders can be judged as closing long positions, and the appearance of large buy orders can be judged as closing short positions, with little impact on the future price trend.
(3) The longer the order duration, the greater the likelihood of the order being executed.
Advanced content (Main Force Large Orders + MA Indicator):
Indicator parameters: Main Force Large Orders >= $7 million, MA selected 120;
Period selection: 5-minute period;
Bullish signal: Continuous price decline, multiple buy orders; price breakthrough of MA120 indicates a bullish trend reversal;
Bearish signal: Continuous price increase, multiple sell orders; price falls below MA120, indicates a bearish trend reversal.

In the BTC oscillating market on February 1, combining the short-term period (5 minutes) with the MA120 moving average:
The trend line crossed MA120 and stabilized at 22:00 on February 1 (bullish in the future), and from 22:00 on February 1 to 11:00 on February 2, the main force large orders provided multiple reference trading points. Trading based on main force large orders from February 1 to February 2 yielded a maximum profit of 6.46%.
Large Volume Transactions
A powerful tool developed by the AICoin team to track the market's large market order transaction situation, including key trading information such as buying and selling direction, transaction amount, and transaction time.

For example:
(Perpetual ETH/USDT, 5 minutes) Around 10:38 on December 28, there were super large market orders for buying.
In the following 11 minutes, there were mostly large volume transactions for buying market orders. The subsequent performance followed an upward trend.
If following the super large order to open a long position at $2397, the highest profit rate can reach 0.67%.
Chip Distribution
The Volume Profile displays a bar chart of the volume of transactions within a specific time range on the price coordinate.
Generally, blue represents buying transaction volume, yellow represents selling transaction volume, and the longer the volume bar, the larger the transaction volume. The price level with the most transactions in a specific time period is the control point, defaulting to a blue price label line.
Through chip distribution, it is easy to identify the price levels where the most trades occur, to confirm support and resistance levels, and to identify market bottoms and tops.
Usage of Chip Distribution:
The price where the peak of selling chips is located can be considered as a support/resistance level:
Located below the price, forming a support level, if the support level is not broken, the price rebounds; if the support level is broken, the market accelerates its decline;
Located above the price, forming a resistance level, if the resistance level is not broken, the price retraces; if the resistance level is broken, the price accelerates its rise.
For example:

(LINK/USDT, 1 hour) On February 3, it can be observed through the chip distribution chart that the main force chips of LINK are concentrated around $17.878.
Combine with Xiao A's intelligent analysis to quickly understand LINK's technical indicators and obtain buying and selling reference points:
[Price Trend Analysis]
Candlestick Patterns:
Recent candlesticks show significant price fluctuations, with a clear upward movement followed by a retracement from 00:00 on February 3 to 19:00 on February 4. Especially at 23:00 on February 3, a long bullish candlestick appeared, followed by a slight price decline.
The latest candlestick at 19:00 on February 4 is a small bullish candlestick, with the closing price slightly higher than the opening price, and with short upper and lower shadows, indicating relatively balanced market competition.
Technical Indicators:
MACD Indicator
In the MACD indicator, the average values of DIF and DEA are close to zero and near the zero axis. The MACD histogram also shows a small value, indicating that the market is currently in a oscillating state without a clear trend.
KDJ Indicator
In the KDJ indicator, the J value (88.417) is much higher than the K value (66.866) and the D value (56.090), possibly indicating the risk of overbought prices in the short term.
EMA7 (17.819) has crossed above EMA30 (17.793), which is typically seen as a signal of a short-term upward trend.
Volume:
During significant price fluctuations, the trading volume also increases. For example, the volume reached its peak at 23:00 on February 3, matching the long bullish candlestick at that time, indicating strong buying power. The volume in the latest period is lower, only 33,263, reflecting a decrease in market activity compared to the previous few hours.
[Buy/Sell Points]
Buy Point 1: 17.85 USDT (EMA7 just crossed above EMA30, short-term trend is bullish)
Buy Point 2: 17.70 USDT (recent low support level, potential buying interest if the price retraces to this level)
Long Position Stop Loss: 17.60 USDT (below Buy Point 2 and below the previous low, to reduce position risk)
Sell Point 1: 18.00 USDT (recent resistance level that has been repeatedly tested but not broken)
Sell Point 2: 18.20 USDT (area of the high point on February 3, strong psychological and technical resistance level)
Short Position Stop Loss: 18.35 USDT (above Sell Point 2 and above the high on February 3, indicating a potential further increase)
Liquidation Chart
Easily observe liquidation data at different price levels, differentiate between long and short liquidation situations, and identify market reversals.
For example:
Display the contract liquidation volume at different price levels for a certain cryptocurrency over different time periods such as 1 hour, 4 hours, and 24 hours. Red represents the liquidation volume of short positions at that price level, green represents the liquidation volume of long positions, and the blue line indicates the price level with the most liquidations.
During a price decline, after a large number of long positions are liquidated, the price often reverses and rises. Conversely, during a price increase, after a large number of short positions are liquidated, the price often reverses and falls.

(BTC/USDT perpetual, 15 minutes) On September 28, as BTC price rose, the liquidation chart showed a large number of short liquidations near $26762. According to the liquidation chart pattern, it was predicted that the BTC price would soon decline. Subsequent market trends confirmed the decline, dropping to $26050. Then, near $26050, there were a large number of long liquidations, indicating a bullish signal, and the price gradually rose to $26550, confirming the reversal.
Customized Timeframes
From seconds to days, covering any period, easily identify trading opportunities from different perspectives.
For example:
Custom period of 45 minutes + EMA24 usage:
Effective breakthrough of the moving average indicates a bullish trend; effective breakdown of the moving average indicates a bearish trend.

(BTC/USDT perpetual, 45 minutes) BTC price broke above the EMA24 moving average, and the MACD showed a bullish divergence signal, issuing a double buy signal. Subsequently, BTC further broke through and tested the resistance level, rising all the way to $43,550. AICoin also sent an early warning of the rise, with a potential profit of up to 5.34% by following the signal.
More period examples:
45 minutes + EMA50: Break above the moving average and stabilize, indicating a bullish trend; effective breakdown of the moving average indicates a bearish trend.
8 hours + MA40: Close price breaking above the MA, buy to open long positions; close price breaking below the MA, sell to open short positions.
Multi-Window Layout on the Same Screen
Freely switch between 9 multi-window layouts, easily view the K-line of hot coins.
For example:
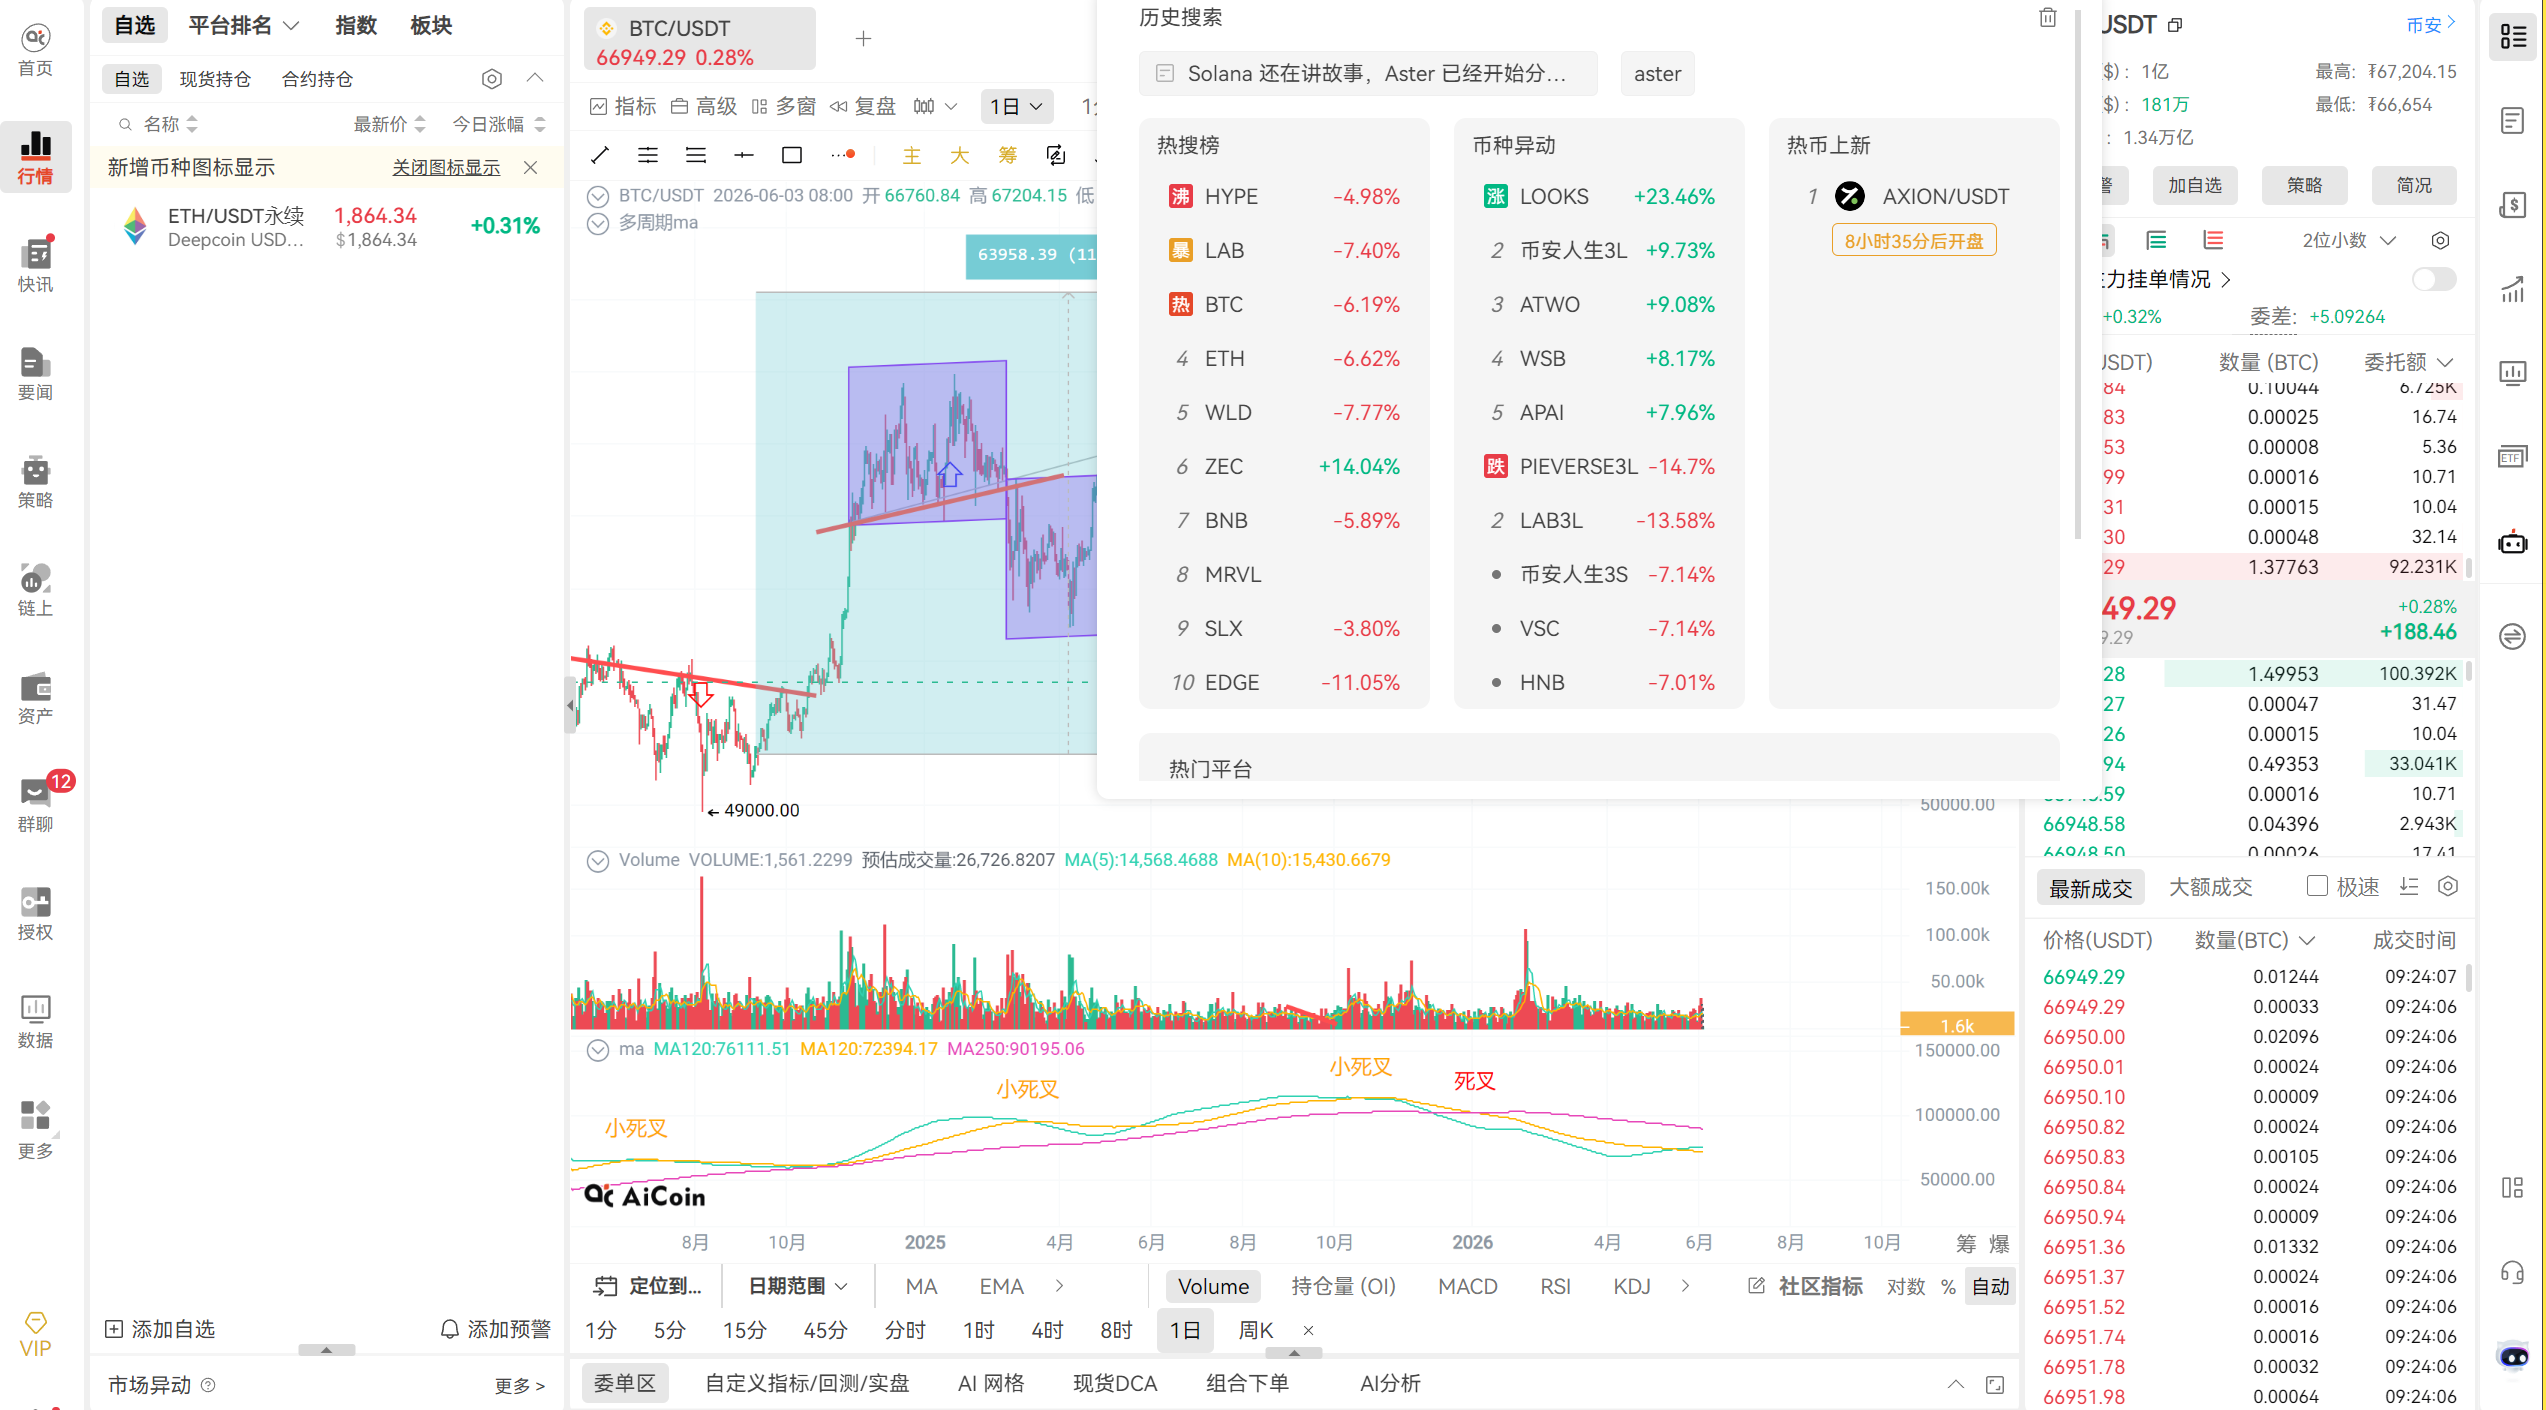
Using multi-window layout, you can monitor the intraday trends, hourly fluctuations, minute-level changes, and even more detailed second-level price changes of popular coins on the hot search list in real time on the same screen. You can also display multiple indicators such as MACD, RSI, BOLL, etc., for Bitcoin on the same screen, for in-depth analysis of the market dynamics behind them.
Whether it's simultaneously observing the trends of multiple coins, comparing K-lines of different periods, or analyzing multiple technical indicators, all can be achieved through the multi-window layout.

Exclusive Alerts
Specially designed for experienced traders, providing exclusive price fluctuation alerts, market analysis, and real-time market dynamics.
For example:

(ETH/USDT perpetual, 10 minutes) On January 31 at 03:30, AICoin's main force tracking captured a $3.5 million super large buy order at $2369.29 and issued a Pro special alert, predicting that it might suppress the market. By January 31 at 19:00, the BTC price had dropped to $2236.64. Following the operations of large traders and the alert prediction, a maximum profit of 3.68% was achieved.
AI Smart K-Line Analysis
Interpreting market trends, analyzing indicator signals, identifying entry and exit points, and predicting future price movements.
For example:

Xiao A predicted a high probability of BTC trading in a range from $40500 to $43500, with detailed buy/sell points. BTC's market indeed experienced significant oscillations as predicted, dropping to $41400 and then rising to $43420, approaching Sell Point 2. Trading based on Xiao A's predicted buy/sell points resulted in a maximum profit of 4.3%.
Usage Setting Guide
- Add special indicators and market indices

- Edit the set indicators and indices

- Open multi-window layout

- Create a custom layout

- Check exclusive alerts at any time

- Get AI market analysis

Disclaimer
This tutorial is intended to provide a guide for using the member features of this platform. While the tutorial strives to provide accurate and useful information, we do not provide any form of express or implied guarantee for the accuracy, completeness, or timeliness of the tutorial content. Users bear the risk of using the tutorial content on their own. The content of this tutorial is based on the latest platform features and operations, but information related to technical updates and policies may change at any time without notice. We do not assume any responsibility for any form of loss or damage caused by the failure to update the tutorial content in a timely manner.
免责声明:本文章仅代表作者个人观点,不代表本平台的立场和观点。本文章仅供信息分享,不构成对任何人的任何投资建议。用户与作者之间的任何争议,与本平台无关。如网页中刊载的文章或图片涉及侵权,请提供相关的权利证明和身份证明发送邮件到support@aicoin.com,本平台相关工作人员将会进行核查。