PRO K-Line - Beginner's Guide
Welcome to using AICoin PRO K-Line! Even beginners can operate like professionals, grasp market dynamics, and discover the code to wealth!
Here, you can enjoy the following features:
- Intuitive main force tracking - see the movements of major players and follow the trend of the main force.
- Fund flow identification - filter out invalid information and track fund movements.
- Full-depth chart - order data at a glance, identify market buying and selling power.
- Chip distribution chart - easy-to-understand concentrated display of transactions, predict major market trends.
- Customizable periods - set flexible periods, from seconds to days, to seize trading opportunities.
- Comparative K-Line & Combined K-Line - compare trends of multiple currencies, simplify trading decisions.
- Multi-window display - monitor multiple strategies on the same screen, easily grasp multiple markets.
- K-Line backtracking - one-click switch to a specified date, summarize trading experience.
- Special indices - display key indices on the K-Line to assist decision-making.
- Comprehensive historical data - data traceable to 2011, explore past market conditions, build a solid trading foundation.
- Increased usage limit - more drawing lines and custom selections, expand analysis scope.
- Xiao A intelligent K-Line analysis - predict market trends with multiple indicators, provide buy and sell signals and position advice.
- Exclusive news - real-time push of market dynamics, policy changes, industry information, don't miss important information.
Introduction to PRO K-Line Features
Major Force Large Orders
AICoin's independently developed powerful trading tool helps you understand when, at what price, and how much the main force in the market has bought and sold.

How to Understand Major Force Large Orders?
- [Length] The longer the horizontal line, the longer the order time; the shorter the horizontal line, the shorter the order time.
- [Thickness] The thicker the horizontal line, the larger the order amount; the thinner the horizontal line, the smaller the order amount.
- [Depth] Dark color indicates a transaction, light color indicates no transaction. Red represents sell orders, green represents buy orders.
Usage of Major Force Large Orders:
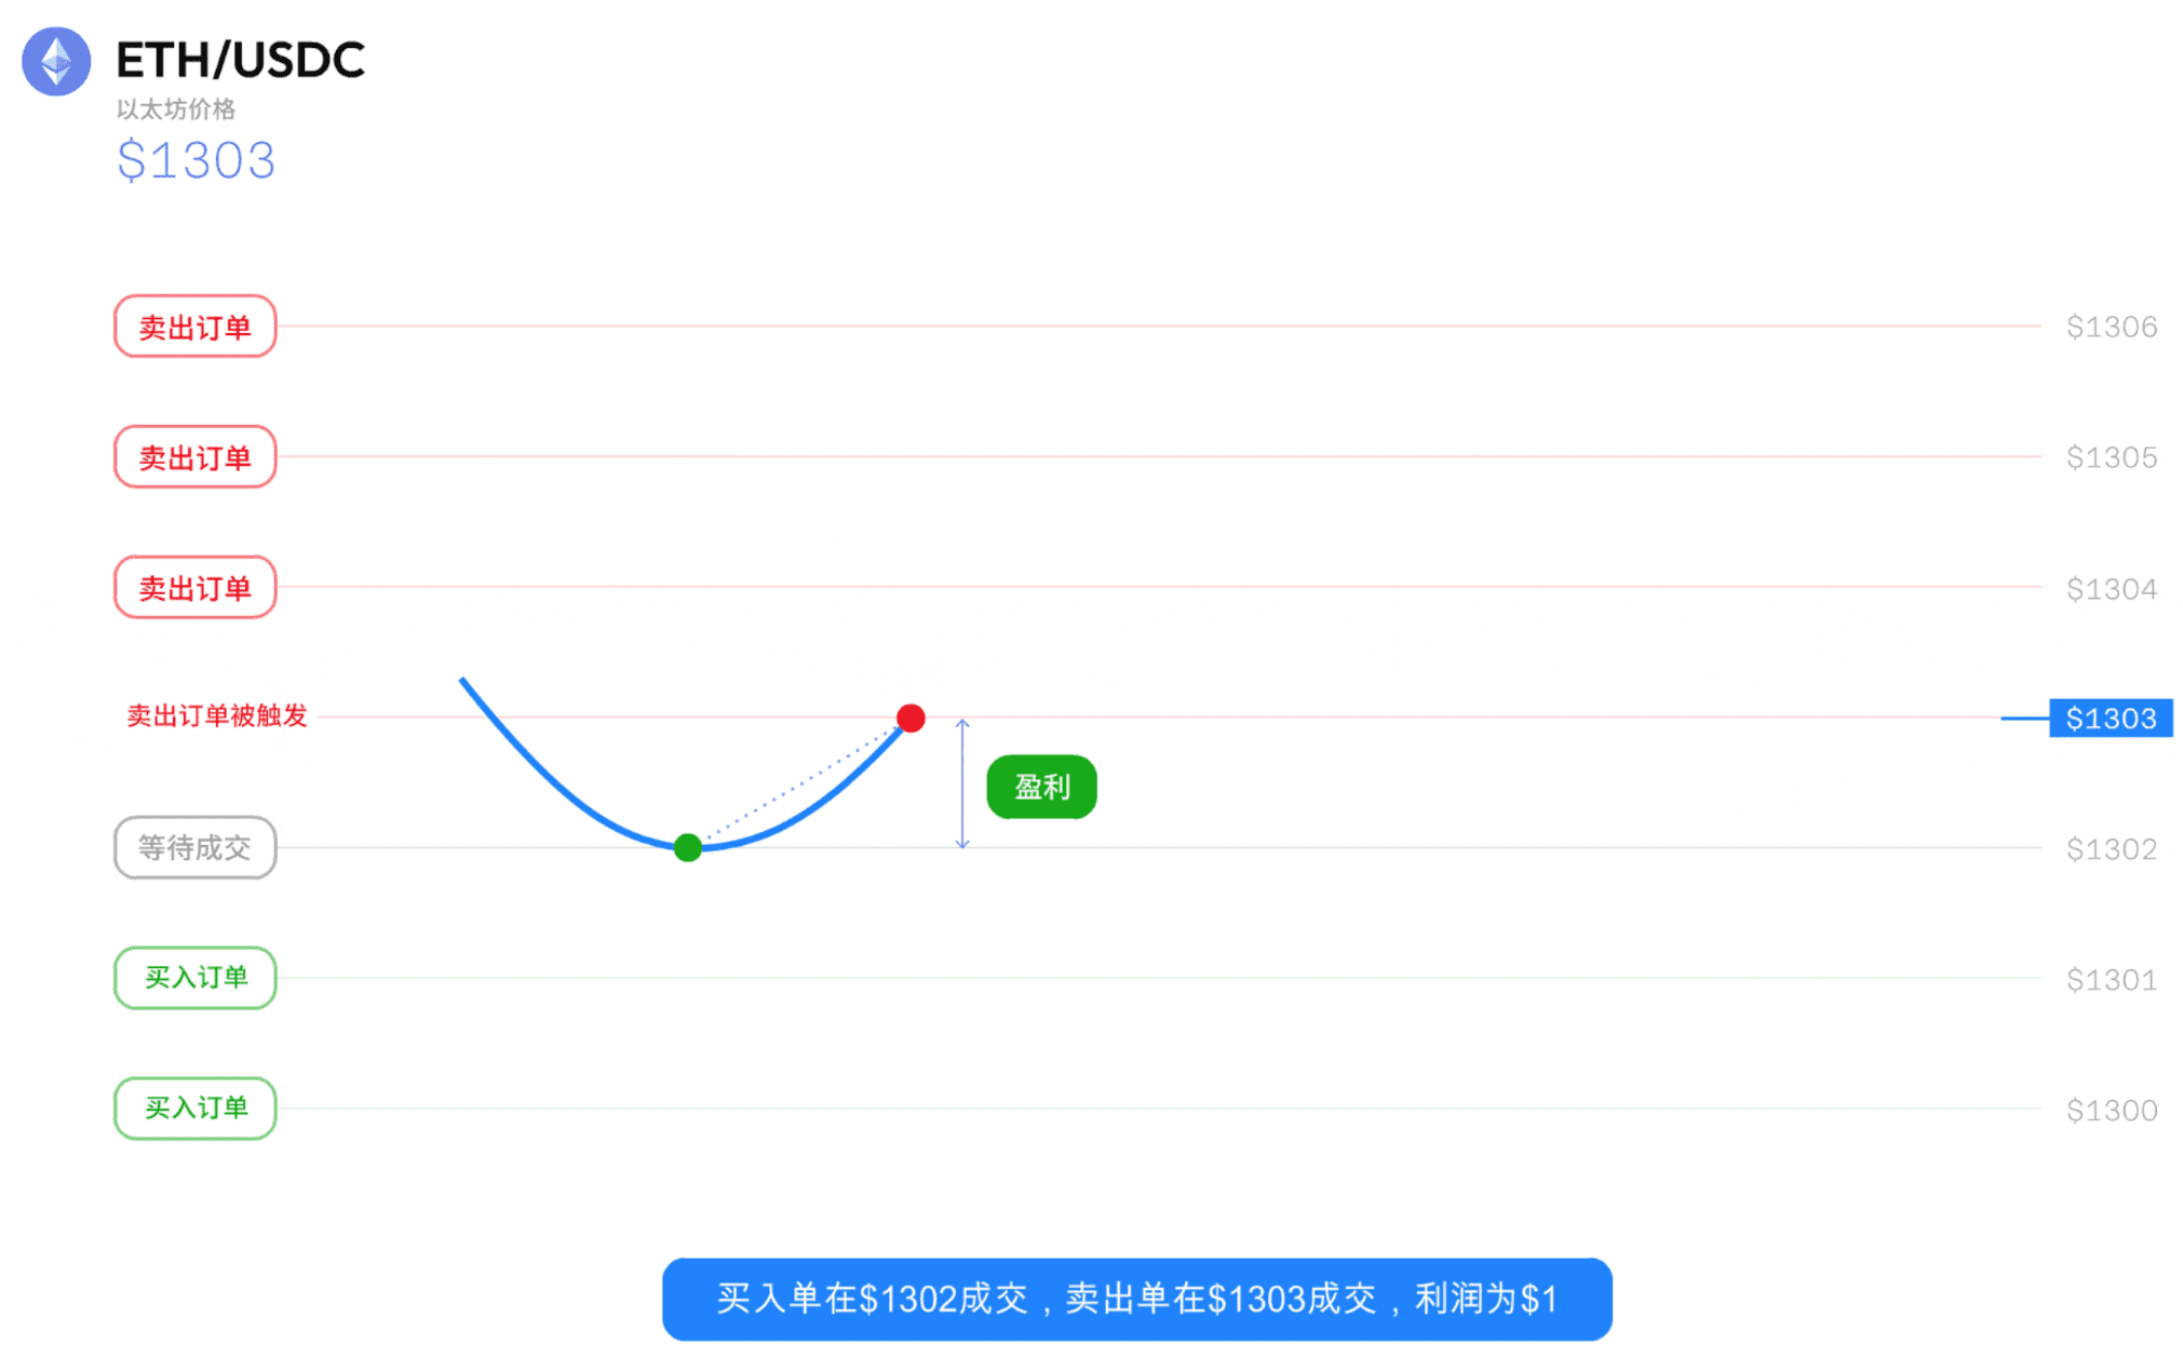
- Major force placing buy orders: Before the transaction, anticipate a drop in price (place orders at lower prices to transact); after the transaction, form support and anticipate an increase in price.
- Major force placing sell orders: Before the transaction, anticipate an increase in price (price needs to rise to transact); after the transaction, convert to resistance and anticipate a decrease in price.

Example:
By understanding the intentions of the main force through major force large orders, such as buying or selling, holding or unloading, you can find the main force's support and resistance levels and make money by following the main force.
(BTC/USDT perpetual, 5 minutes) There were two waves of major force large order chip changes from 12:00 to 22:00 on February 1, 2024.
First wave: At the $41920 level, there was a $6.3 million super large buy order, with an order time from 10:25 to 12:35, and $6.3 million was transacted (100%);
At the $42285.5 level, there was a $4.4 million large sell order, with an order time from 9:20 to 15:47, and $4.4 million was transacted (100%).
If trading according to the trend of major force large orders, the return rate for this wave is approximately 0.87%.
Second wave: At the $42000 level, there was a $8.4677 million super large buy order, with an order time from 15:36 to 20:05, and $7.7375 million was transacted (91.38%);
At the $42549 level, there was a $4.2608 million large sell order, with an order time from 15:35 to 22:48, and $4.1284 million was transacted (96.89%).
If trading according to the trend of major force large orders, the return rate for this wave is approximately 1.3%.
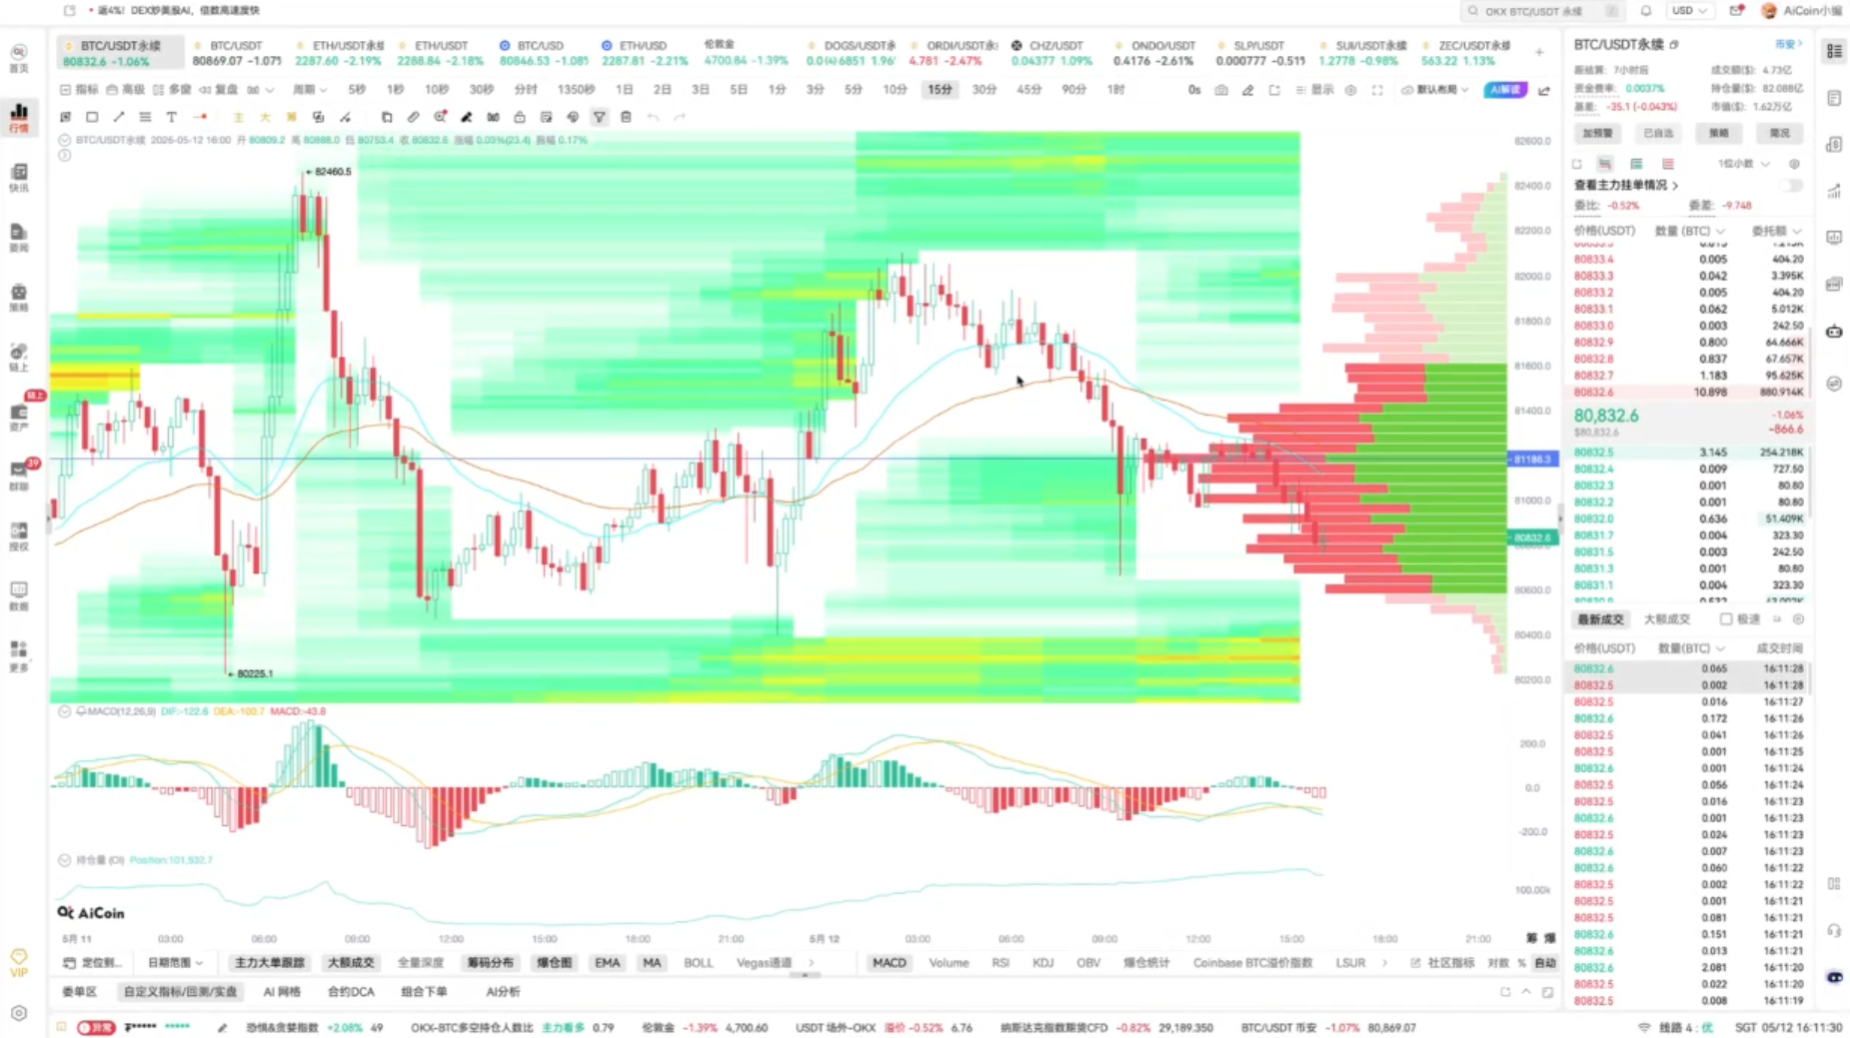
Large Volume Transactions
Track the major force large orders that have already been transacted in the market, grasp key trading information such as buying and selling directions, transaction amounts, and transaction times.

Usage of Large Volume Transactions:
- If there are more large buy orders, it indicates a bullish future price; if there are more large sell orders, it indicates a bearish future price.
- If the number of large buy orders exceeds the number of sell orders, you can follow the super large buy orders; if the number of large sell orders exceeds the number of buy orders, you can follow the super large sell orders.
Note: Do not act based solely on major force placing orders; more importantly, look at the transactions.

Example:
(ETH/USDT perpetual, 5 minutes) Around 10:38 on December 28, there was a super large buy order.
Within the next 11 minutes, most of the large volume transactions in the market were buy orders. The subsequent performance followed an upward trend.
If following the super large order to open a long position at $2397, the highest potential profit rate can reach 0.67%.
Chip Distribution
A graphical tool that displays the trading volume at different price levels. It can help you confirm the market's support and resistance levels, as well as the market's bottom and top, in order to choose the right buying and selling time.
Usage of Chip Distribution:
The price level where the peak of bearish chips is located can be considered a support or resistance level:
- Located below the price, it forms a support level; if the support level is not broken, the price rebounds; if the support level is broken, the market accelerates its decline.
- Located above the price, it forms a resistance level; if the resistance level is not broken, the price retraces; if the resistance level is broken, the price accelerates its rise.
Example:

(LINK/USDT, 1 hour) From February 1 to February 4, the chip distribution chart revealed that the main force chips of LINK were concentrated around $17.874.
The corresponding support level 1 is $17.7, and the resistance level 1 is $18.
The current price of LINK is hovering around $17.874, then rebounding, returning to the position of the main force chips, and testing the support level 1 of $17.7 again. If successful, it may continue to rise towards the resistance level of $18; if unsuccessful, it may decline again to find a lower support level.
Liquidation Chart
Easily observe the liquidation data at different price levels, distinguish between long and short liquidation situations, and identify market reversals.
Usage of Liquidation Chart:
Red represents the amount of short liquidation at that price level, green represents the amount of long liquidation, and the blue line represents the price level with the most liquidation.
When the price is falling, after a large number of long liquidations, the price often reverses and rises; When the price is rising, after a large number of short liquidations, the price often reverses and falls.

Example: (BTC/USDT perpetual, 15 minutes) On September 28th, the price of BTC rose, and from the liquidation chart, it can be seen that there were a large number of short liquidations near $26762.
According to the pattern predicted by the liquidation chart, the price of BTC is about to decline, and subsequent market trends confirmed the decline, dropping to $26050;
Subsequently, there were a large number of long liquidations near $26050, indicating a bullish signal, and the price gradually rose to $26550, confirming the reversal once again.
Custom Periods
Covering any period from seconds to days, easily identify trading opportunities from different perspectives.
Usage of Custom Periods 45min + EMA50:
Price crossing above the moving average and stabilizing, bullish; Price effectively falling below the moving average, bearish.

Example:
(BTC/USDT perpetual, 45 minutes) BTC experienced a U-shaped market trend;
At 15:30 on September 11th, the price of BTC fell below the EMA50 and effectively dropped, resulting in a profitable short position of 3.63% based on the signal; At 11:00 on September 12th, BTC rebounded to offset the previous decline, once again crossing above the EMA50, resulting in a maximum increase of 4.39%.
More recommended K-Line periods:
45min + EMA24: Effective breakthrough of the moving average, bullish; effective fall below the moving average, bearish.
8H + MA40: Closing price crossing above the MA, buy to open long positions; closing price falling below the MA, sell to open short positions.
Multi-Window Display + Positioning Function
Compare K-Lines of different time periods on the same screen to deeply understand market patterns.

Example:
According to the intuitive data comparison of multi-window display, from 2018 to the present, Bitcoin has shown a certain degree of volatility during the Christmas period each year. Except for the increase in 2020 due to the BTC halving, other years have experienced a downward market trend, with fluctuations ranging from 0.4% to 2.8%. In 2018, influenced by the "crypto winter," it even plummeted by 9.13%.
During the holiday period each year, BTC may replicate the trend of previous years. We can use the multi-window display + positioning function on the eve of the holiday to quickly review historical K-Lines and intuitively conduct multidimensional comparative analysis.
AI Intelligent K-Line Analysis
Helps you easily interpret market trends, analyze indicator signals, identify entry and exit points, judge future price trends, and no longer worry about K-Line analysis!

Example:
Xiao A issued a prediction of a high probability sideways movement for BTC, with a range of $40500-$43500, and also predicted entry and exit points for long and short positions. Subsequently, the market experienced significant fluctuations as predicted, and trading based on the buy/sell points forecasted by Xiao A resulted in a maximum profit of 4.3%.
Exclusive News
Whether it's price fluctuation alerts, in-depth market analysis, regulatory policies from various countries, or blockchain technology, exclusive news will be pushed in real-time, making your trading decisions more timely and well-founded.

Example:
BSV experienced a new high anomaly, and by clicking on the rise/fall analysis, Xiao A conducted a multidimensional analysis of the K-Line trend, indicators, trading volume, etc. In addition, you can click "bullish" or "bearish" to express sentiment, and also refer to the sentiment of other users and comments, sharing investor wisdom within the product.
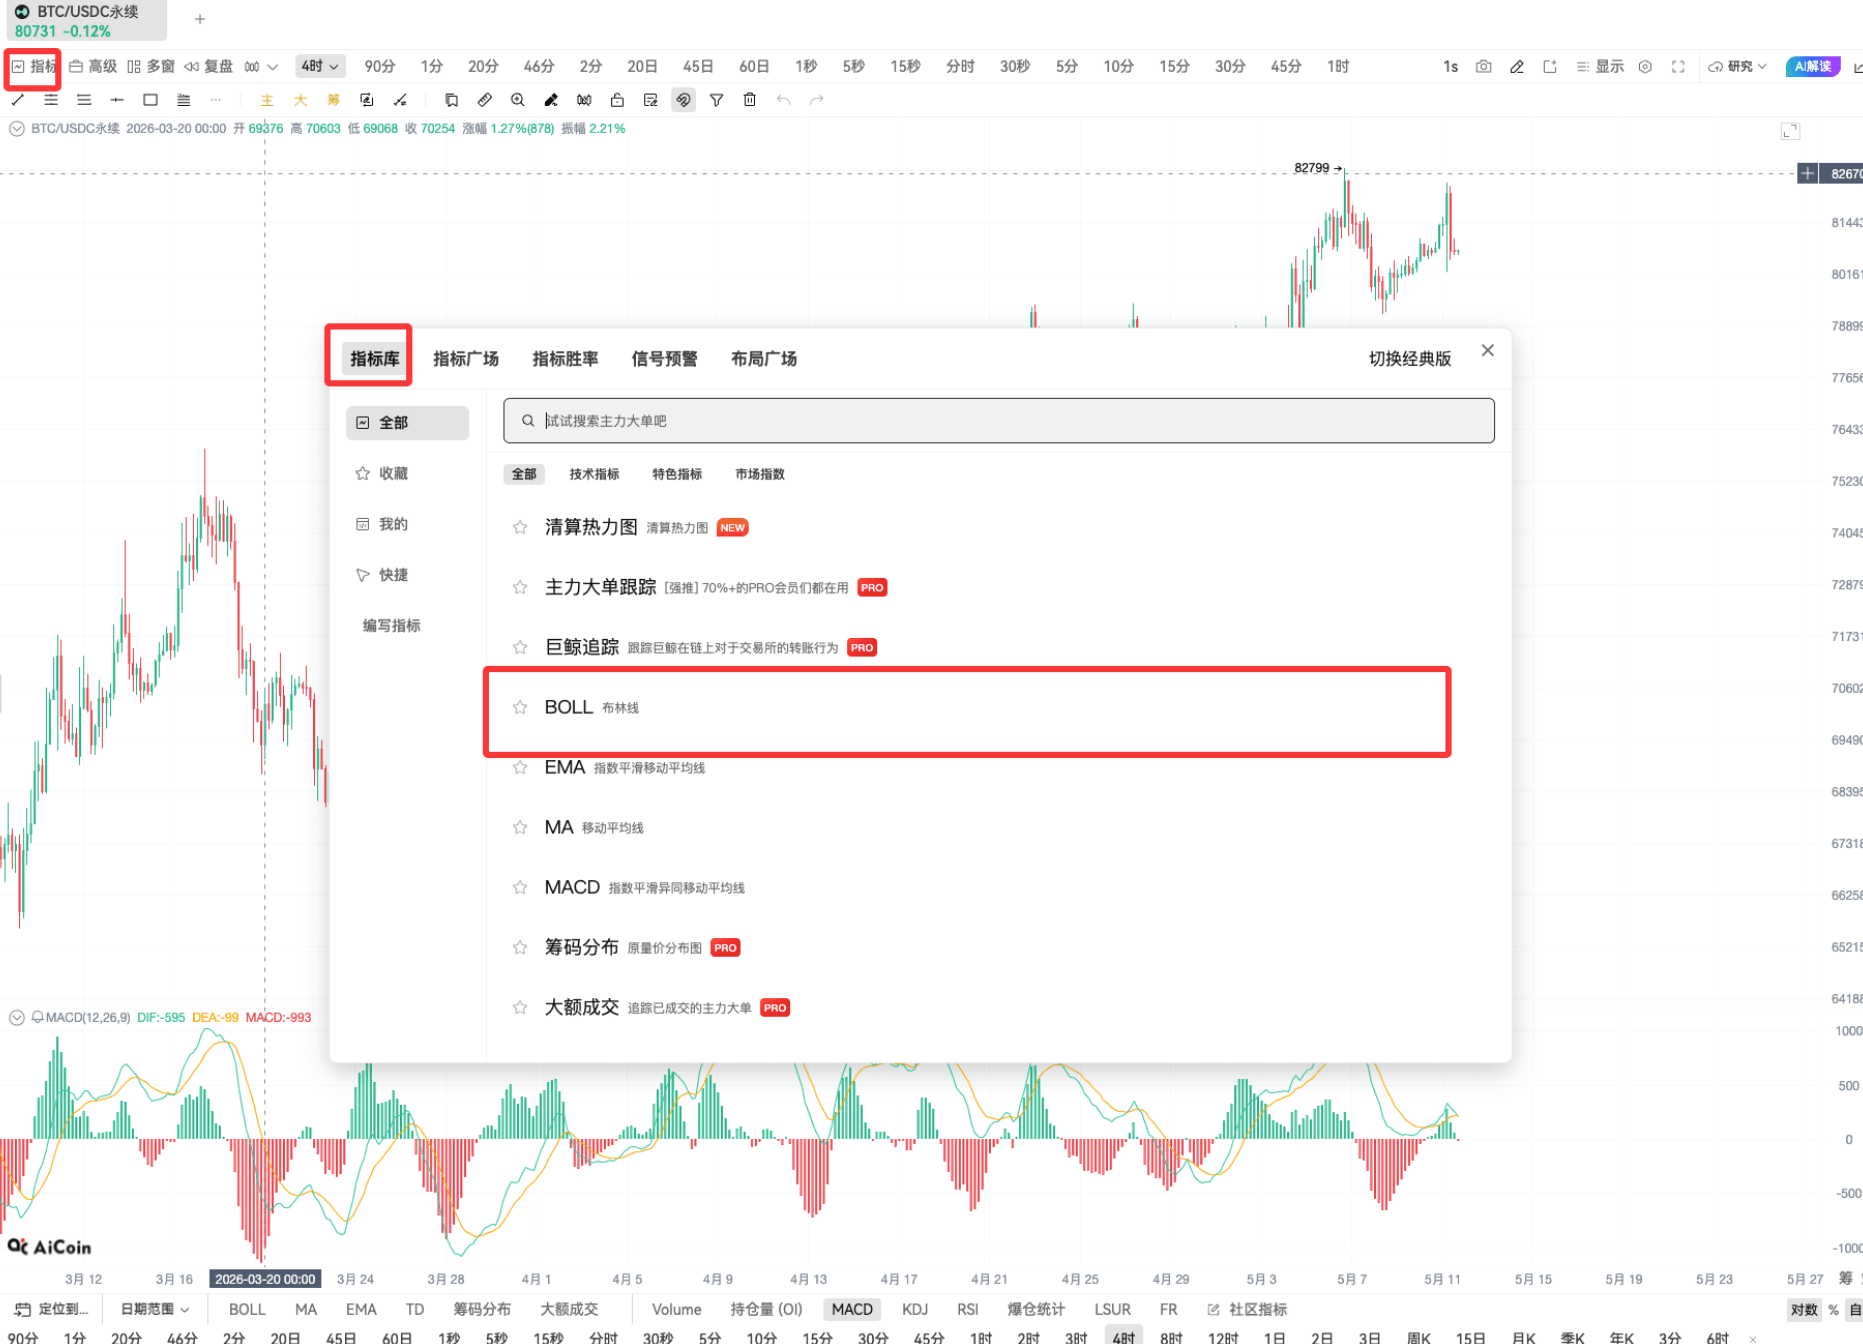
Usage Settings Process
Pro membership features are rich, and below we will introduce the basic operating steps to help you get started quickly and easily enjoy our services:
- Open the indicator library, check the exclusive indicators and market indices for Pro members, and view the relevant data on the K-Line.

- On the K-Line page, directly edit the set indicators and market indices through the "Hide / Set / Remove" buttons.

- We have prepared detailed tutorials for using various indicators. You can obtain detailed content through "Learn Indicator Usage" in the indicator library. If you encounter any problems during use, please feel free to contact your VIP account manager.

- Open the multi-window tool in the K-Line column, select the layout you need to open; you can synchronize charts, set the crosshair cursor, trading pairs, indicators, periods, comparative K-Lines, etc. within the multi-window.

- You can view preferred layouts in the layout square. We have integrated layout plans for beginner, intermediate, and advanced levels, providing comprehensive references for different strategies.

- Exclusive news contains Pro-exclusive data analysis content and more timely market dynamics and industry news push, which you can view at any time.

- By invoking the intelligent robot Xiao A through "AI Market Analysis" at the bottom of the K-Line page, enter the currency pair + period you want to analyze, and obtain interpretations of market trends, entry and exit points, and future price trends, providing references for your trading.

Disclaimer
This tutorial aims to provide a guide for using the platform's membership features. Although the tutorial strives to provide accurate and useful information, we do not provide any form of express or implied guarantee for the accuracy, completeness, or timeliness of the tutorial content. The risk of using the tutorial content is borne by the user. The content of the tutorial is based on the latest platform features and operations, but information related to technical updates and policies may change at any time without prior notice. We do not assume any form of liability for any losses or damages caused by the tutorial content not being updated in a timely manner.
免责声明:本文章仅代表作者个人观点,不代表本平台的立场和观点。本文章仅供信息分享,不构成对任何人的任何投资建议。用户与作者之间的任何争议,与本平台无关。如网页中刊载的文章或图片涉及侵权,请提供相关的权利证明和身份证明发送邮件到support@aicoin.com,本平台相关工作人员将会进行核查。