5.15/Daily Community: Waiting for CPI to Drive Market Trends; Maybe Tonight!
Live broadcast sharing various mainstream technical indicator application methods, as well as daily technical analysis;


[ETH/Daily Chart/4H Chart]
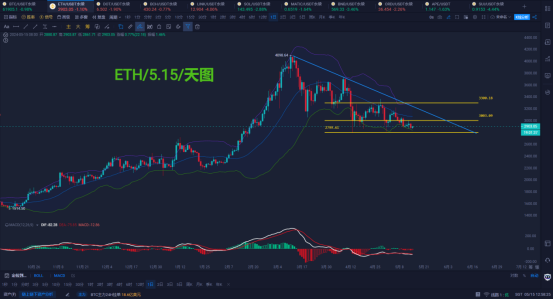
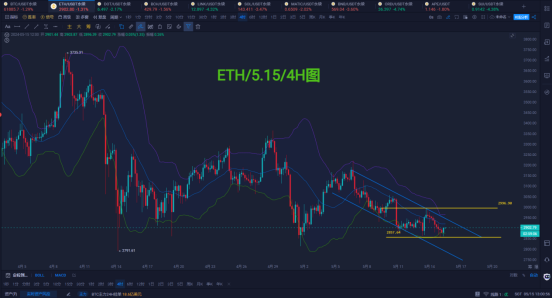
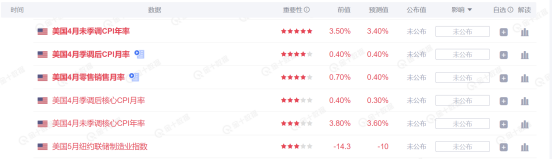
ETH Trend Analysis and Viewpoints: Ethereum's trend yesterday continued to maintain a weak consolidation, with the daily closing with a small bearish candlestick pattern. The overall intraday fluctuation range was between 2960-2858, closing near the lower price within a $100 range. In terms of indicators, the lower Bollinger Band provided support. To confirm this support, we need to wait for today's closing price to recover above 3000, or even higher. Conversely, if it falls below 2800, the next bearish target will be to test new support at 2600. The 4-hour technical trend shows consolidation and tightening Bollinger Bands at the lower level, indicating an upcoming breakout in the market. There is a certain probability for both upward and downward breakouts. Perhaps tonight's important CPI data will drive the market to choose a clear direction. The important index for the US April CPI annual rate is a five-star rating, with a prior value of 3.5% and a forecasted value of 3.4%. We await the announced value; if the announced value is greater than the forecasted value, it will be bearish for the cryptocurrency market. Conversely, if the announced value is less than the forecasted value, it will be bullish for the cryptocurrency market. This analyst does not speculate and awaits the results. Regarding the future trend, the analyst continues to maintain the view of buying on dips above 2800; if it does not break, the next target is 3200-3300. A valid break below will lead to exiting the long position. For more details, feel free to join the live broadcast room for discussion and exchange!
[ETH/4H Chart Contract Market Long/Short Data; Updated daily at 12:00 PM]
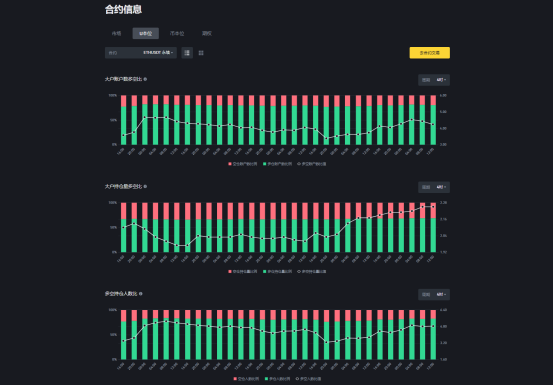
ETH/4-hour contract long/short data tracking:
1. Large account long/short ratio: Short position volume ratio: 19.11%; Long position volume ratio: 80.89%; Long/short volume ratio: 4.23
2. Large account volume long/short ratio: Short position volume ratio: 30.76%; Long position volume ratio: 69.24%; Long/short volume ratio: 2.25
3. Long/short volume number ratio: Short position number ratio: 17.12%; Long position number ratio: 82.88%; Long/short number ratio: 4.84
For more details, feel free to join the live broadcast room for learning and discussion!

Recommended Approach [2800 Bull/Bear Boundary]
Support 2850-2800/Resistance 3050-3100
Tencent Meeting ID: 565-877-8060
Five live broadcasts daily: 14:00-21:30 uninterrupted

ETH/DOT Short Strategy Tracking Conclusion: Comprehensive returns at 1200%-1400%
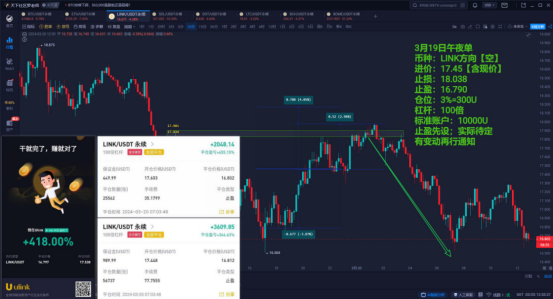
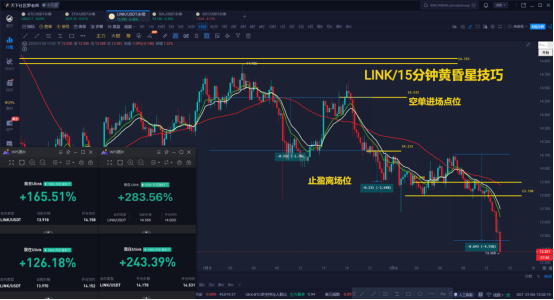
LINK/4H Strategy Tracking Conclusion: On March 22-23, the expected 4-hour head and shoulders pattern and the first and second bullish targets at 19.5-20 were perfectly reached, touching a high price of 20.765. For partners who have seriously followed and executed this strategy, the returns should be between 600%-1000%. We will continue to track the next long/short opportunities for LINK!
[Hunters' Lodge] What can you get from the Elite Class???
1. Get the midday video at the first time//2. Get market intraday viewpoints at the first time
3. Get short, medium, and long-term strategies at the first time//4. Track and guide the strategy throughout
5. Have the opportunity to participate in exclusive midnight battles//6. Have the opportunity to participate in million-dollar value courses
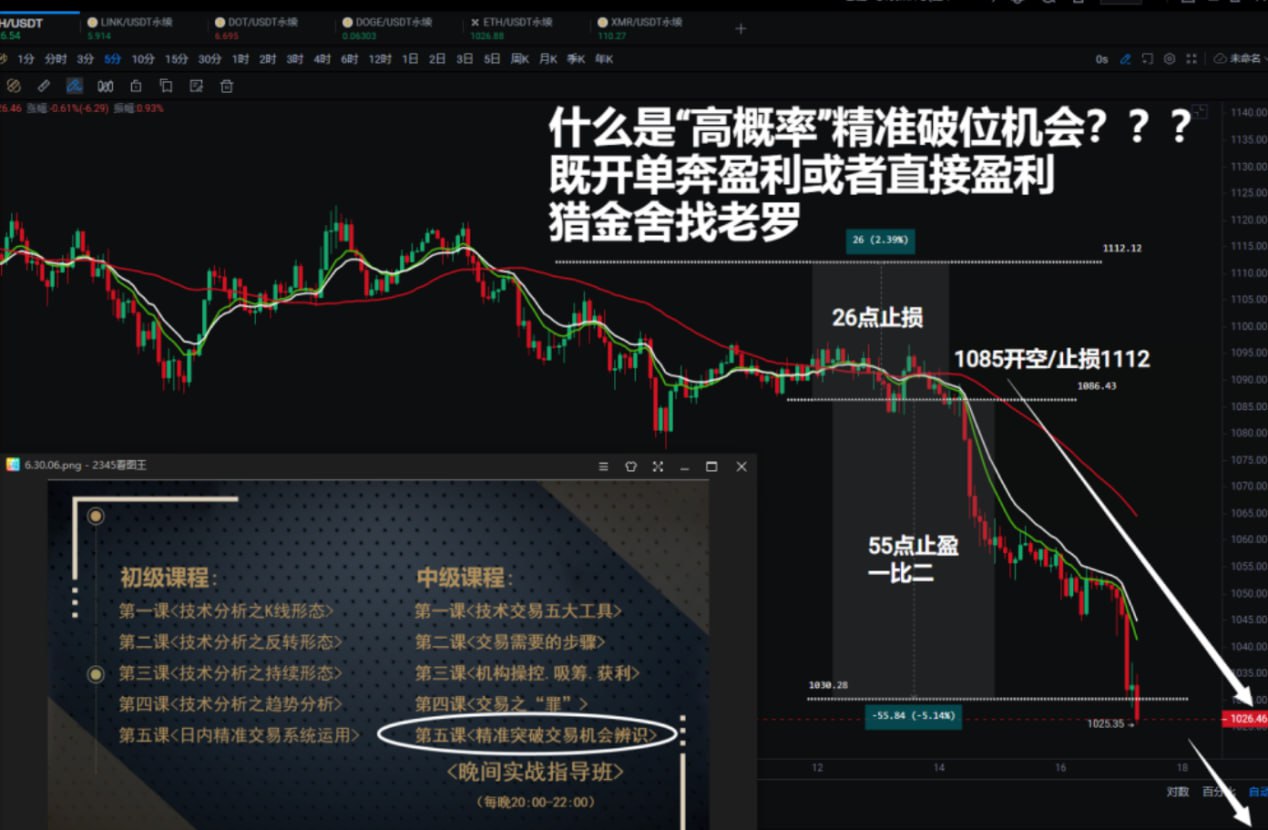
[Efficient. Accurate. Breakthrough Trading Opportunity Capture]

2023 Annual Strategy Guidance Record
January-December 2023///9 wins 3 losses
January complete/return rate 2322%///February complete/return rate -475%
March complete/return rate 3126%///April complete/return rate -491%
May complete/return rate +560%///June complete/return rate -66%
July complete/return rate +680%///August complete/return rate +82.54%
September complete/return rate 1346%///October complete/return rate 1298%
November complete/return rate 1752%///December complete/return rate 1384%
Total for January-December 2023: 12650%
Single margin of 300U*12650%=37950U
2022 Annual Strategy Guidance Record
February-December 2022///10 wins 1 loss
February complete/return rate 2500%///March complete/return rate 2500%
April complete/return rate 2626%///May complete/return rate 3698%
June complete/return rate 3081%///July complete/return rate 7033%
August complete/return rate 4694%///September complete/return rate 5046%
October complete/return rate 1438%///November complete/return rate 2362%
December complete/return rate -474%///
Total for February-December 2022: 34504%
Single margin of 100U*34504%=34504U
Each strategy//has evidence and can be traced back to the start time, date, hour, minute, and second, with graphic and textual records. Interested individuals can scan the code to join the group for verification!!


(Scan the code to follow the official account and experience more services)
免责声明:本文章仅代表作者个人观点,不代表本平台的立场和观点。本文章仅供信息分享,不构成对任何人的任何投资建议。用户与作者之间的任何争议,与本平台无关。如网页中刊载的文章或图片涉及侵权,请提供相关的权利证明和身份证明发送邮件到support@aicoin.com,本平台相关工作人员将会进行核查。


