Solana shows signs of gearing up for a potential breakthrough above the $160 price mark. The fact that the aforementioned price level coincides with the 50 EMA makes it a bit more important for the price.
Solana faces the 50-day EMA at around $160, a key resistance level in technical analysis. This EMA serves as a gauge for midterm market trends and has historically acted as a robust resistance or support level depending on the market’s direction. For Solana, conquering this mark could signal strong bullish sentiment and potentially usher in higher price levels.
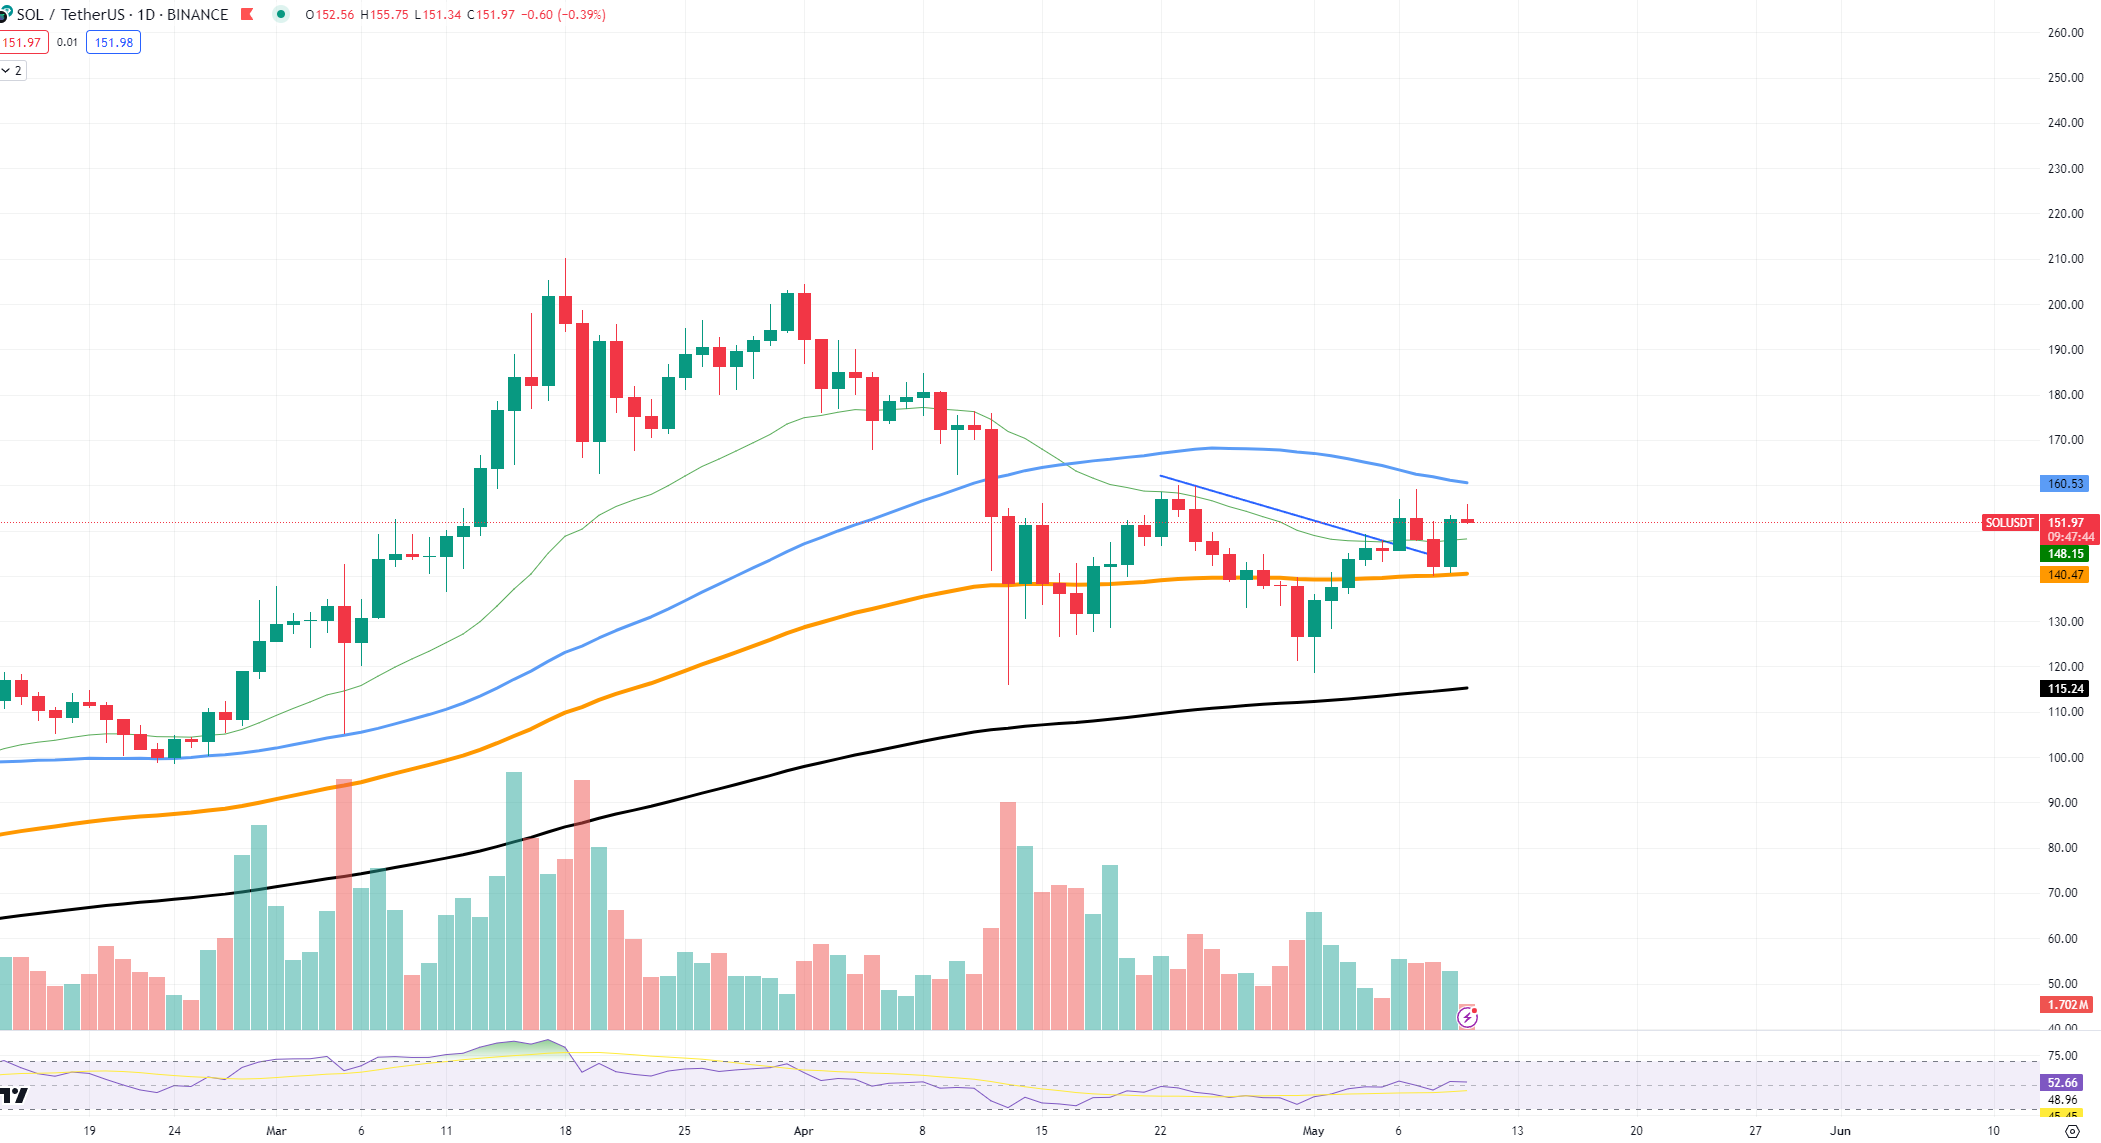
SOL/USDT Chart by TradingView
However, the journey to breaking this resistance is challenged by descending trading volume. Typically, a decrease in volume can indicate a lack of conviction in the market's direction, suggesting that traders are cautious and potentially waiting for more definitive signs before committing to larger positions. This could mean that Solana’s approach to $160 will require a significant catalyst or market event to boost confidence and trading activity.
Another technical aspect to watch is the potential "neckline" breakthrough at around $160. This term refers to a key level in chart patterns, such as head and shoulders or inverse head and shoulders which, when broken, can lead to significant price movements. A decisive close above this level could validate bullish predictions and trigger a new wave of buying interest.
Will Ethereum do it?
Ethereum is currently unable to break the 100 EMA threshold. A key observation is its inability to surpass the 100-day EMA, a technical indicator that often acts as a measure of the asset's mediumterm trend.
Currently trading below $3,100, Ethereum is struggling to establish a clear uptrend. This price point is crucial because remaining under this level introduces considerable risks to Ethereum's valuation. A sustained position below the 100 EMA not only highlights the bearishness of the market but also sets up a potential scenario where Ethereum could test the 50 EMA.
RelatedRipple CTO Reveals How He Bought 40,000 ETH During Ethereum ICO
The potential move toward the 50 EMA is critical. This indicator is often seen as an indicator of a short-term trend. A decline toward this level could reinforce the bearish outlook, suggesting that lower prices may be a question of time.
Cardano's resistance
Cardano faces an important moment on the chart, facing a significant resistance level at $0.46. This resistance has acted as a formidable barrier, preventing the price from climbing higher in recent weeks. However, the latest trading activity indicates that a potential breakthrough might be on the horizon.
The resistance level of $0.46 is not just a random figure; it has been tested multiple times over the past few months, making it a key focal point for traders. Each time ADA has approached this level, selling pressure has increased, pushing the price back down. However, the current market dynamics suggest a change might be underway.
A recent surge in trading volume has been observed as ADA approaches this critical resistance level once again. Increased volume typically indicates heightened interest from traders and can often precede significant price movements. If the buyers manage to overpower the sellers, we could witness ADA breaking through this resistance level.
RelatedXRP Price Prediction for May 10
Moreover, the Relative Strength Index shows that ADA is moving toward a neutral point, with a current reading nearing 50. This suggests that the selling pressure is easing, and the buying interest is picking up, providing a balanced force that could tilt in favor of the bulls.
The RSI moving toward a midline of 50 is particularly significant because it implies that market sentiment is shifting from bearish to potentially bullish. If the RSI continues to rise and remains stable, it supports the scenario of strengthening upward momentum.
A successful breach of the $0.46 resistance could open the doors to further gains, possibly testing higher resistance levels. On the other hand, failure to break through could lead to a consolidation or a retreat to lower support levels.
免责声明:本文章仅代表作者个人观点,不代表本平台的立场和观点。本文章仅供信息分享,不构成对任何人的任何投资建议。用户与作者之间的任何争议,与本平台无关。如网页中刊载的文章或图片涉及侵权,请提供相关的权利证明和身份证明发送邮件到support@aicoin.com,本平台相关工作人员将会进行核查。


