
When others are fearful, I am greedy; when others are greedy, I am fearful. This is a phrase familiar to traders, but very few can truly apply it.
The second sentence is how to outperform more than 90% of investors? First of all, you must be completely opposite to 90% of people in many aspects, which is what we often call going against human nature.
As early as 24/03/08, the Egyptian currency collapsed and fell by 40%, and Bitcoin's previous high was rejected in a day. Beware of short-term pullback risks?
24/03/11 BTC hit a new high of 70,000, but the weekend rebound was rejected again. Beware of short-term pullback risks.
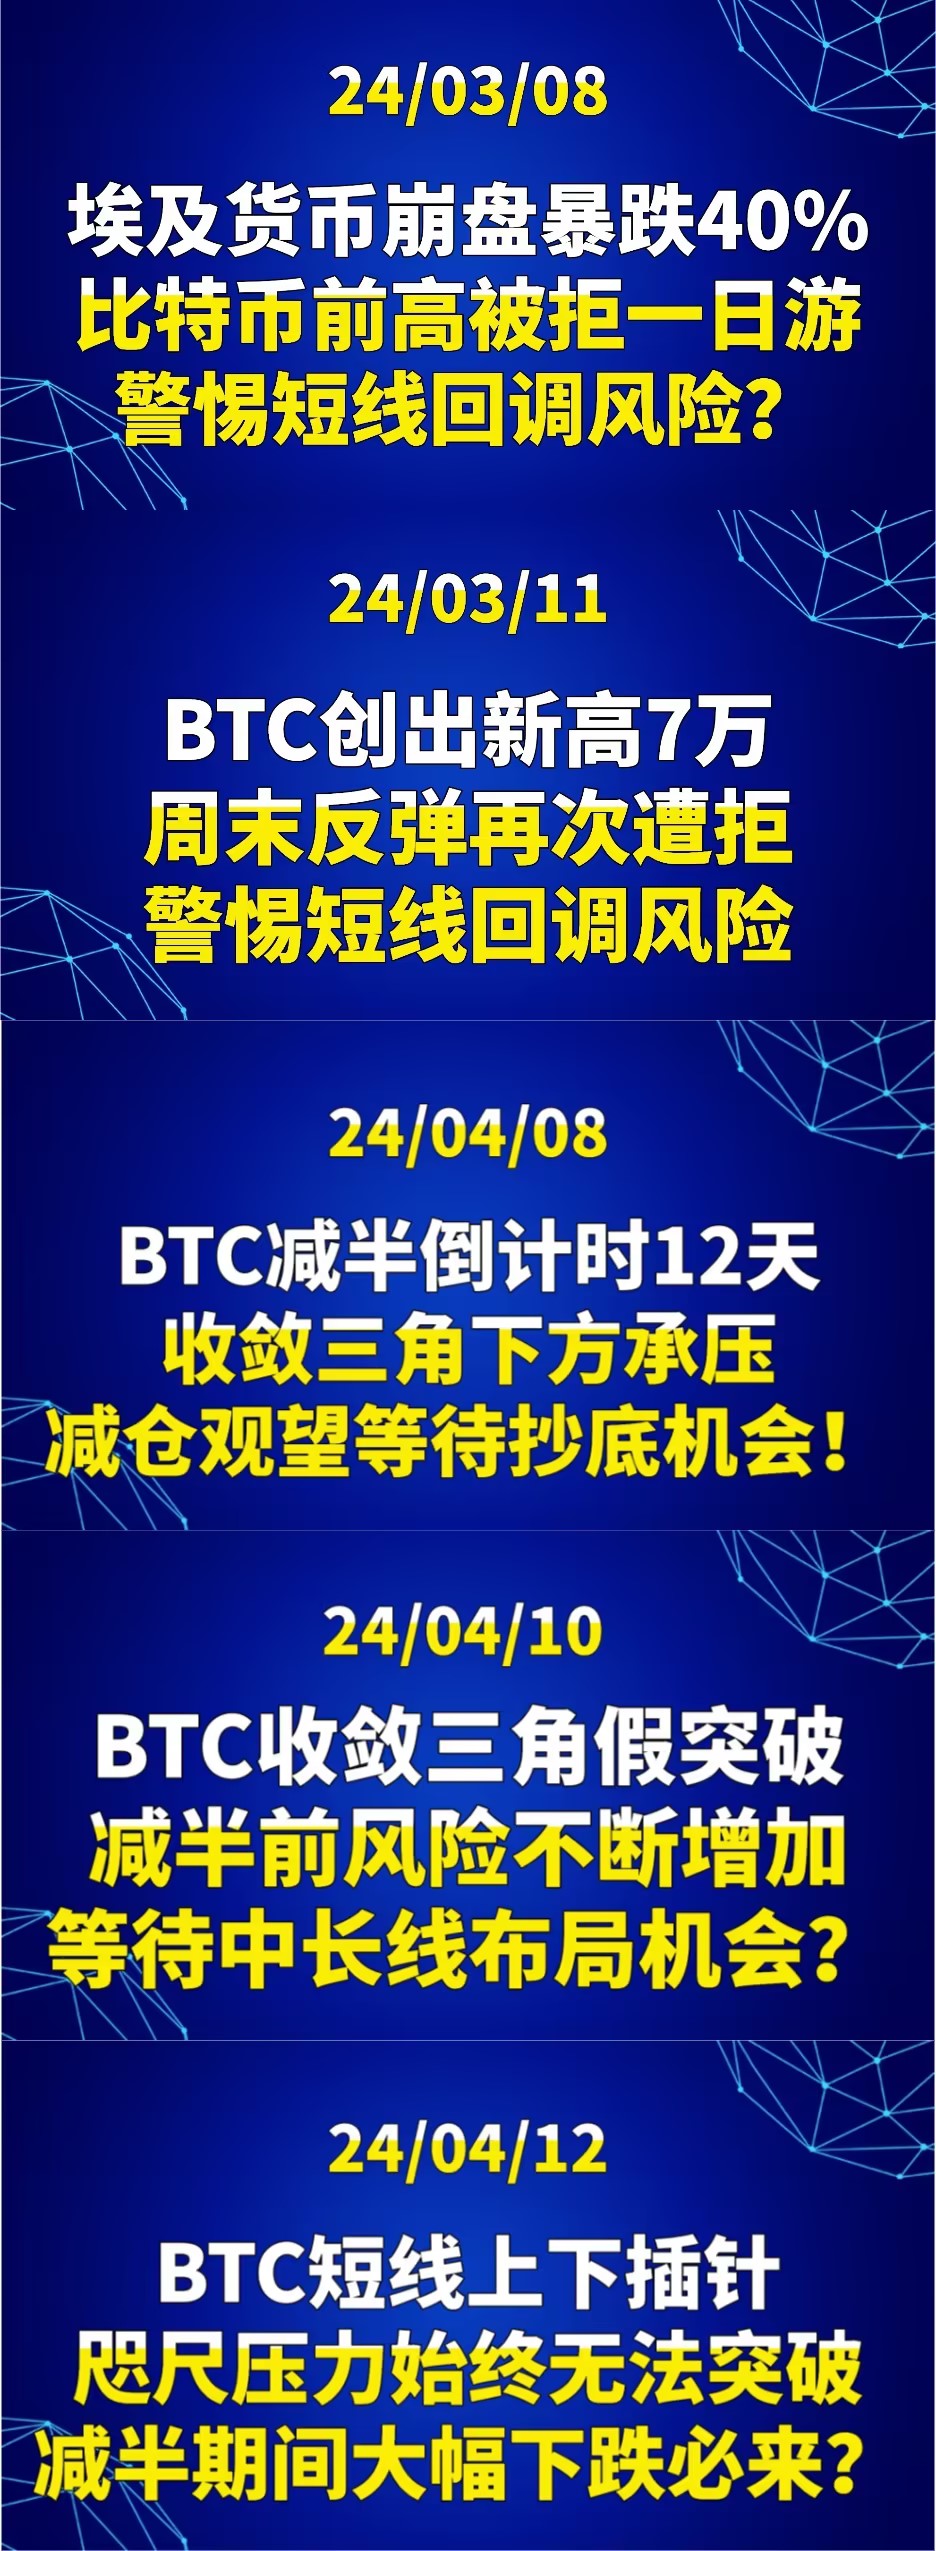
Moving on to the recent 24/04/08, 12 days before the Bitcoin halving, it is under pressure below the convergence triangle, reducing positions and waiting for the opportunity to buy the dip.
24/04/10 Bitcoin's convergence triangle false breakout, increasing risks before the halving, waiting for medium to long-term layout opportunities?
24/04/12 Bitcoin's short-term up and down movements, unable to break through the pressure, a substantial decline is inevitable during the halving period?
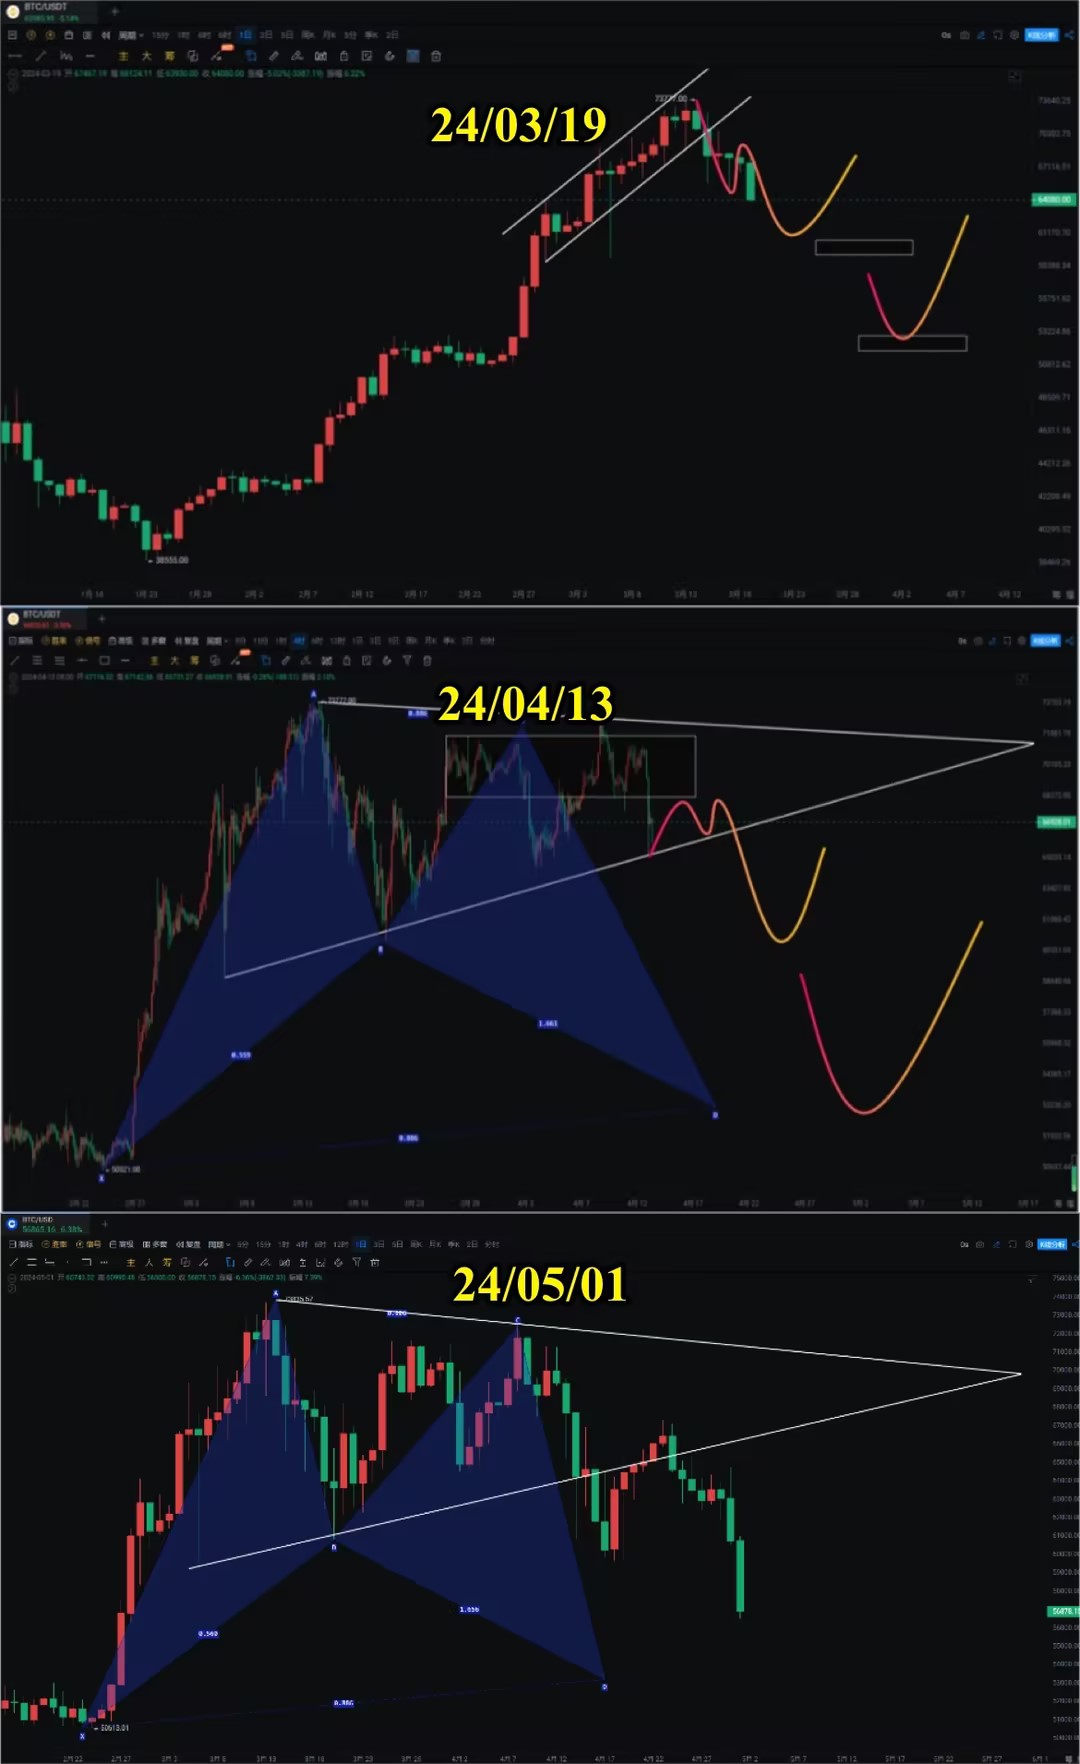
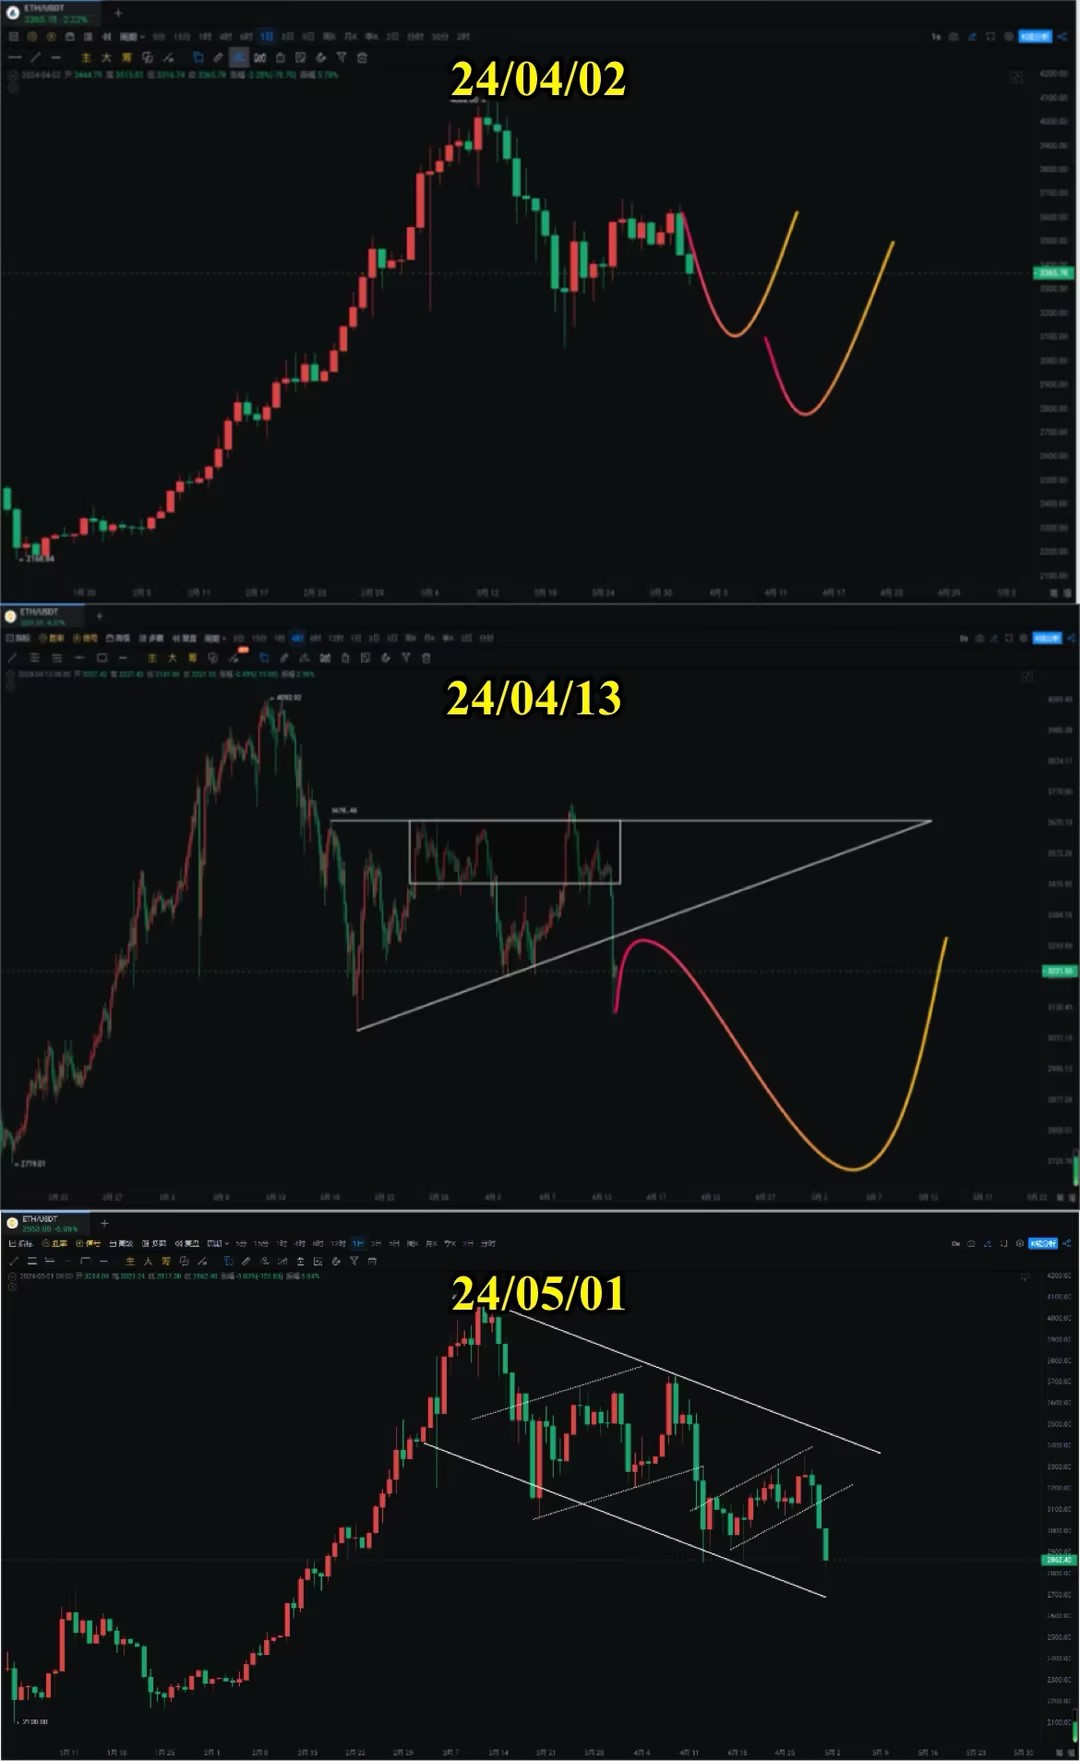
24/04/13 Multiple tops in Bitcoin before the halving, a major distribution, is it a buying opportunity or will it continue to decline? Will a black swan event occur?
24/04/16 Miners selling off before the halving, fearing a significant downward pressure on BTC, the downside risk remains unresolved.
24/04/25 BTC halving turns bearish, be cautious of a sharp decline at high levels, previously warned that a substantial decline is inevitable.
24/04/29 BTC monthly outflow signal, no breakthrough of important resistance, beware of a sharp decline.
24/04/30 Hong Kong ETF listing falls below the issue price, BTC spikes to 64,500, the rebound is weak, and the bearish trend is strong.
There must be analysis and operational errors in the middle. Small retracements can be understood, but fundamental errors should not be made.

Bitcoin
Bitcoin broke through the 59,000 support directly to 56,552, a 23% drop from the high point. Ethereum dropped by 31%, and most altcoins dropped by 50%-70%. Ethereum and Bitcoin have not yet experienced a 51.9% drop, but many altcoins have. If Bitcoin continues to fall to 49,000-52,000 to stop the decline, it will be very agonizing for those holding altcoins.
The monthly engulfing pattern indicates a bearish signal. It is a good thing for the market if it opens lower today. If it opens higher and touches the upper BOLL and then gets pushed down, the trend will be worse. The Fibonacci retracement line touched 0.236 (56,369) and has not completely broken through. The Fibonacci retracement line 0.382 (48,554), which means the high point reached by the ETF must not be broken, otherwise, I will consider it bearish. In other words, the spike must also return above 49,000 for the bull market to continue.
The daily chart shows a downtrend C wave hitting the MA120 support, which is temporarily seen as support. The previously mentioned buying opportunities at 53,000-56,000 are also very close. Patient friends can wait for at least a decent rebound on a smaller time frame. Volume has increased for three consecutive days, but there is still no significant increase in volume or spike signal. The MACD double bottom divergence does not rise, and the OBV indicator shows continuous outflow of funds, as we have reminded many times. The RSI indicator has entered the oversold zone. 53,000-60,000 is a vacuum zone, and 50,000-53,000 is also a very important support area.
Support:
Resistance:
Ethereum
Ethereum has fallen for two consecutive months on the monthly chart, and the weekly chart has broken through the BOLL midline but is still near the previous low. The MACD fast and slow lines have crossed downwards, and the histogram is growing below the zero axis. The adjustment time and space have been extended, and the OBV indicator has not completely broken through the yellow line.
The daily chart has seen a major downtrend from 4093, with several small upward channels in between, all of which have been broken, which is one of the reasons why we have been bearish all the way. It is a good thing for Bitcoin to fill the gap. I have always said that the final drop is still pending. The daily chart has broken through the MA120, and if it does not recover, it will target 2400-2600. Previously, I saw the extreme situation as bottoming at 2200-2400. If Ethereum continues to fall, you can enter in batches. Remember not to chase after a high, burst, or get trapped and then short.
Support:
Resistance:
If you like my views, please like, comment, and share. Let's navigate the bull and bear markets together!!!
The article is time-sensitive and is for reference only, with real-time updates.
Focusing on candlestick technical research, win-win global investment opportunities. WeChat public account: 交易公子扶苏

免责声明:本文章仅代表作者个人观点,不代表本平台的立场和观点。本文章仅供信息分享,不构成对任何人的任何投资建议。用户与作者之间的任何争议,与本平台无关。如网页中刊载的文章或图片涉及侵权,请提供相关的权利证明和身份证明发送邮件到support@aicoin.com,本平台相关工作人员将会进行核查。


