Original Author: ANDREW HONG
Original Compilation: TechFlow
Every market cycle is accompanied by the emergence of meme coins. A group of people gather around a certain meme, temporarily driving up the price of an asset (lasting from a day to several months). In the cryptocurrency field, this has become a popular market strategy, covering everything from the blockchain layer to the application layer—because it not only boosts prices, but also attracts attention to the ecosystem. Some projects, such as Avalanche, have even established dedicated meme coin funds.
The boundary between meme coins and other tokens can sometimes be blurred, but the general assumption here is that, apart from the meme, there is nothing else supporting the token. For example, DOGE, as a token, is actually only supported by the image/concept of the Shiba Inu doge. This is different from tokens protected by the Ethereum blockchain, tokens with the complete Uniswap protocol behind them, or tokens with complete collateral stablecoin services.
Meme coins from Farcaster (such as DEGEN) are the latest trend, with the main advantage being that social interaction is completely open. Therefore, I want to use some basic analysis to test social and financial data.
Measuring Meme
I start with an assumption that we can compare the social and financial health of all meme coins through a simple chart:
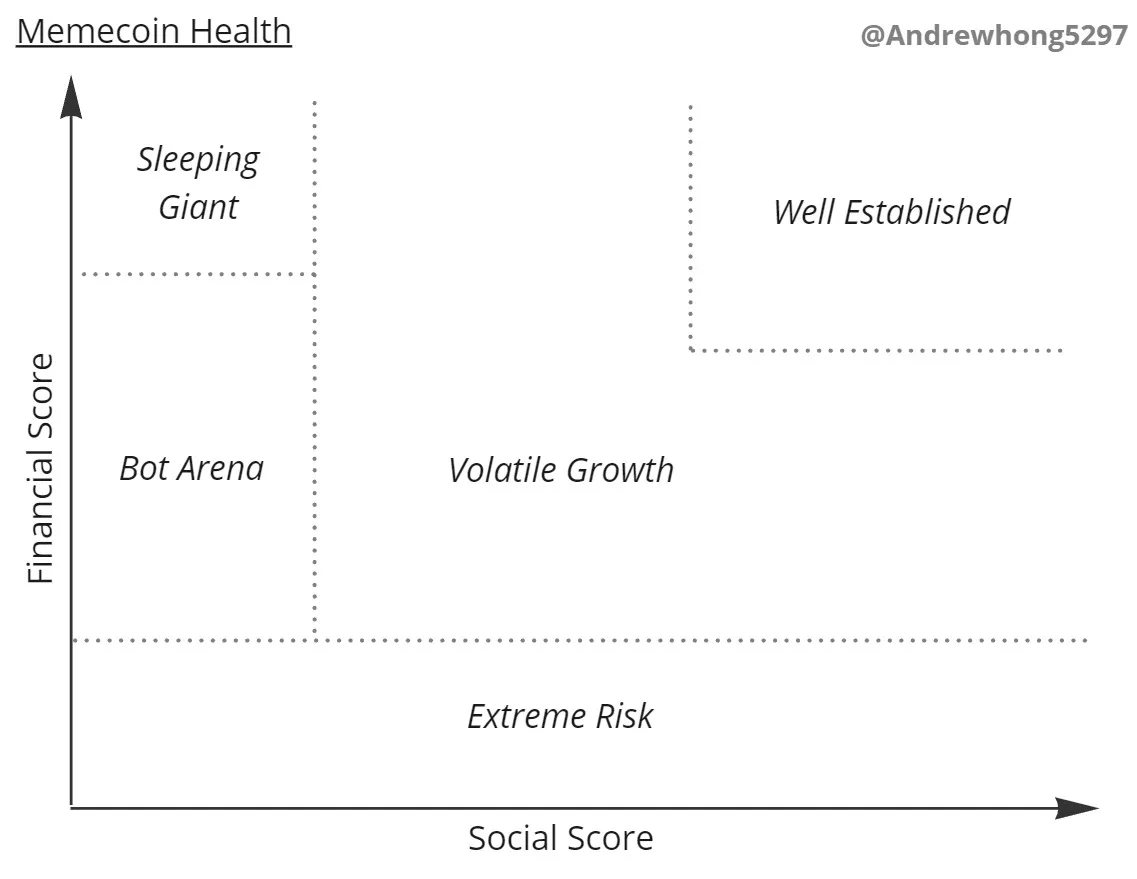
In this chart, I have classified five main areas:
Extreme Risk: Meme coins with low liquidity and trading volume are very risky and are prone to sell-offs (because there may be only a few liquidity providers)
Bot Arena: Most meme coins will never move out of this stage, where thousands of coins (many with the same token name/variants) compete for social and financial attention
Volatile Growth: Meme coins that have broken out of the initial circle must now maintain their momentum and growth. You may see prices fluctuate 100-500% in a day, in different directions, while a bunch of influencers start paying attention to this meme.
Well Established: Leaders will remain at the top of social and financial aspects for the long term and will be clearly distinguished from other meme coins. Weekly figures may not fluctuate much, and attention is sustained as inflows and outflows reach a balance.
Sleeping Giant: Meme coins that have grown rapidly in social and financial aspects, but have not suffered sell-offs, may remain dormant in this corner for a while. They may have formed a DAO, started and dealt with community chaos. At the same time, they hope to become the focus again.
Most meme coins should be trapped in the "Bot Arena," with some attractive meme coins in the "Volatile Growth" segment, and one or two reaching the "Well Established" status. In this process, some may lose social power and become "Sleeping Giants," while others may lose financial support (liquidity) and become "Extreme Risk."
I believe a successful meme coin typically goes through the following stages:
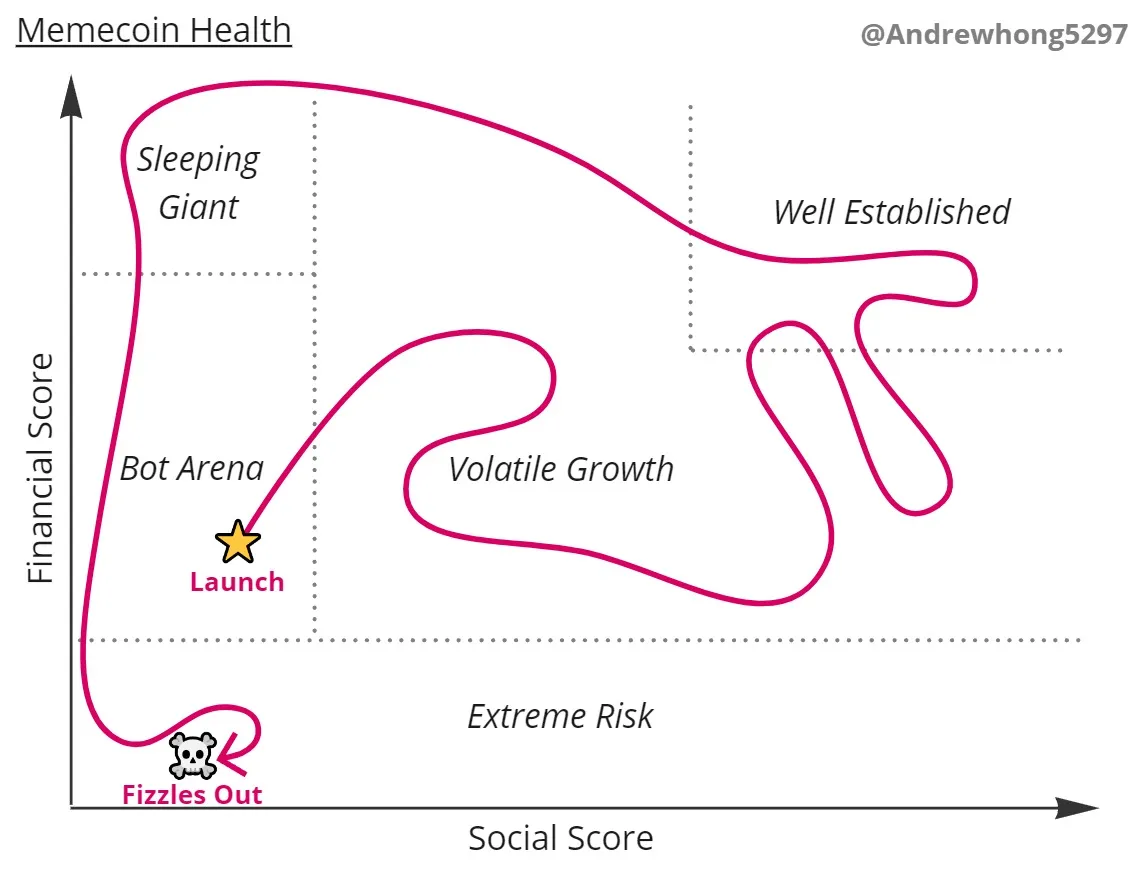
You may see many meme coins being driven by bots/influencers, thus gaining high social scores, but low financial scores (liquidity), leading to sell-offs.
After a lot of data engineering and cleaning, I was able to create this chart about the Farcaster meme coin on Dune:
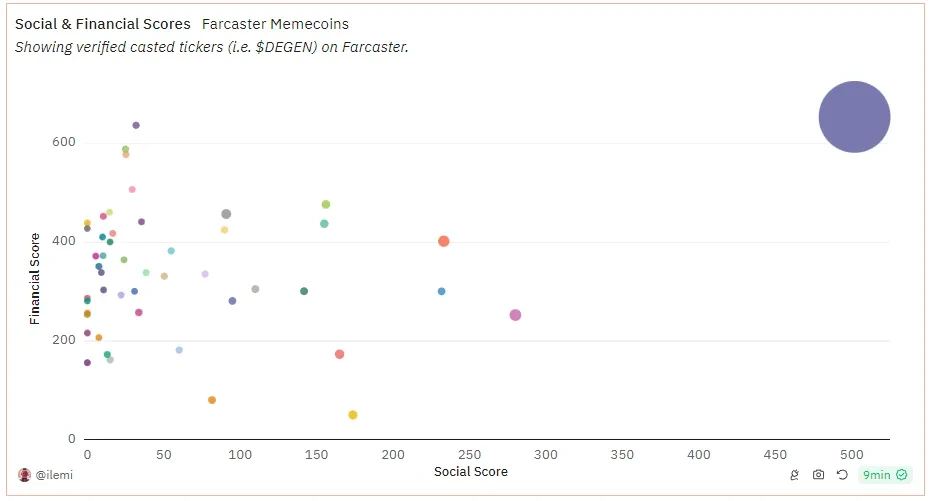
In fact, this aligns very well with my expectations. You can see DEGEN far in the top right corner, and then some others like ENJOY, HIGHER, TN100X, and EVERY in the middle. Everyone else is trapped on the left, vying for attention and liquidity.
It is worth noting that I did not filter out clones/bots here, so the social scores of some meme coins may be biased. This is a direction for future improvement!
Now, let's reverse explain how these two scores were created from the final chart. I will also propose further research questions and provide detailed information about my data sources for those who wish to delve deeper.
The Dune dashboard can be found here, and there are some charts that I did not introduce in this article.
Social Score
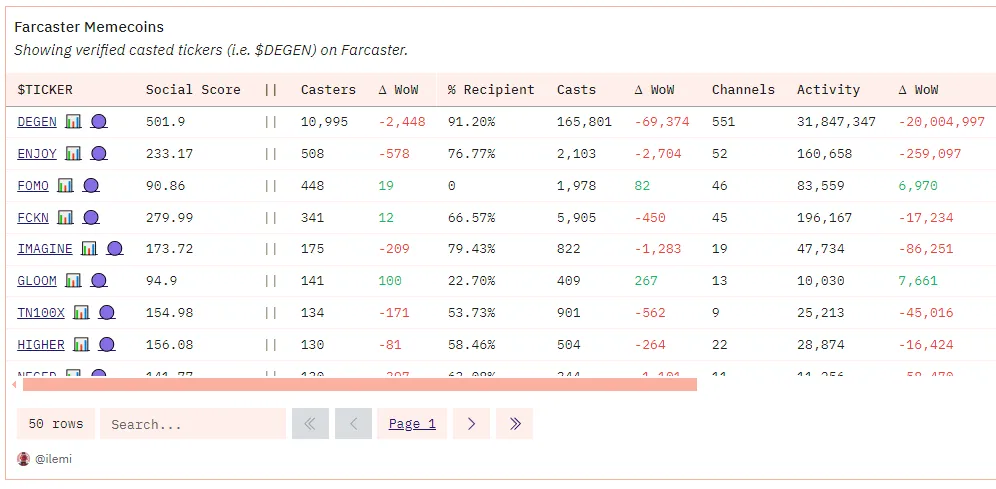
Each score consists of "Base" and "Growth" components. For the social score, we first measure the casts (posts) and engagement related to the token. Therefore, in this approach, "$DEGEN" would be calculated, but "DEGEN" would not.
The following provides our five main columns:
Casters: Number of people who have cast the given token
Receivers: Percentage of casters who have previously received the token
Casts: Number of times the given token has been cast
Channels: Number of channels where the given token has been cast
Activity Level: Engagement (likes + replies) plus the cube root of the number of casts multiplied by the cube root of the number of channels.
The overall social score is based on the "Activity Level" and is multiplied by the week-to-week change in the number of casters and receivers. The idea here is that if you see a significant increase in the number of people casting a given token and the number of those people buying/receiving the token, it is an extremely healthy sign.
Overall, it looks like this in the table:
Financial Score
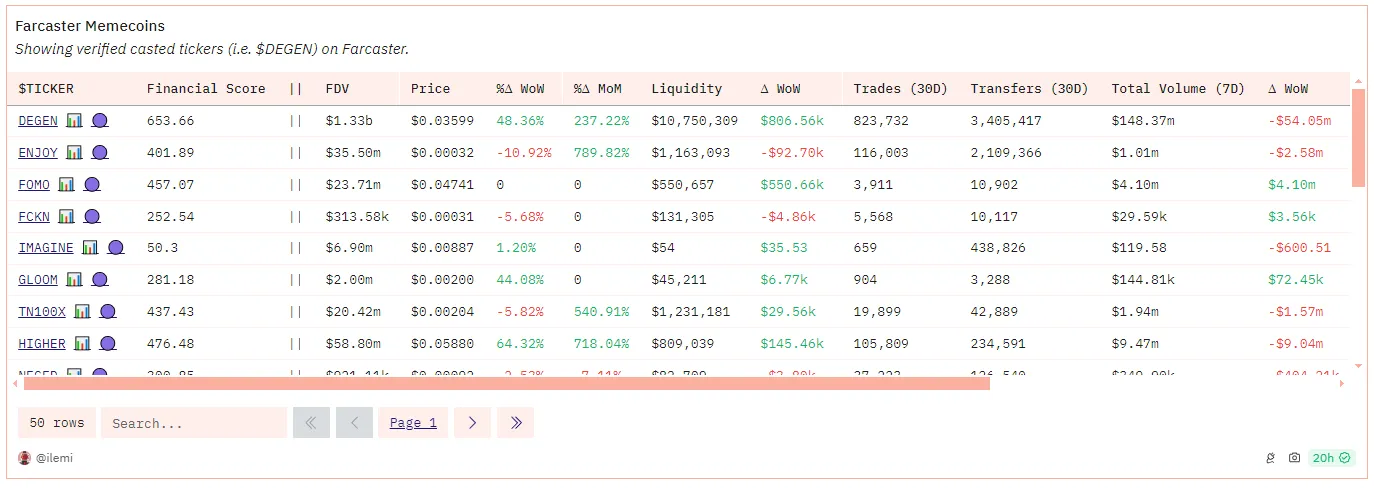
Here are the main financial indicators:
Fully Diluted Valuation (FDV): Total supply multiplied by price
Price: Latest price based on DEX trades
Daily, Weekly, Monthly Price Growth: Percentage change in price on a daily, weekly, and monthly basis
Liquidity: This is non-token liquidity, meaning for the DEGEN-WETH pool, we only calculate the WETH part. This gives us a more stable indication of how much good liquidity a given token has.
Trades: Number of DEX trades in the past 30 days
Transfers: Number of erc20 transfers in the past 30 days
Total Trading Volume: USD trading volume of DEX trades in the past 7 days
The "Base" of the financial score is its non-token liquidity and DEX trading volume, and the "Growth" part is based on the weekly change in liquidity.
Overall, it looks like this in the table:
Follow-up Questions
Here are some brainstorming questions I would like to see people delve into from here:
How to score casters for clones/bots? Weighted based on the token value in the wallet? Dividing casters into levels based on relationships with known clusters and/or communities?
Classifying the volatility of social and financial growth—what is the correlation between them? Is there any time delay or one-way dependency?
Are the same circles/types of people driving the initial growth wave? How do early, timely, and late participants in memes differ? Does it relate to user levels?
What happens when a meme "shifts"? What or who drives this shift?
To what extent do people have social or financial interests? Do people cast more/less after buying/selling a certain token?
What is the average lifespan of a meme? How long is it in social and financial aspects respectively?
免责声明:本文章仅代表作者个人观点,不代表本平台的立场和观点。本文章仅供信息分享,不构成对任何人的任何投资建议。用户与作者之间的任何争议,与本平台无关。如网页中刊载的文章或图片涉及侵权,请提供相关的权利证明和身份证明发送邮件到support@aicoin.com,本平台相关工作人员将会进行核查。


