Daily Sharing
After a drop to 62749 last night, Bitcoin quickly rebounded to above 65000, and then mainly maintained oscillation around 64000 today. Currently, it is likely in the second wave of rebound in the 1-hour timeframe.
Overall, the current trend is actually in the midst of a correction after the last rise of Bitcoin and altcoins. The duration of this correction can be long or short, but the bull market is inevitable and has not ended. The overall downside potential is limited. It's not clear why many people are thinking about a major crash at this point. In reality, the market is mainly running the correction in a range-bound manner. Therefore, it is advisable to maintain a bullish view overall until the appearance of a true breakthrough.
BTC Medium and Long Term
Daily Chart:
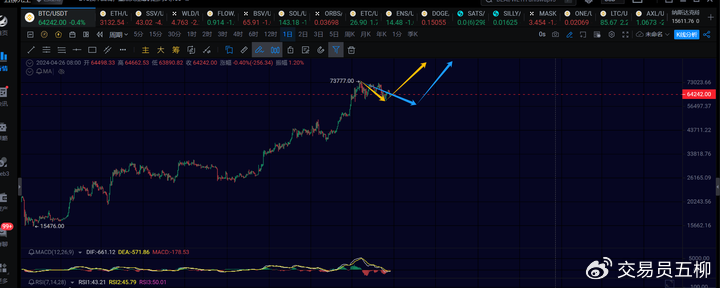
On the daily chart, there are two possibilities for the current structure of Bitcoin that have not been fully confirmed. The first possibility is that the correction from 73777 to around 59600 on April 19 has ended, and Bitcoin is currently in a new uptrend at the daily chart level, as indicated by the yellow arrow in the image above. The expected target for the new uptrend is above 85000.
The second possibility is that a new uptrend at the daily chart level has not yet begun, and Bitcoin is still in the process of the previous correction from 73777. In this case, after the completion of the 4-hour rebound, Bitcoin may retest around 59000 or dip into the range of 56000 to 59000. After the retest, a new uptrend at the daily chart level may begin, as indicated by the blue arrow in the image above. The probability of reaching the lower levels expected by many traders, such as 55000 or even lower, is very low. On the surface, 51000 to 55000 is the support of the daily chart's Vegas channel, and there is a certain probability of a retest. However, it is not easy to touch these levels in the middle of a bull market.
Regardless of whether it is the first or second scenario, the ultimate direction for Bitcoin is definitely to rise again after completing the correction and then break through 73777. Since this direction remains unchanged, there is no need to hesitate in trading. As long as it dares to continue falling, you just need to find opportunities to buy at the bottom. Following the overall trend in trading is not difficult and is the easiest way to profit.
In the market, those who lose the most money are often the ones who, after a decline, do not reverse their bearish view and insist on shorting in the short term. When the upward trend finally emerges, they end up in a bad position or they chase after the rise when it is about to retrace, and then collapse. Or they like to trade every wave of both the rise and the fall. They try to close their long positions at the highest point of each short-term rise, then smoothly short, and then close their short positions at the lowest point, and then buy near the low point, only to close their long positions at the highest point of the short-term rise. Once they encounter a one-way trend, they basically end up in a very bad position. Therefore, it is important to trade in the direction of the overall trend. Whatever the direction of the major trend is, that's the direction you should take in your trades.
4-Hour Chart:
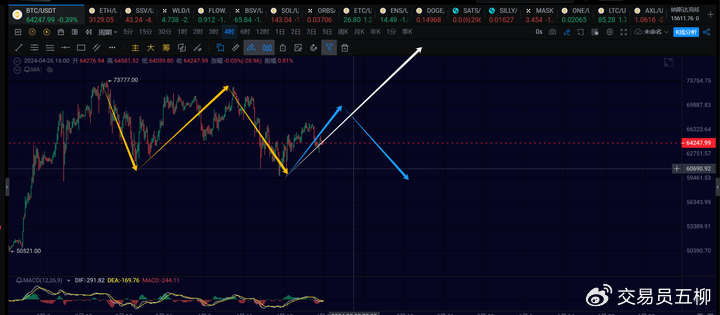
At the 4-hour chart level, the ongoing uptrend from around 59600 has not yet ended. It is expected to reach around 68000 to 69000 again. After this 4-hour uptrend is completed, we can closely observe whether it can break through 70500. If it fails to do so, there will be another 4-hour downtrend to retest around 59000 or dip into the range of 56000 to 59000, as indicated by the blue arrow in the image above. This would mean an extension of the overall daily chart level correction.
If the 4-hour rebound directly breaks through 70500, then we will see a new uptrend at the daily chart level to new highs, as indicated by the white arrow in the image above.
BTC Short Term
Due to the rapid changes in the market, this article can only make predictions based on the market conditions at the time of publication. Short-term traders should pay attention to the latest market changes and use this information as a reference only.
1-Hour Chart:
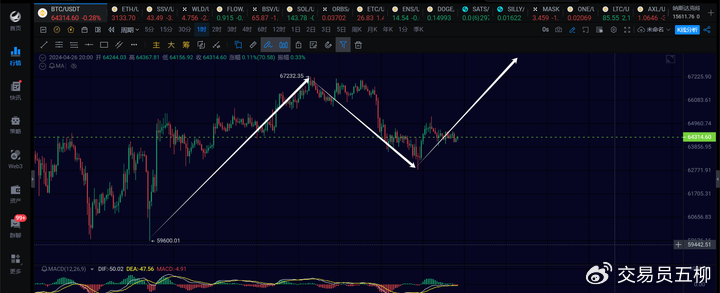
At the 1-hour chart level, the second 1-hour downtrend has likely ended near the low point of 62794 yesterday. There is a high probability of a third 1-hour uptrend, with the first target around 67232 and the second target around 69000. Specific attention should be given to the strength of this 1-hour uptrend after it unfolds.
15-Minute Chart:
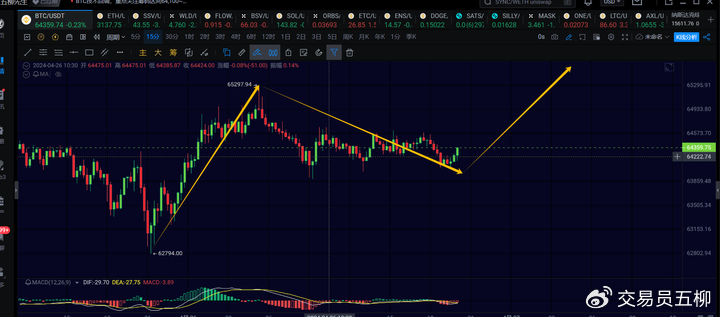
At the 15-minute chart level, after a new 1-hour rebound last night, Bitcoin is currently in the process of the second 15-minute downtrend. This downtrend is likely coming to an end, and there should be a third 15-minute rebound overall. If the third rebound directly breaks through 67000, there will be a fifth one without a retracement. Specific attention should be given to the upward strength.
ETH
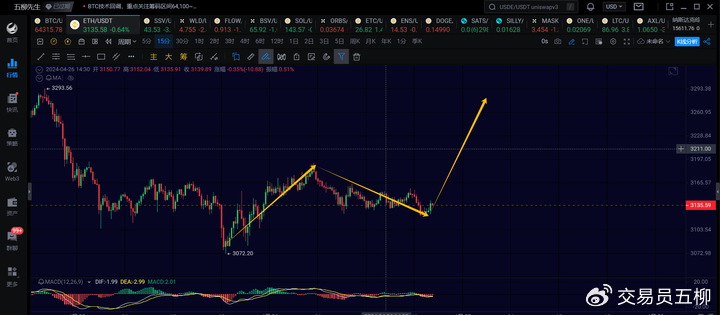
For Ethereum, the second 15-minute downtrend retraced to around 3120, and it is currently important to watch the support around 3100 to 3120. If it holds, there will be a third 15-minute uptrend to above 3200. Specific attention should be given to the upward strength. If it falls below 3100 again, consider another retest around 3070.
Trend Direction
Weekly Chart Level: Upward direction, currently an extension of the weekly rebound from 15476. Pay attention to the subsequent daily chart situation to determine when it will end.
Daily Chart Level: Upward direction, there is a certain probability that the daily chart correction has ended, but it cannot be confirmed at the moment. It can only be determined based on the strength of the 4-hour rebound in the near future.
4-Hour Chart Level: Upward direction, currently in a 4-hour rebound. Whether it can break through 70500 will be an observation point for the daily chart structure.
1-Hour Chart Level: Upward direction, likely in the process of the third 1-hour uptrend. Observe whether it can break through 67000 again.
15-Minute Chart Level: Upward direction, currently likely to run the third 15-minute uptrend. Observe its upward strength.
Feel free to follow my public account for discussions and exchanges:

The article is time-sensitive. Pay attention to the risks. The above is only personal advice and is for reference only!
免责声明:本文章仅代表作者个人观点,不代表本平台的立场和观点。本文章仅供信息分享,不构成对任何人的任何投资建议。用户与作者之间的任何争议,与本平台无关。如网页中刊载的文章或图片涉及侵权,请提供相关的权利证明和身份证明发送邮件到support@aicoin.com,本平台相关工作人员将会进行核查。


