On the evening of April 2nd, AICoin researchers conducted a live graphic and textual sharing session on AICoin PC-end - Group Chat - Live titled "Automated Trading Techniques for SAR Indicator (with Membership Giveaway)". Here is a summary of the live content.
I. Understanding SAR
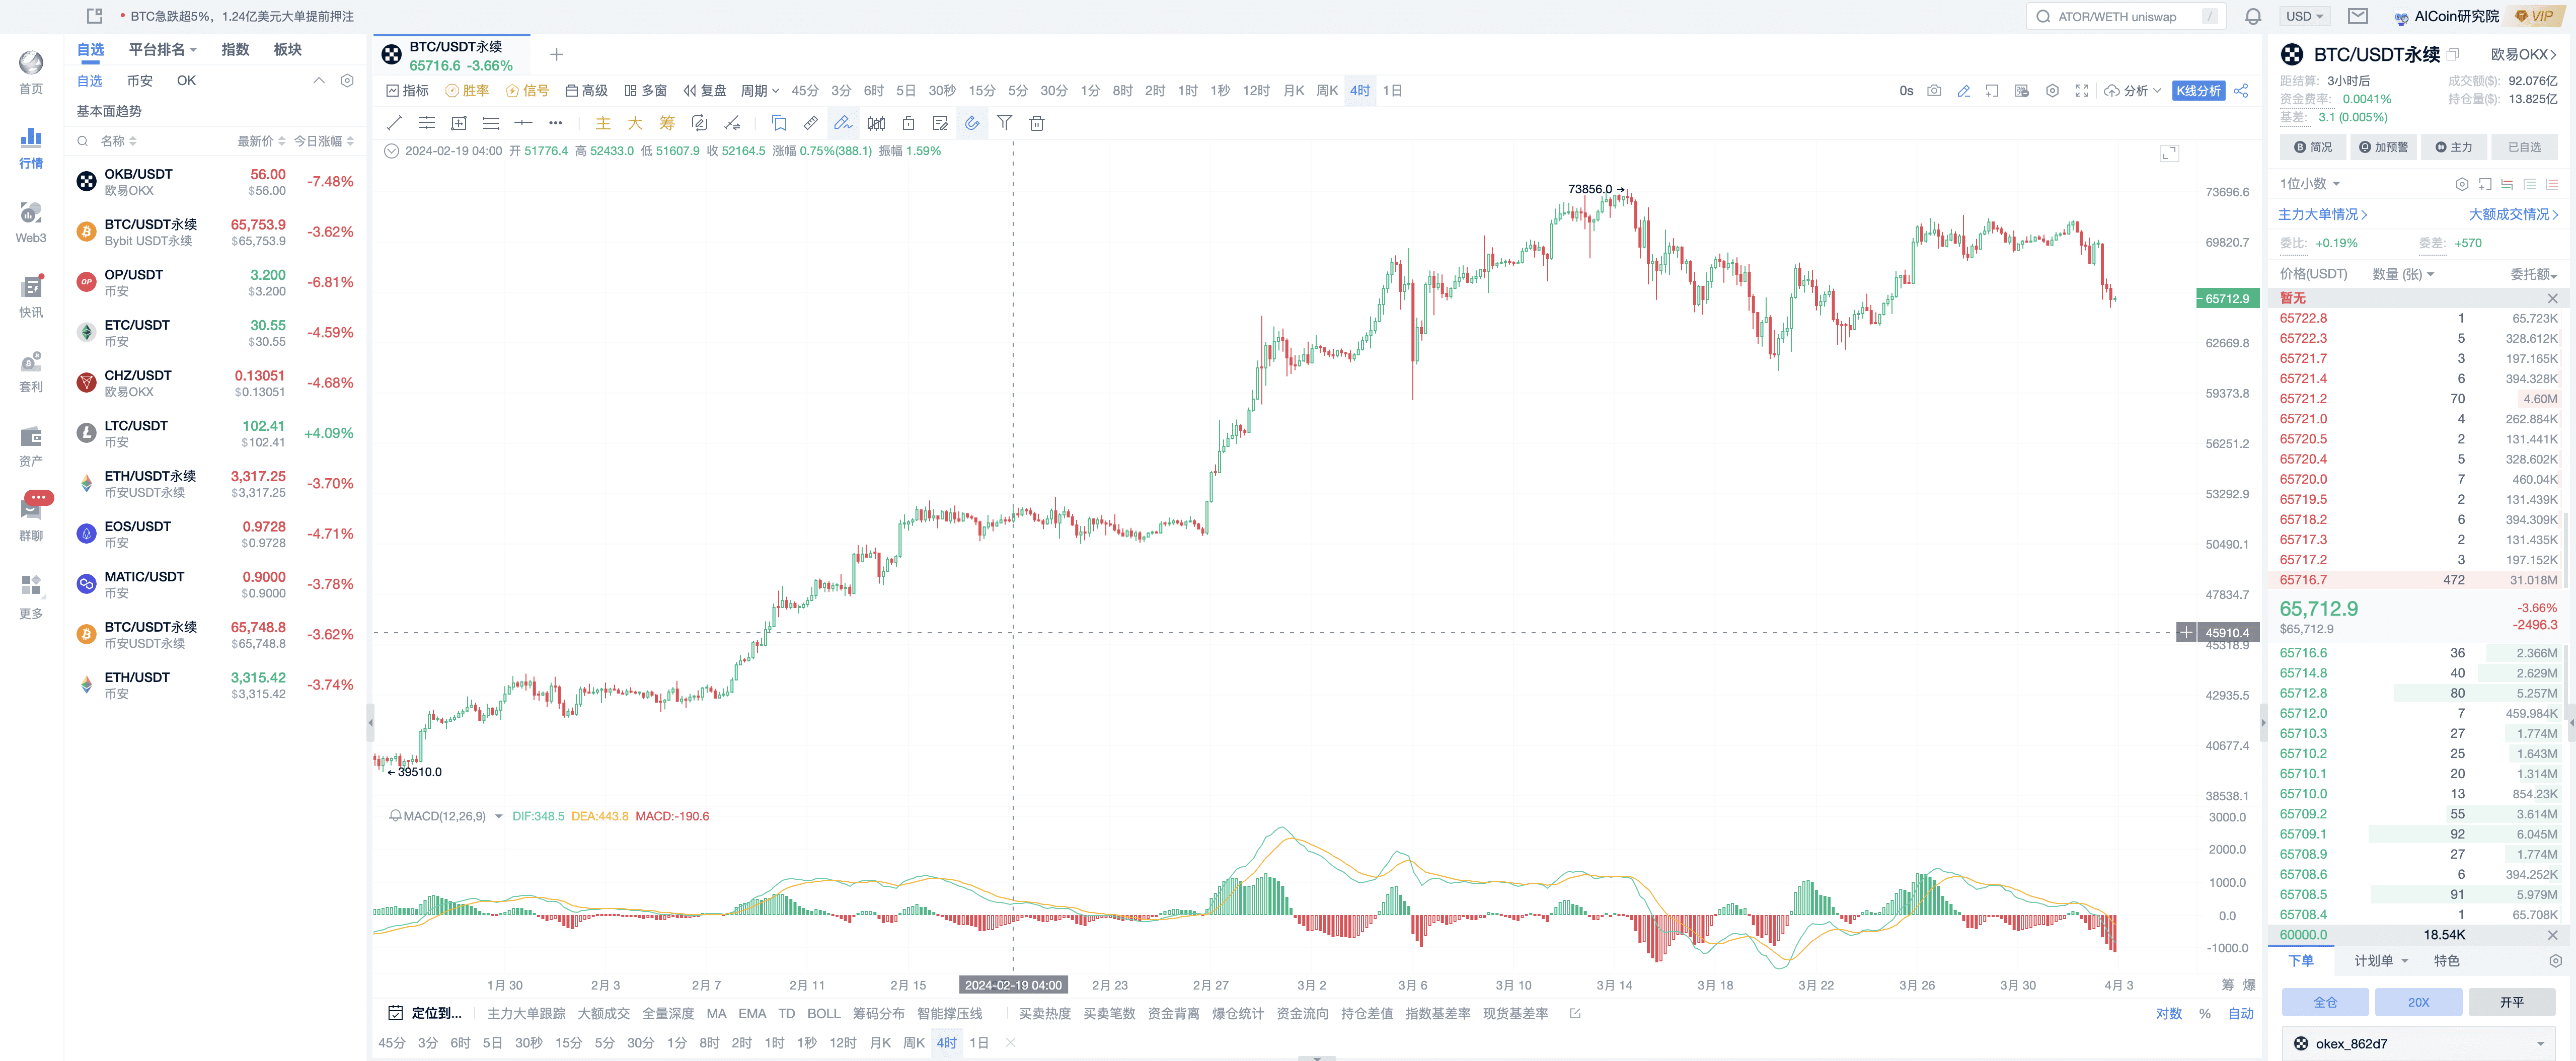
Its function: Identifying trend reversals, it is a trend-tracking indicator suitable for finding the best entry and exit points for trading.
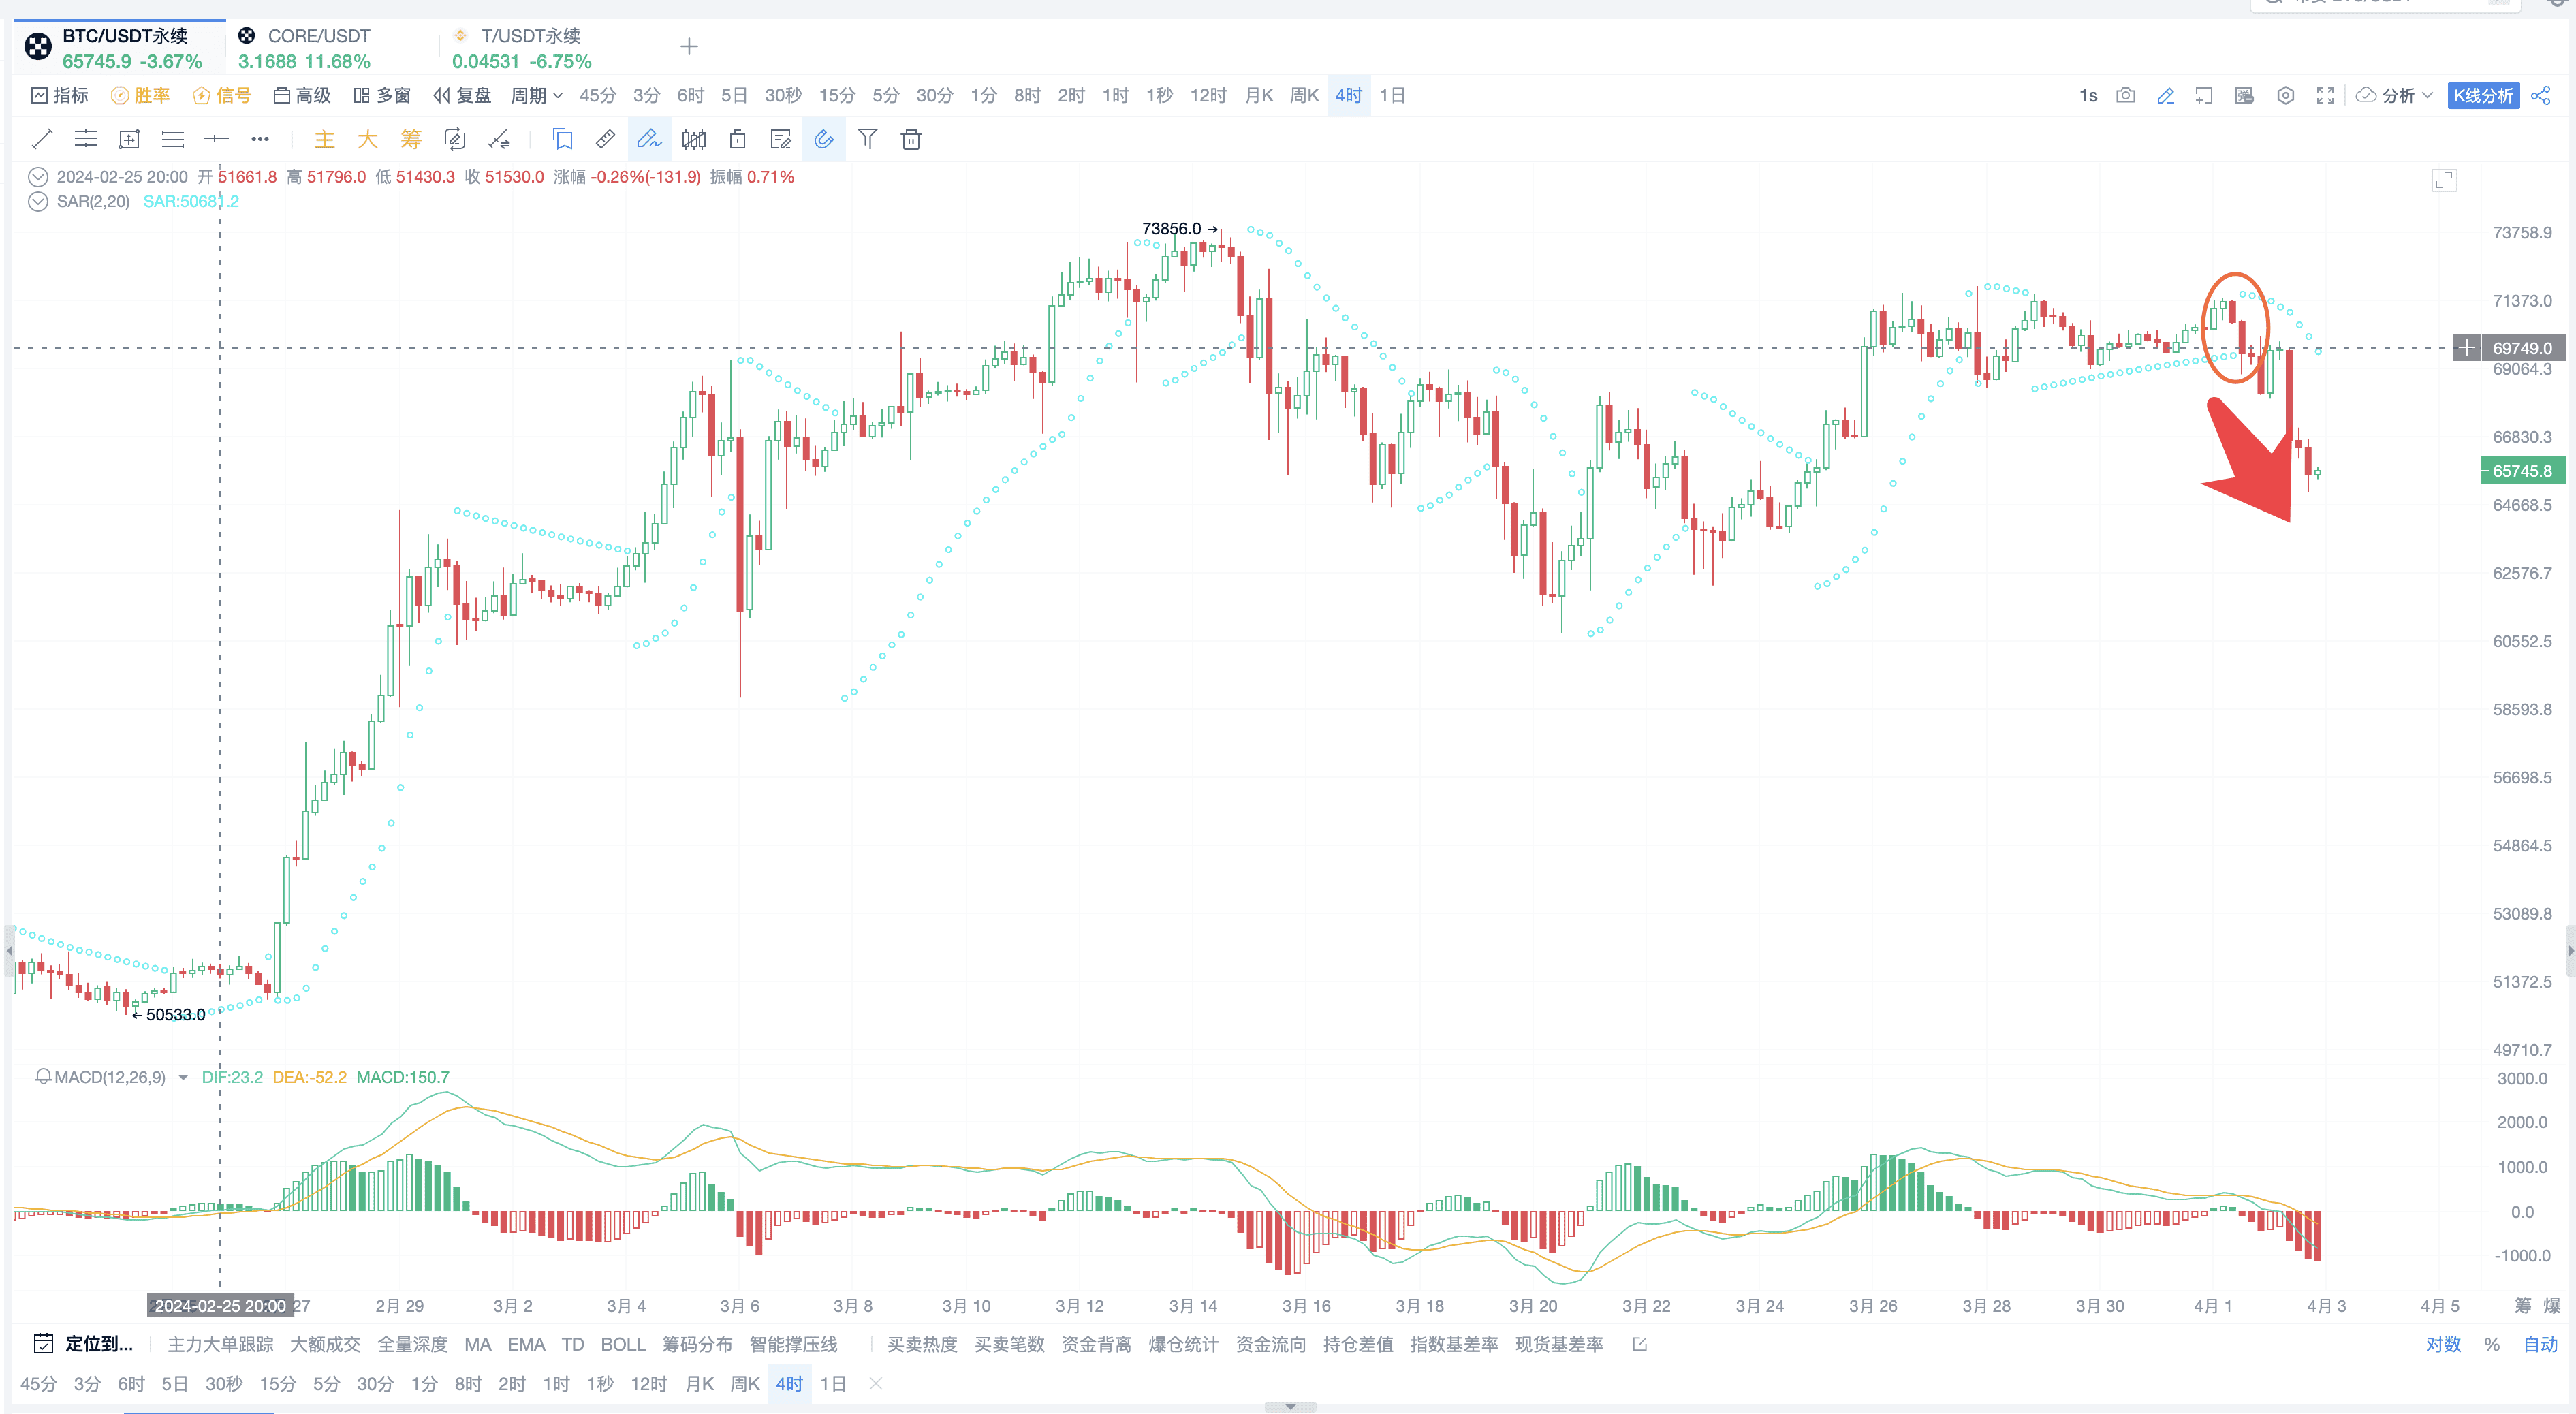
For example: Let's open the OK platform and take a look at the SAR indicator, which can fully capture the trend reversal!
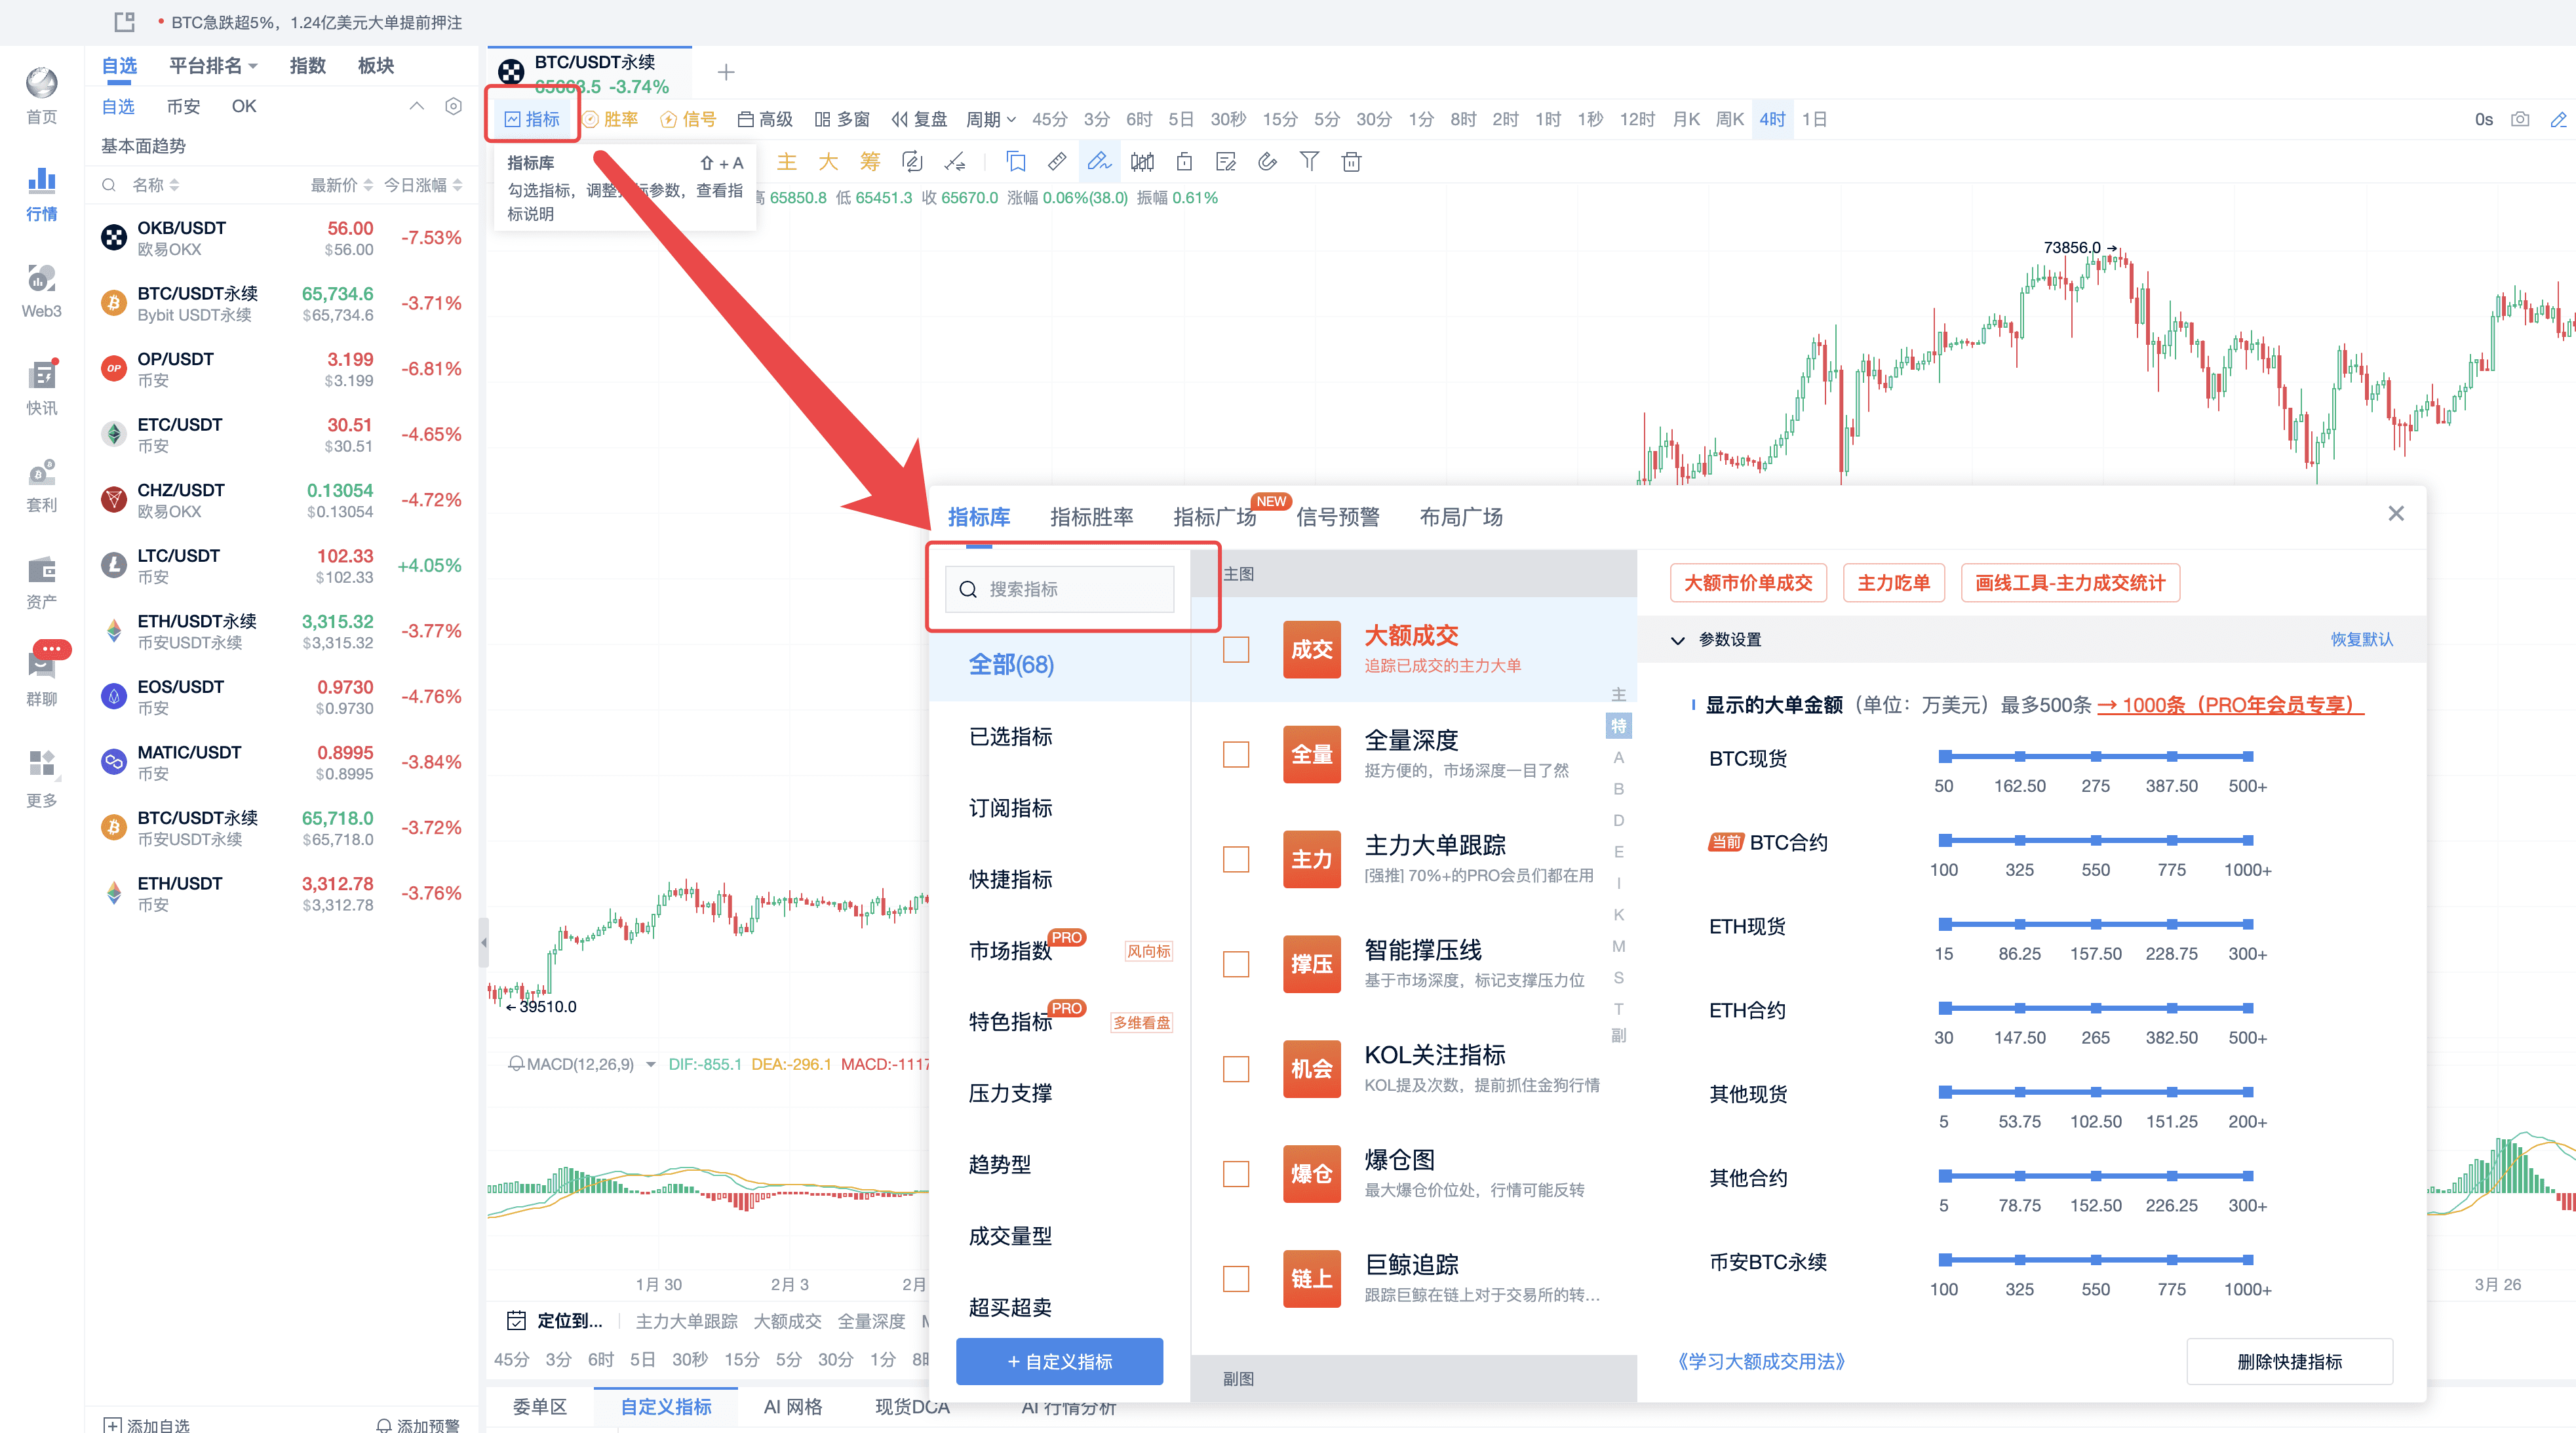
Search for SAR and select it.
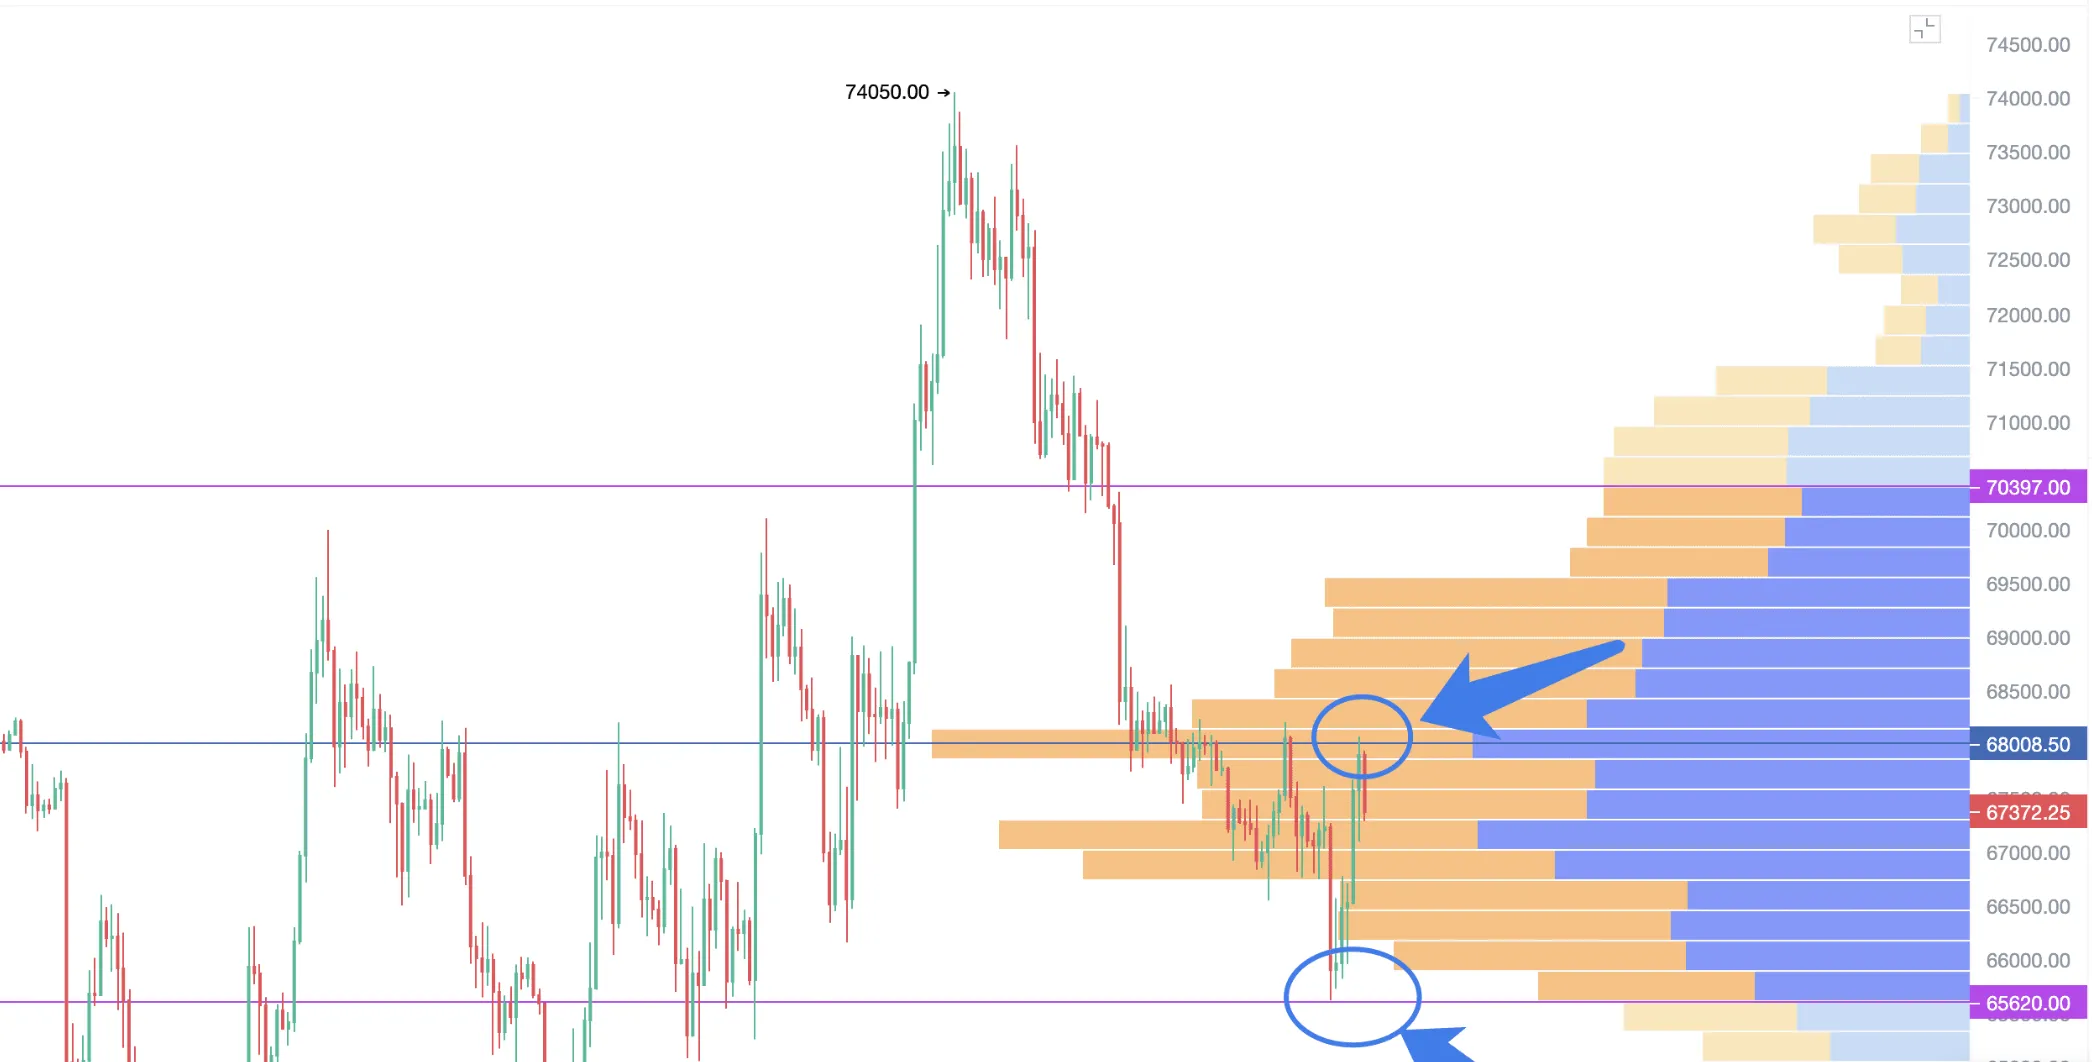
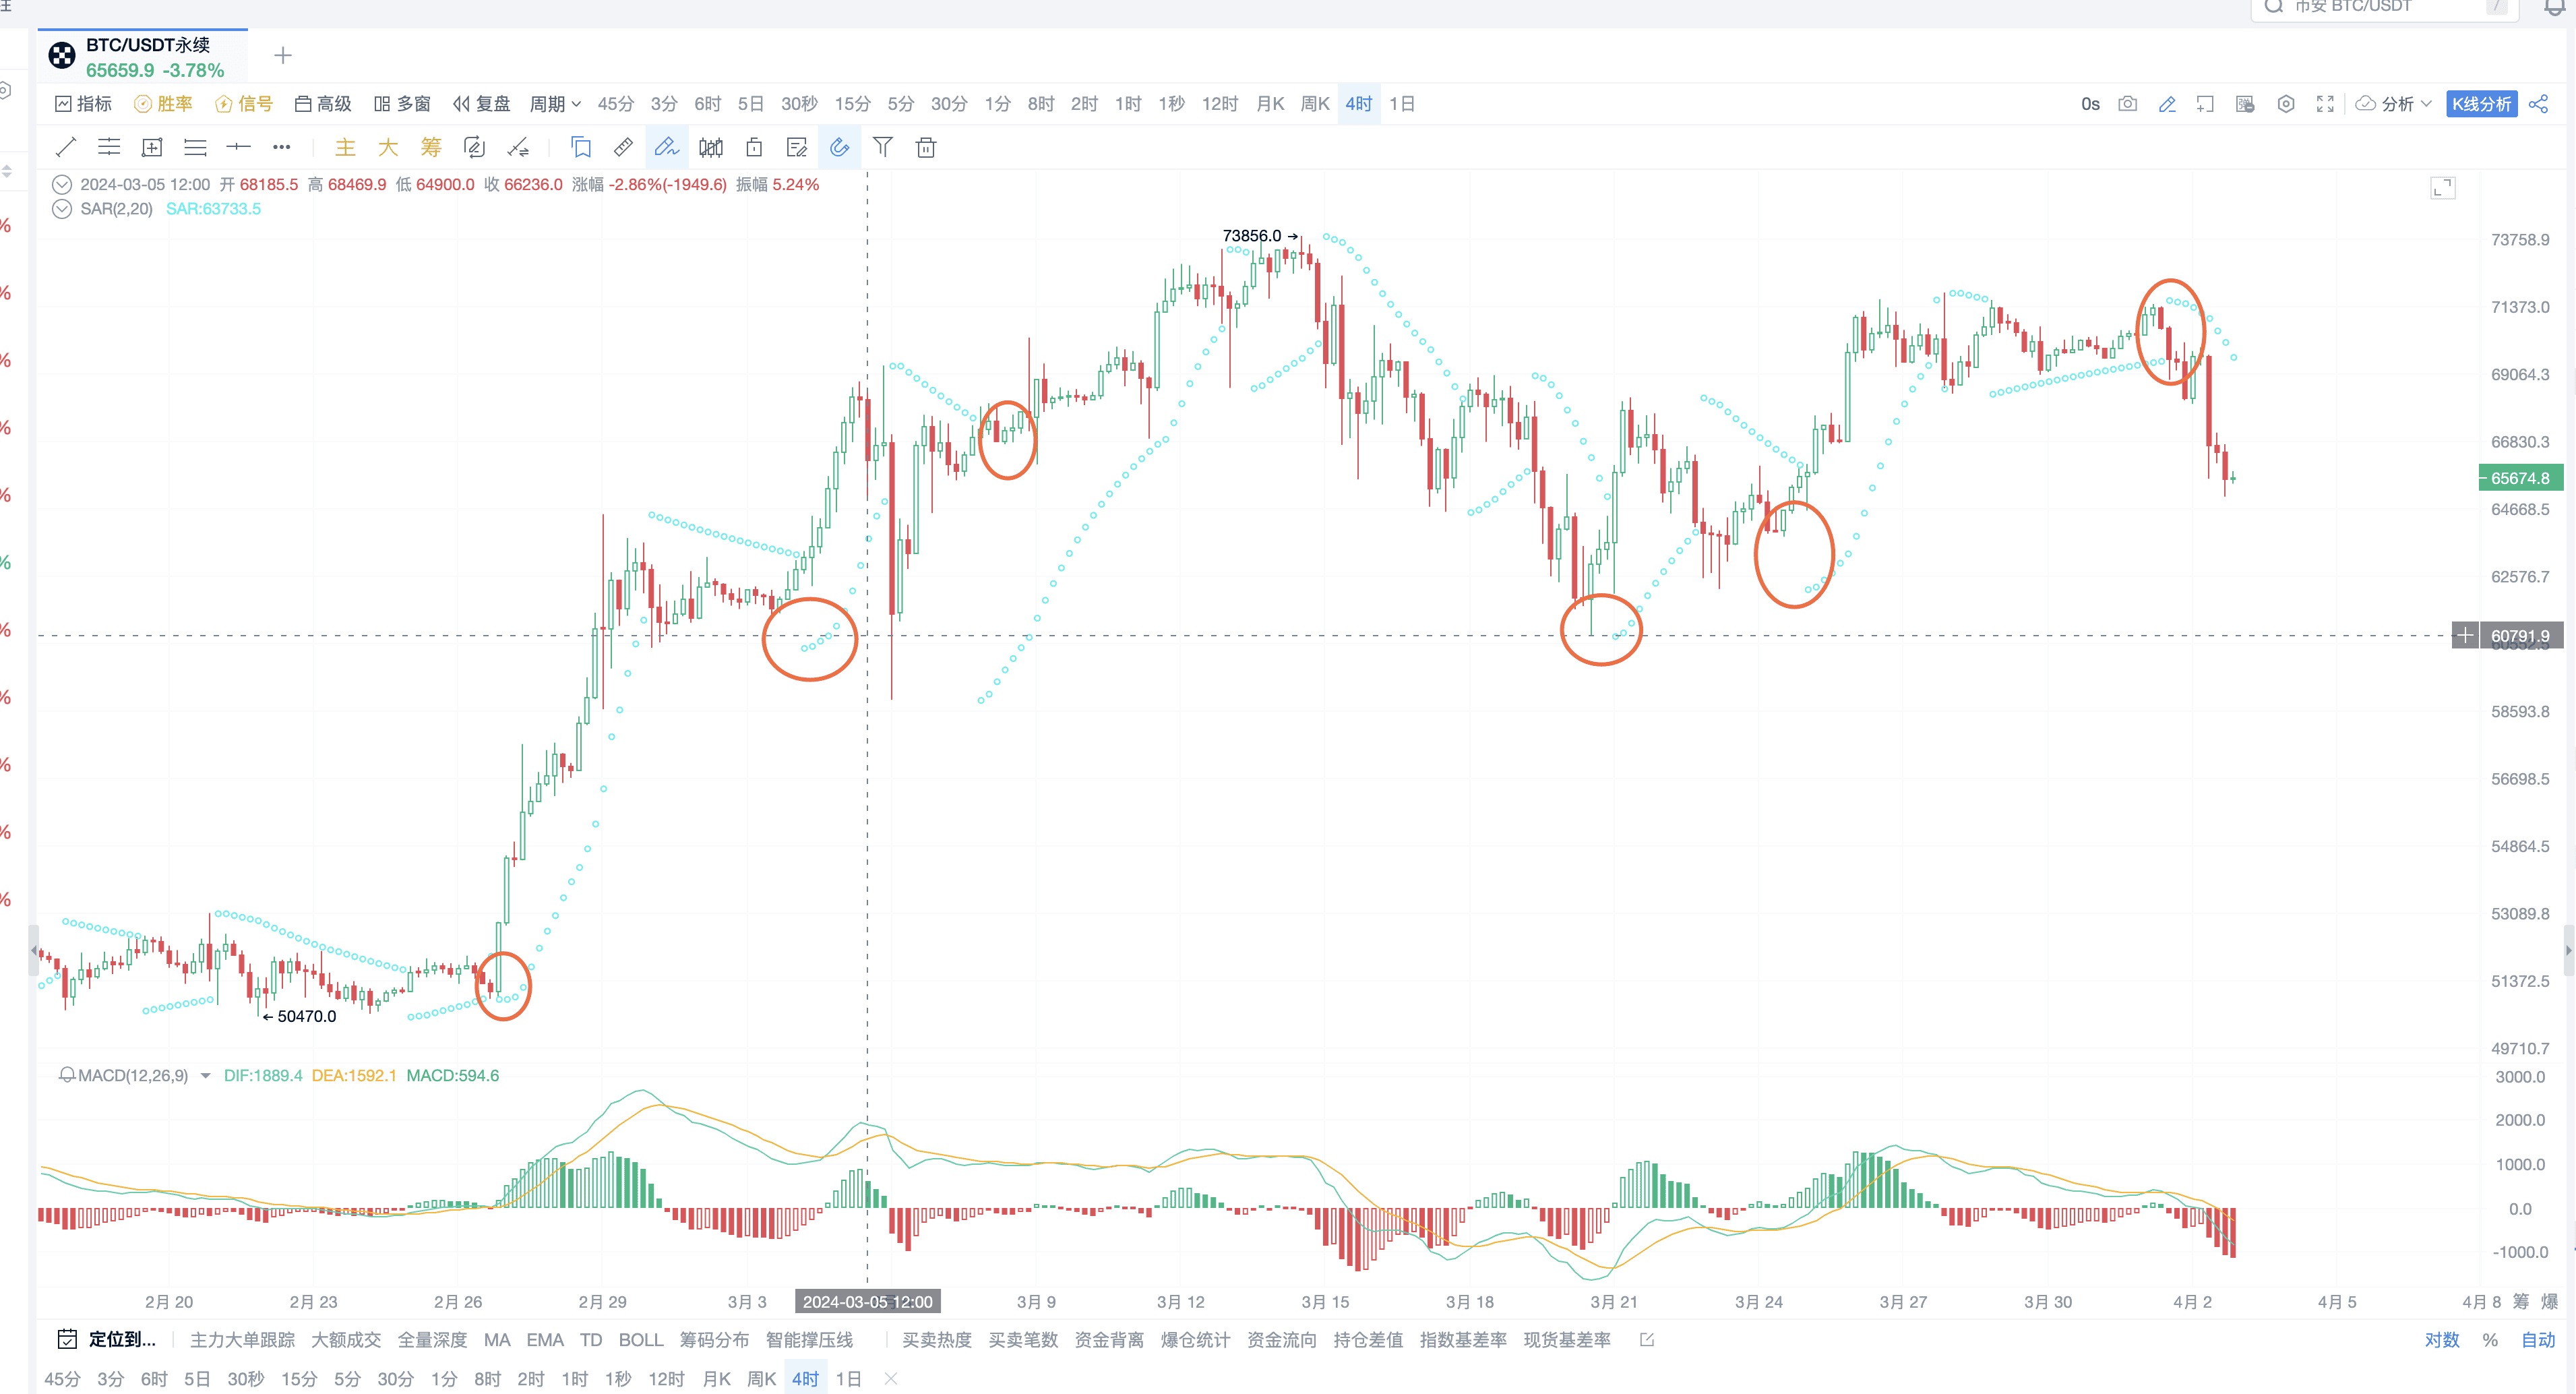
The positions shown in the image are all excellent reversal points.
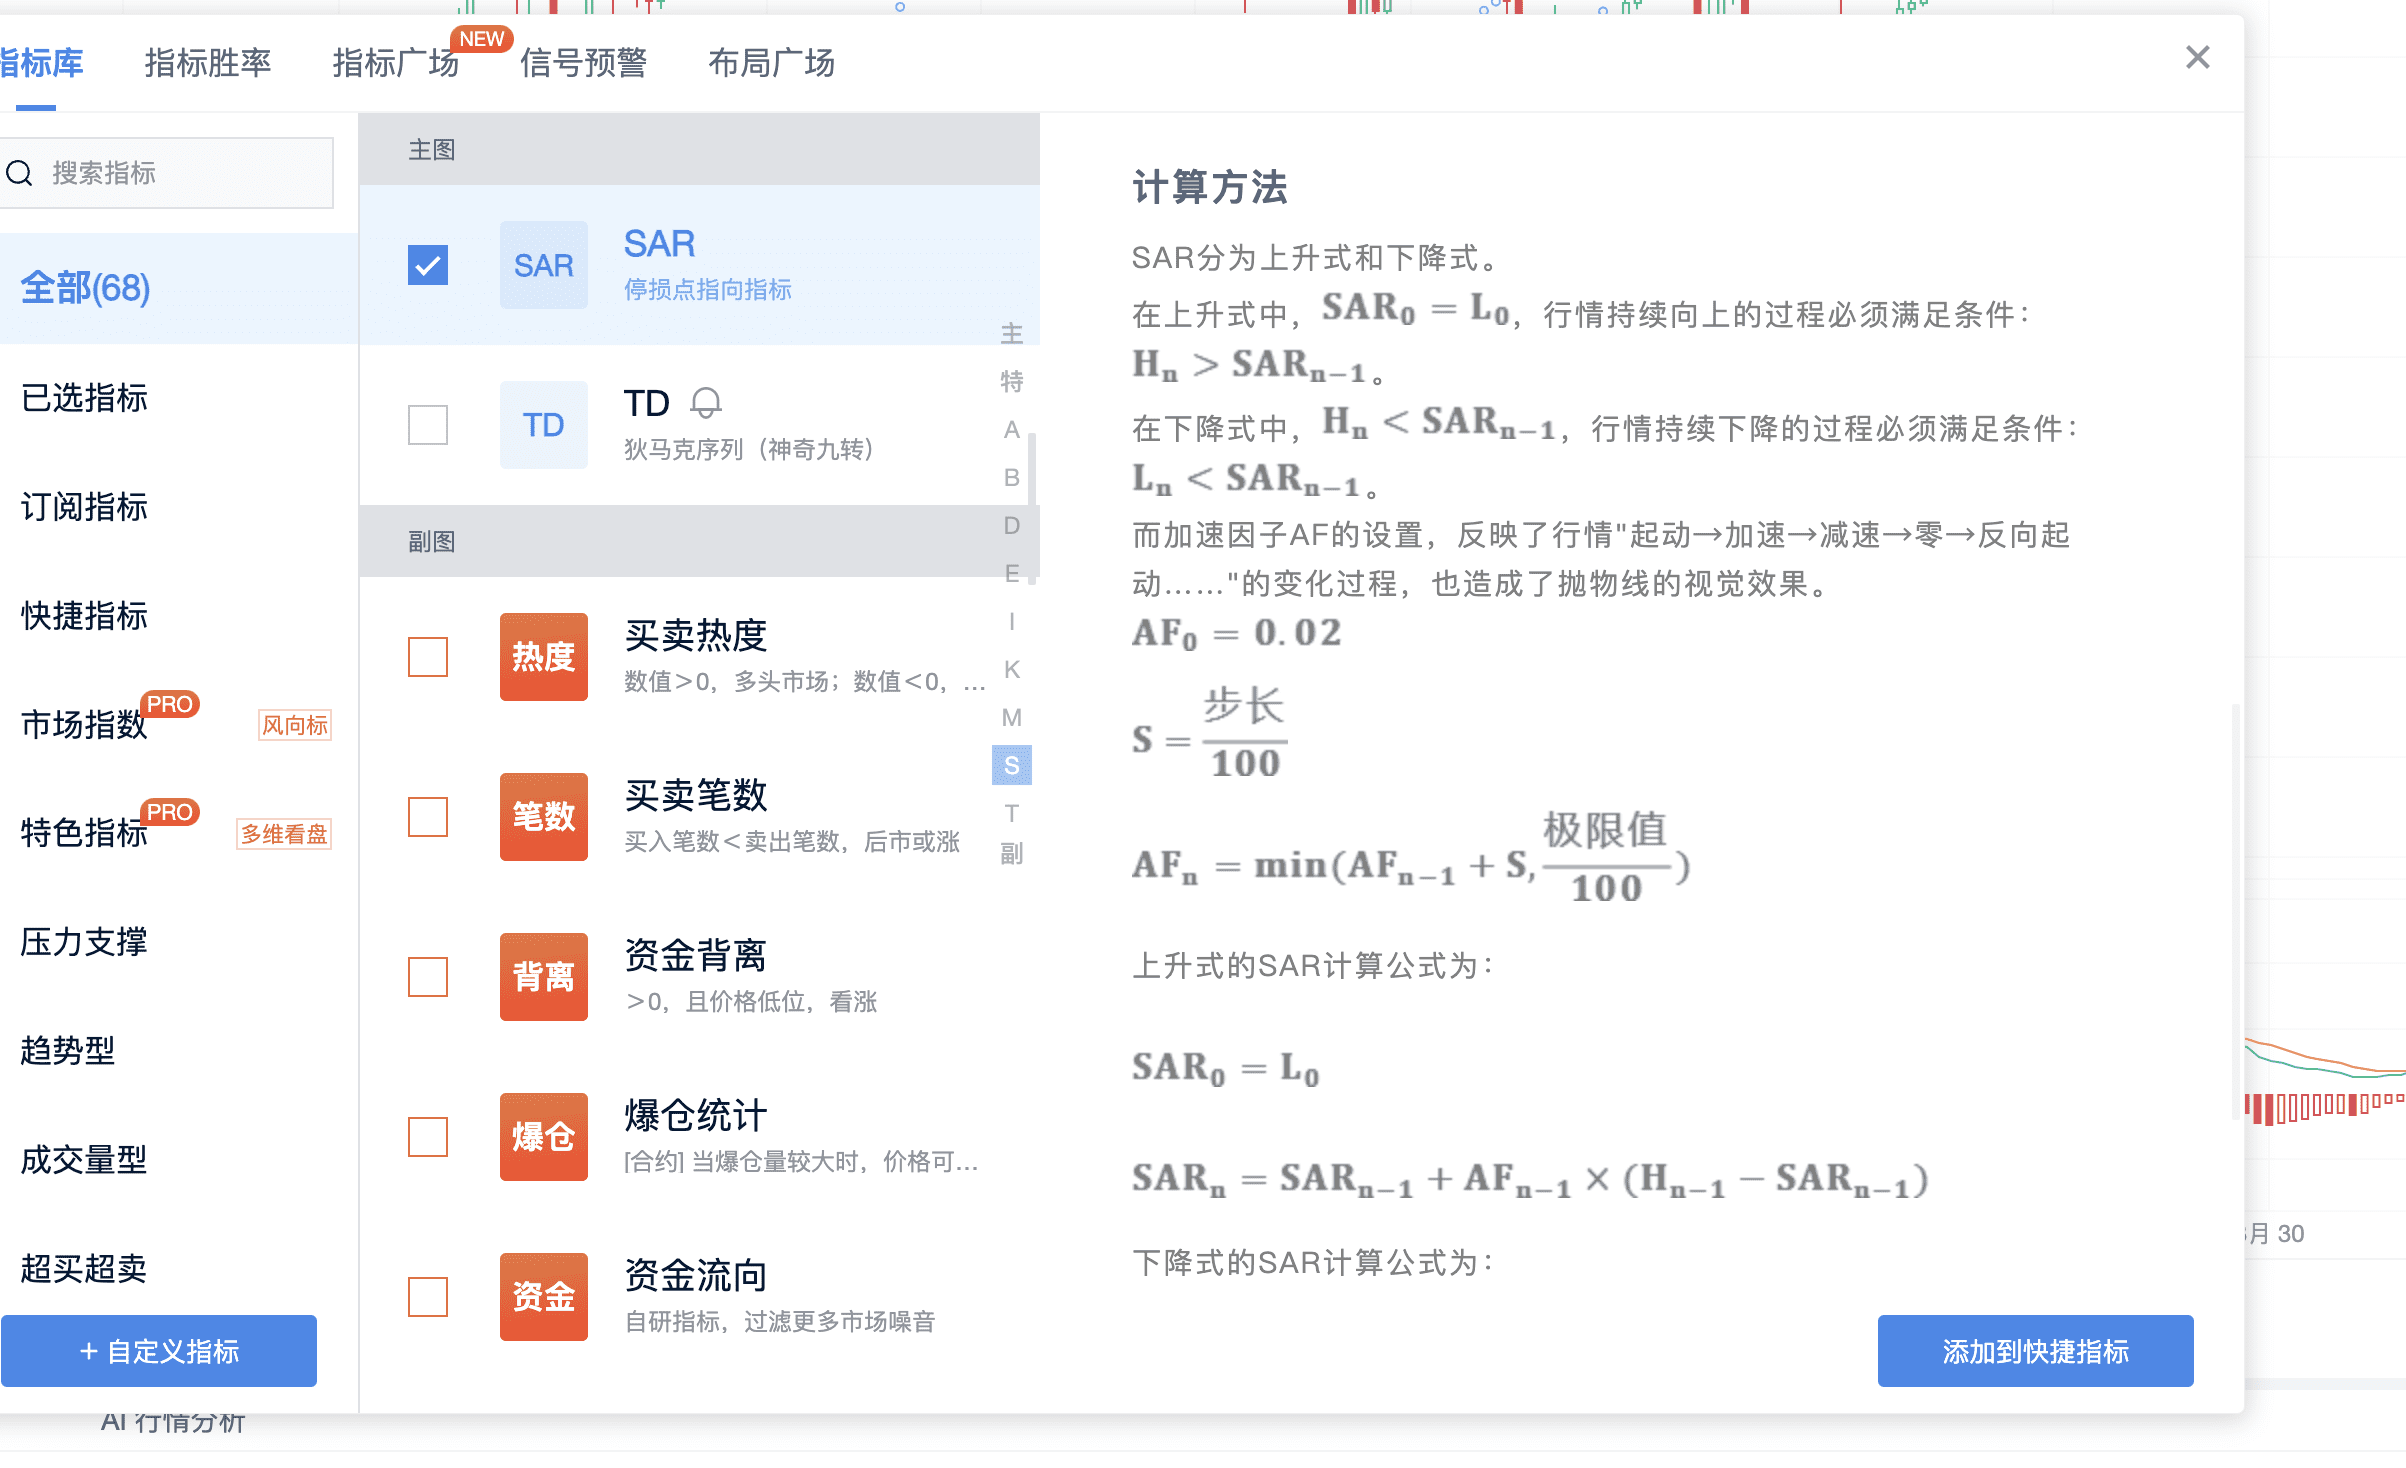
SAR Introduction
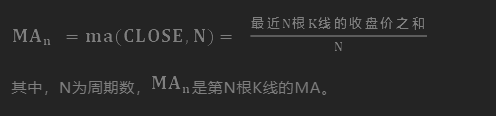
SAR is a trend-tracking indicator composed of a series of points. It stands for Stop And Reverse, indicating that when the price reaches these points, trading direction should be stopped and reversed. The calculation method for SAR can be understood from the following image.
Popularization of SAR Basics:
- When the price rises, SAR points are below the price, reflecting support levels.
- When the price falls, SAR points are above the price, reflecting resistance levels.
- SAR can serve as relevant price support and resistance levels. When the price crosses SAR points, it indicates a trend reversal, and the trading direction should be adjusted. It can identify both support and resistance as well as reversals.
SAR Analysis of Coins (1) SAR Analysis Core 15 minutes
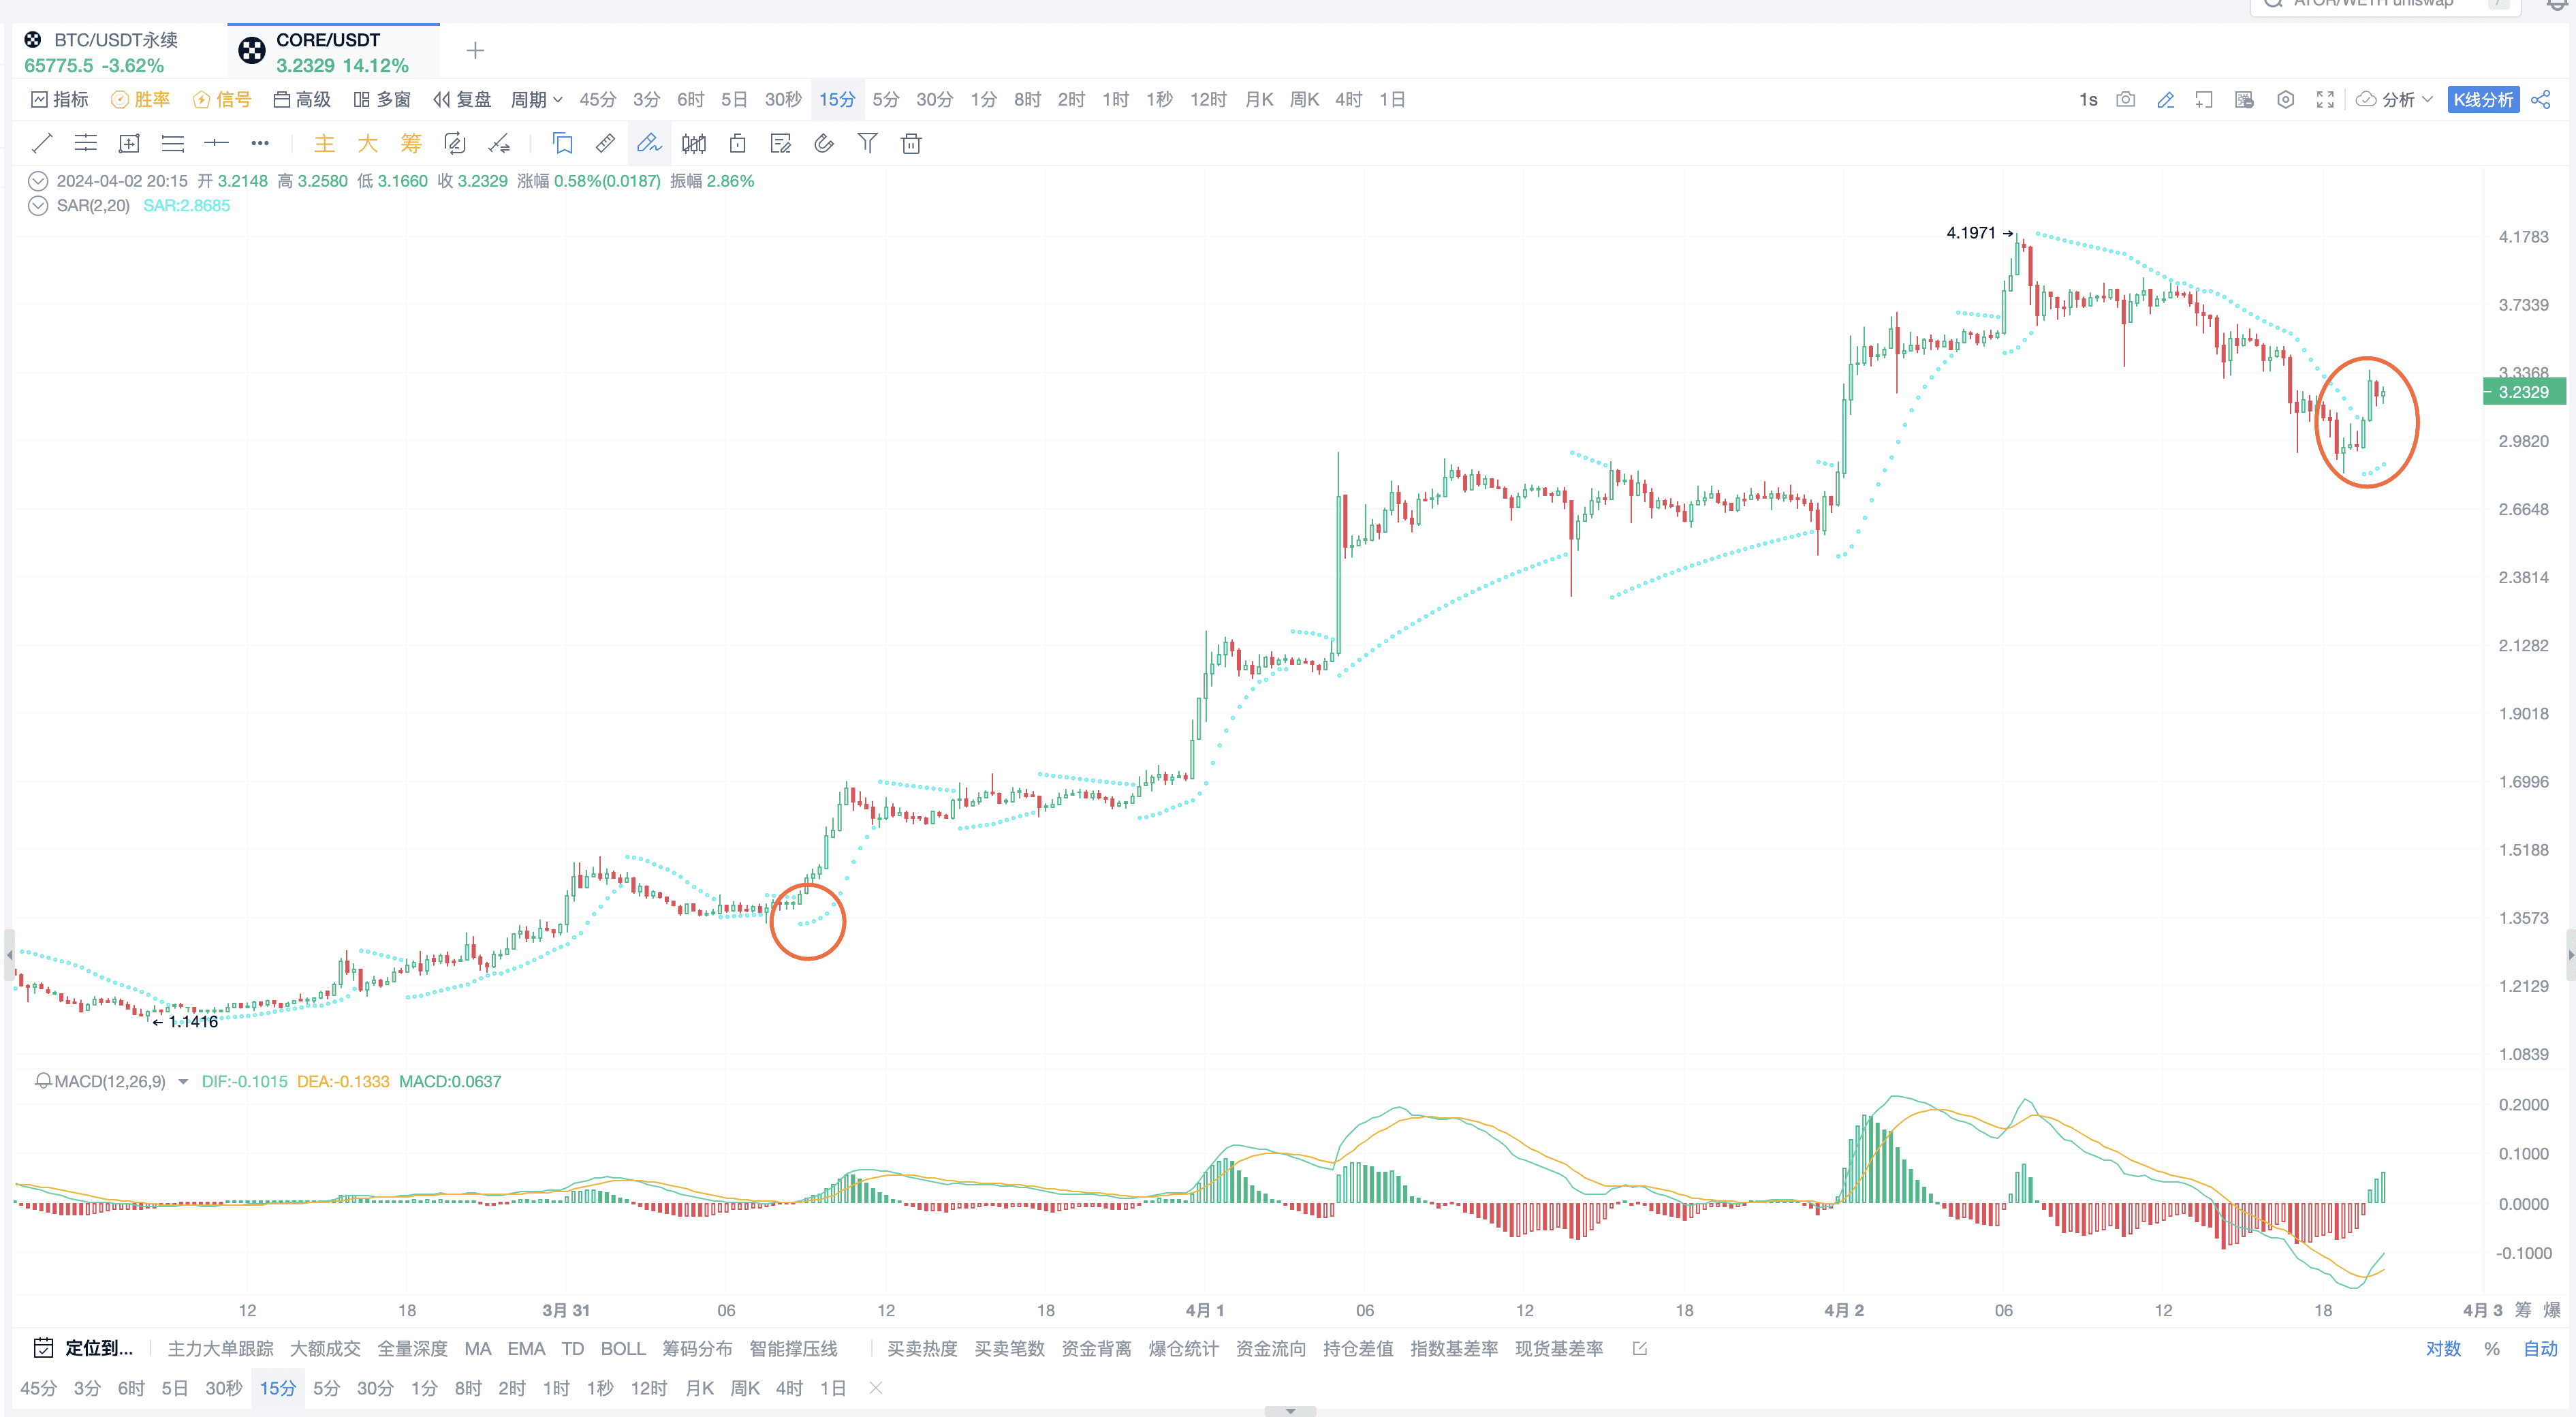
5 minutes
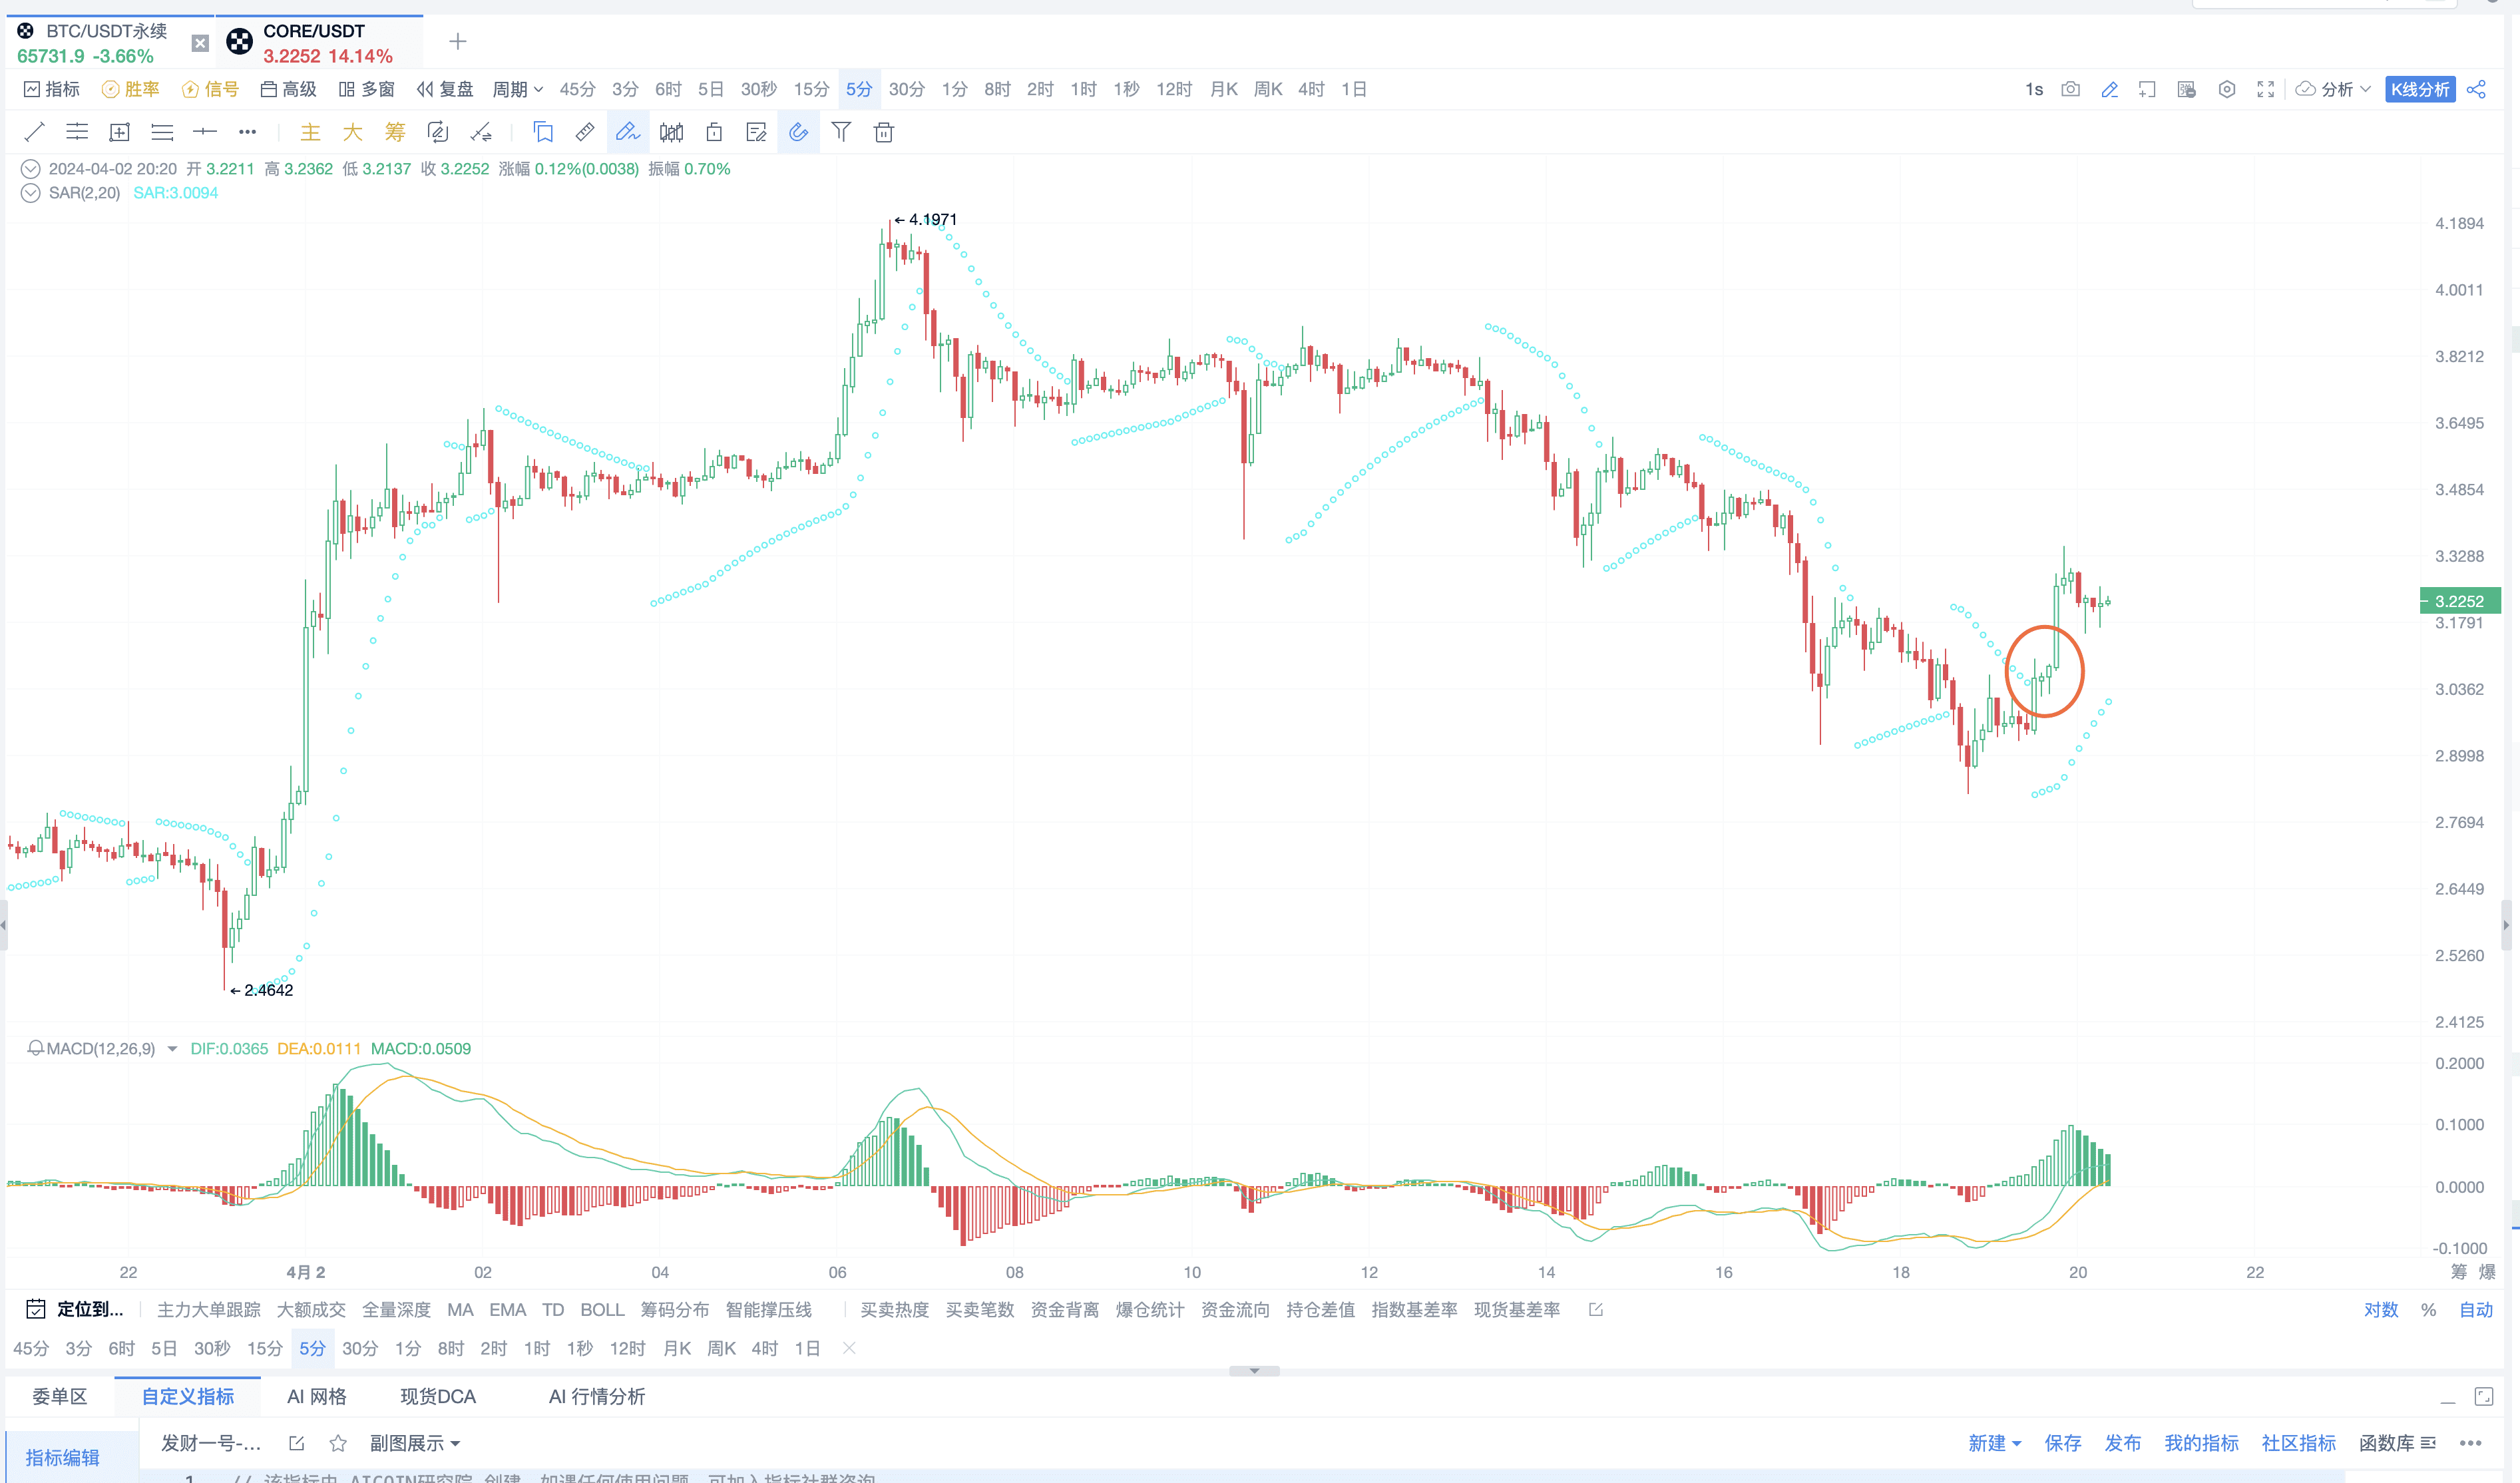
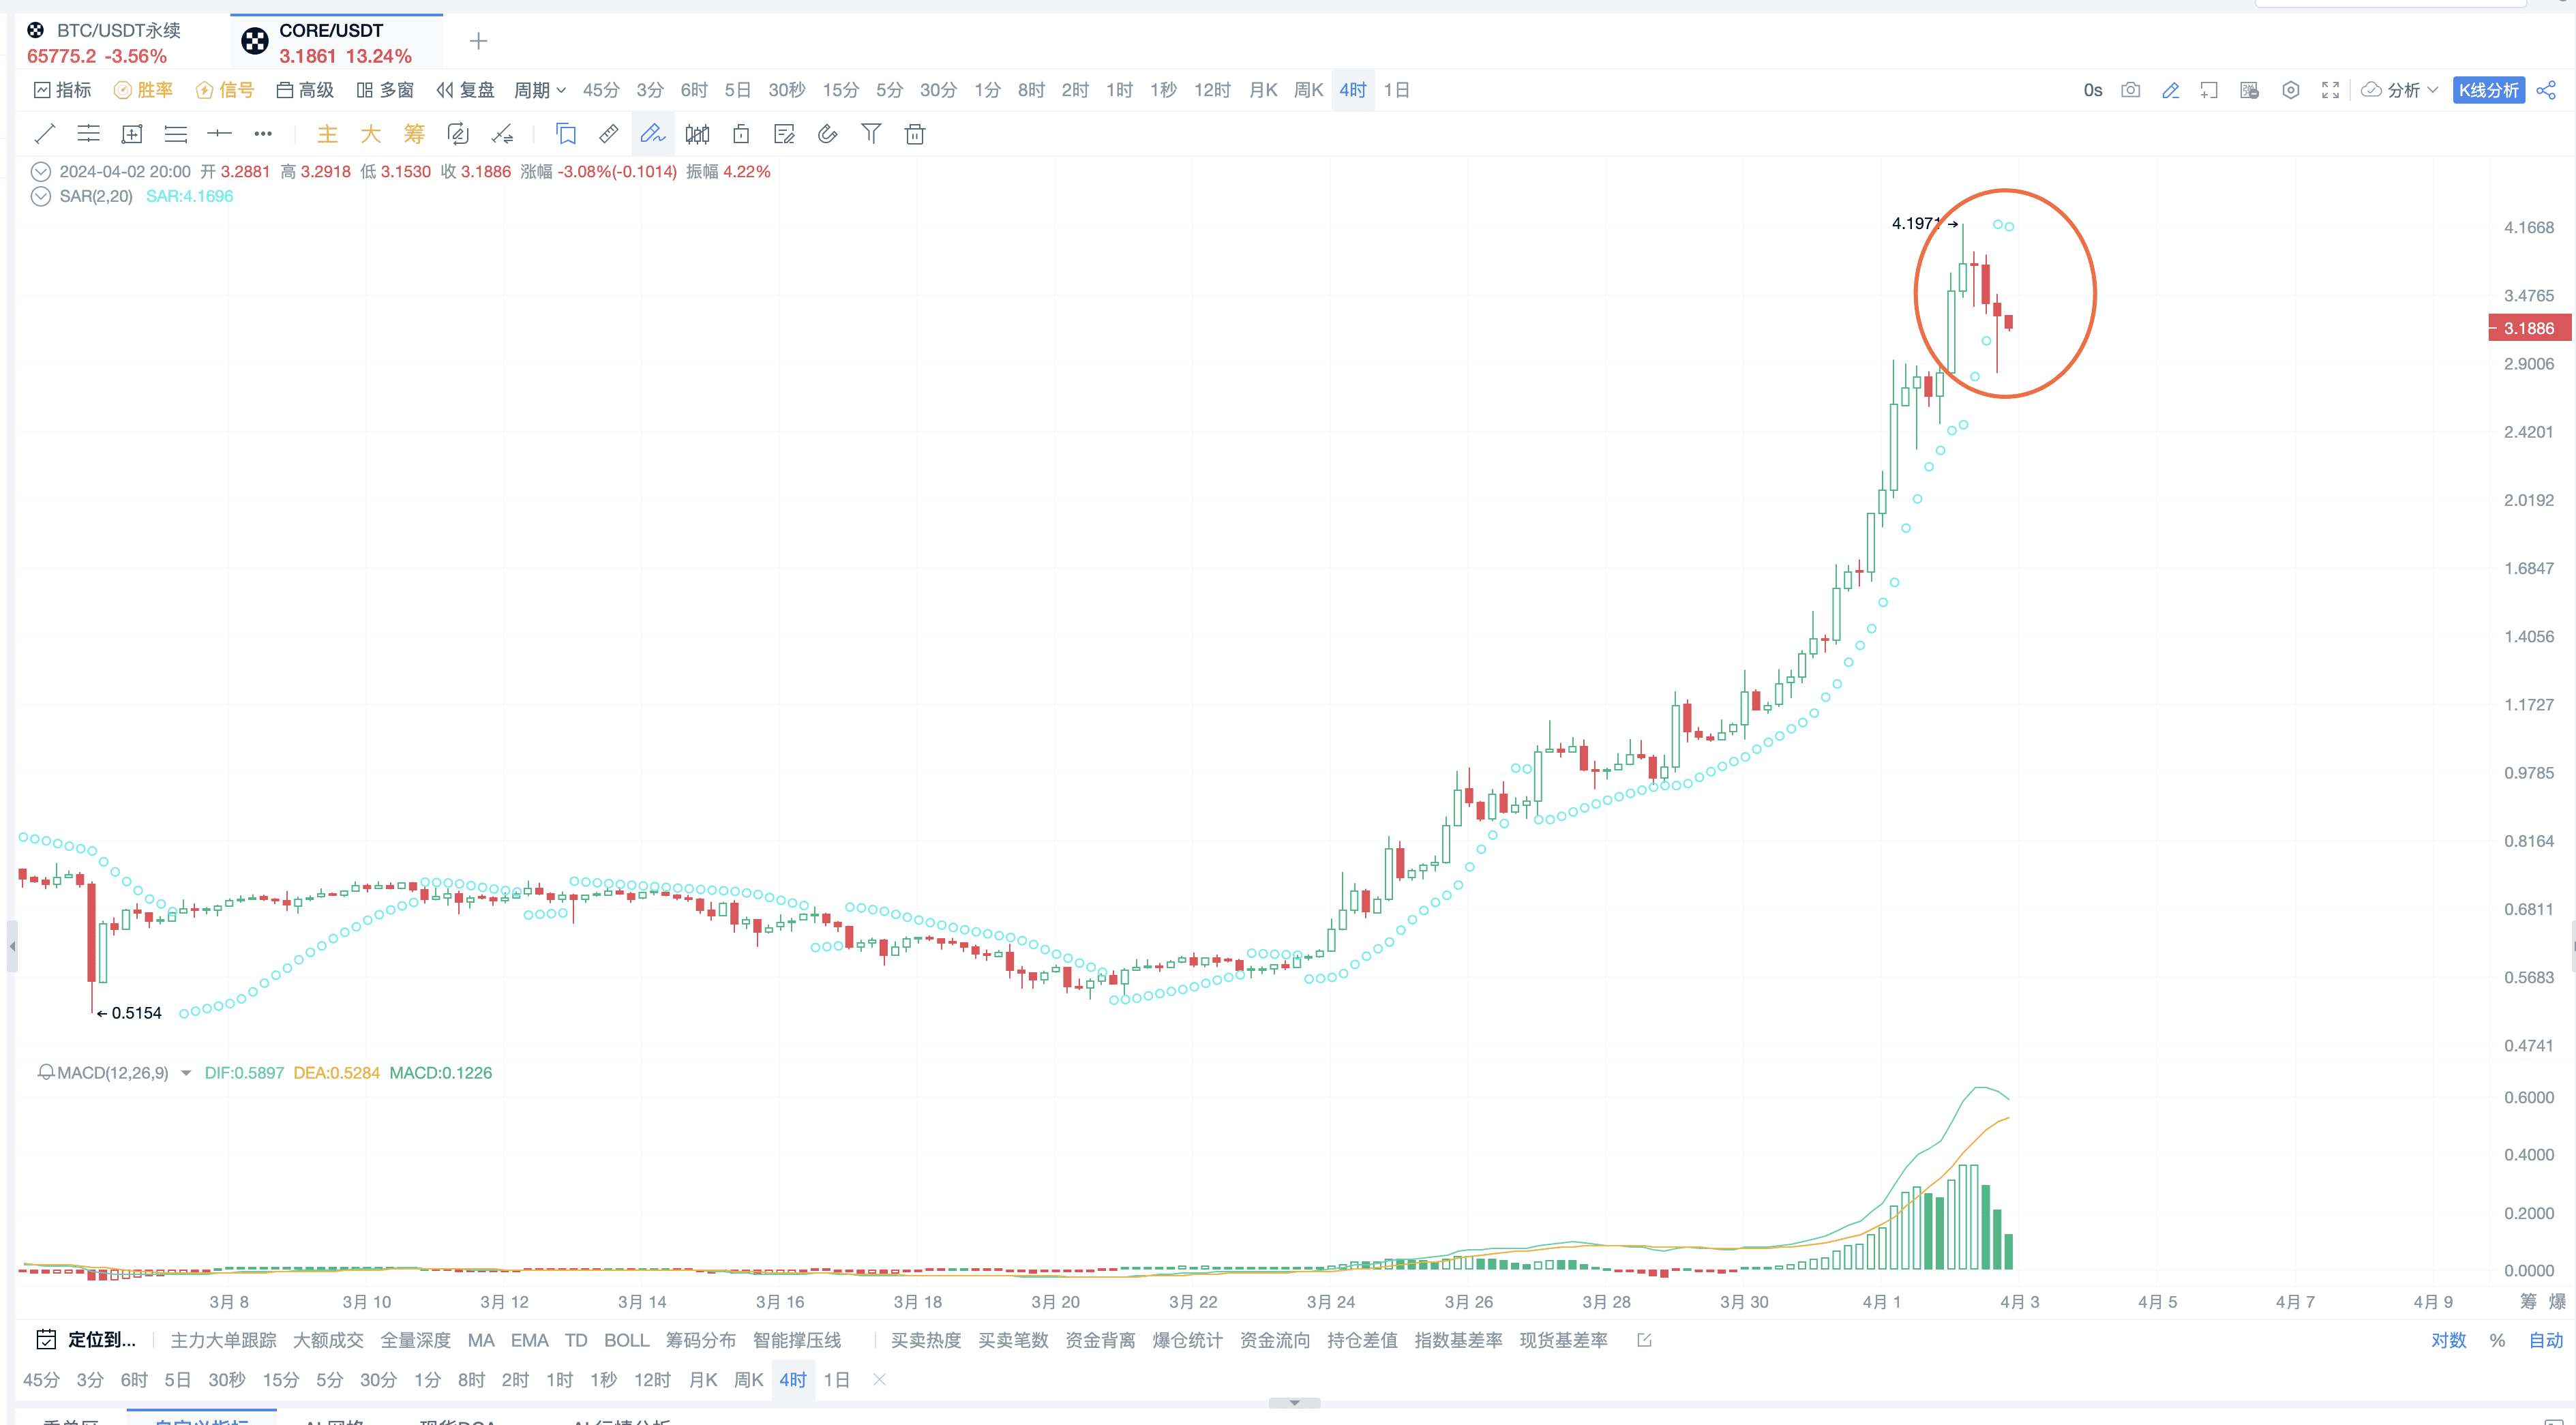
It can be observed from multiple timeframes. From the 15-minute and 5-minute perspectives, SAR is reversing upwards. However, from the 4-hour perspective, it is in a pullback phase, coinciding with resistance. Operational reference: It can turn upwards on the 4-hour timeframe and then look for entry points that are also upwards on the 5-minute timeframe.
(2) SAR Analysis BTC From the daily perspective, BTC is currently standing at the support level of SAR.
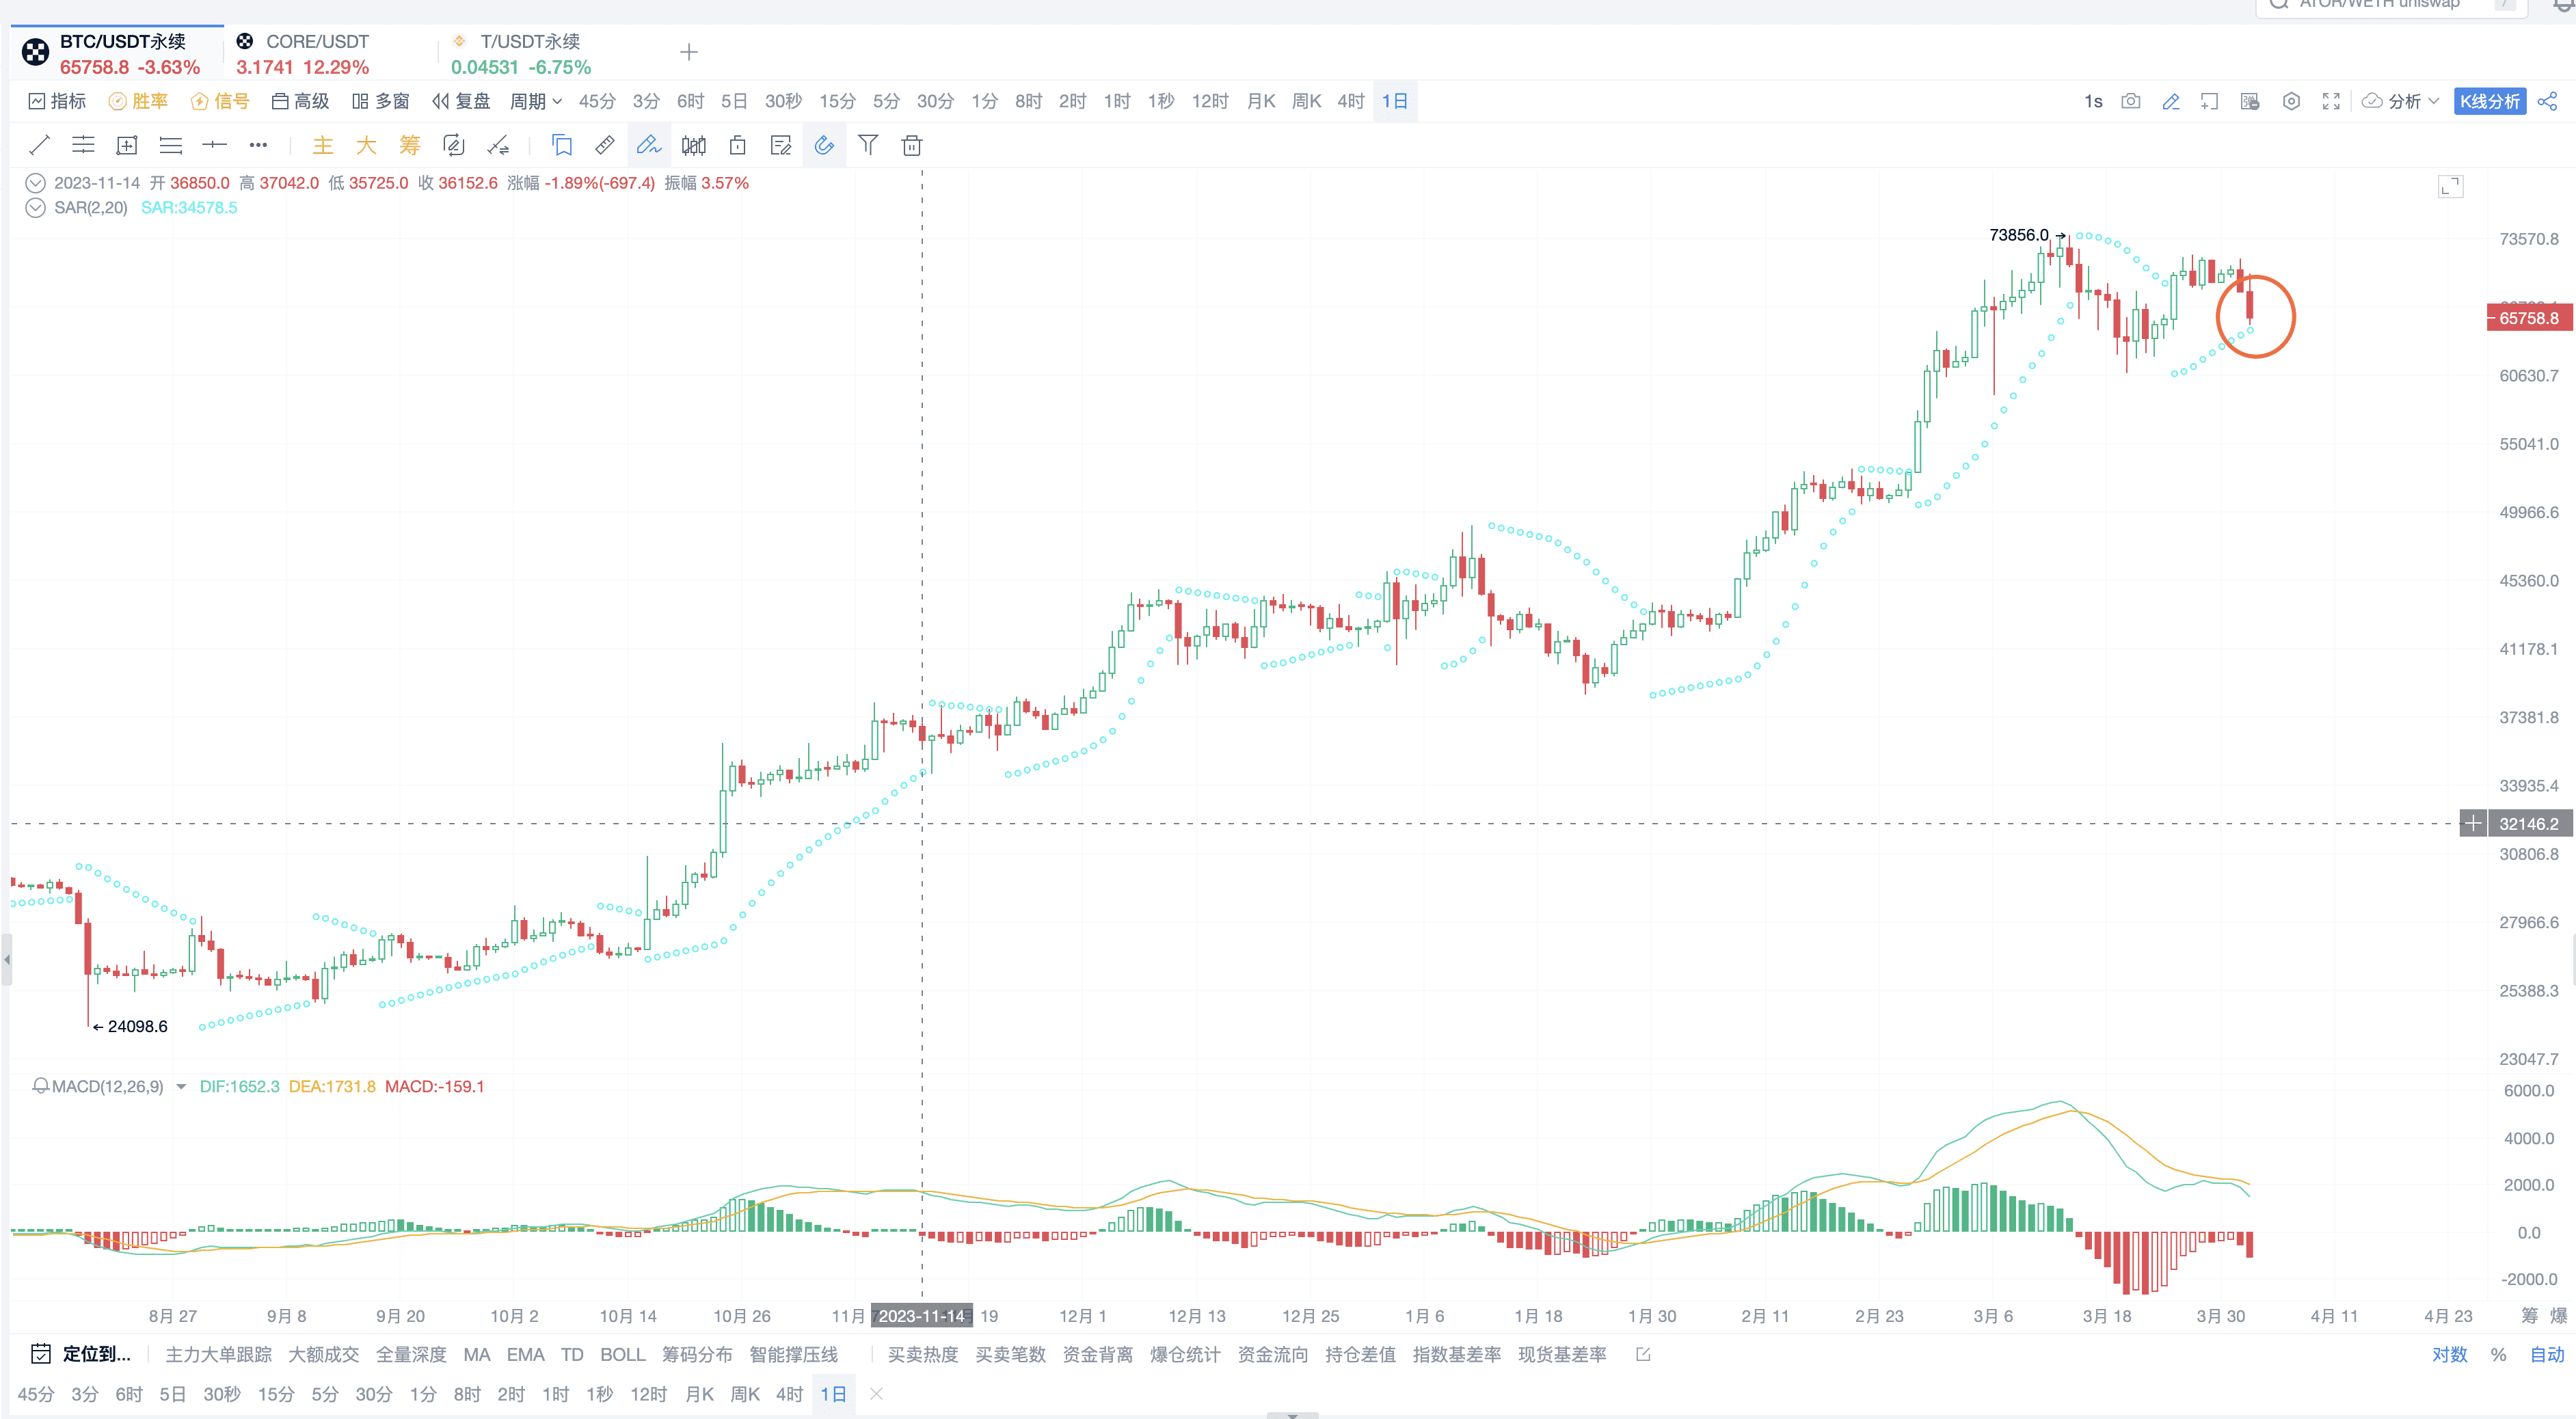
If it falls below, the daily level will continue to trend downwards, similar to the 4-hour trend.
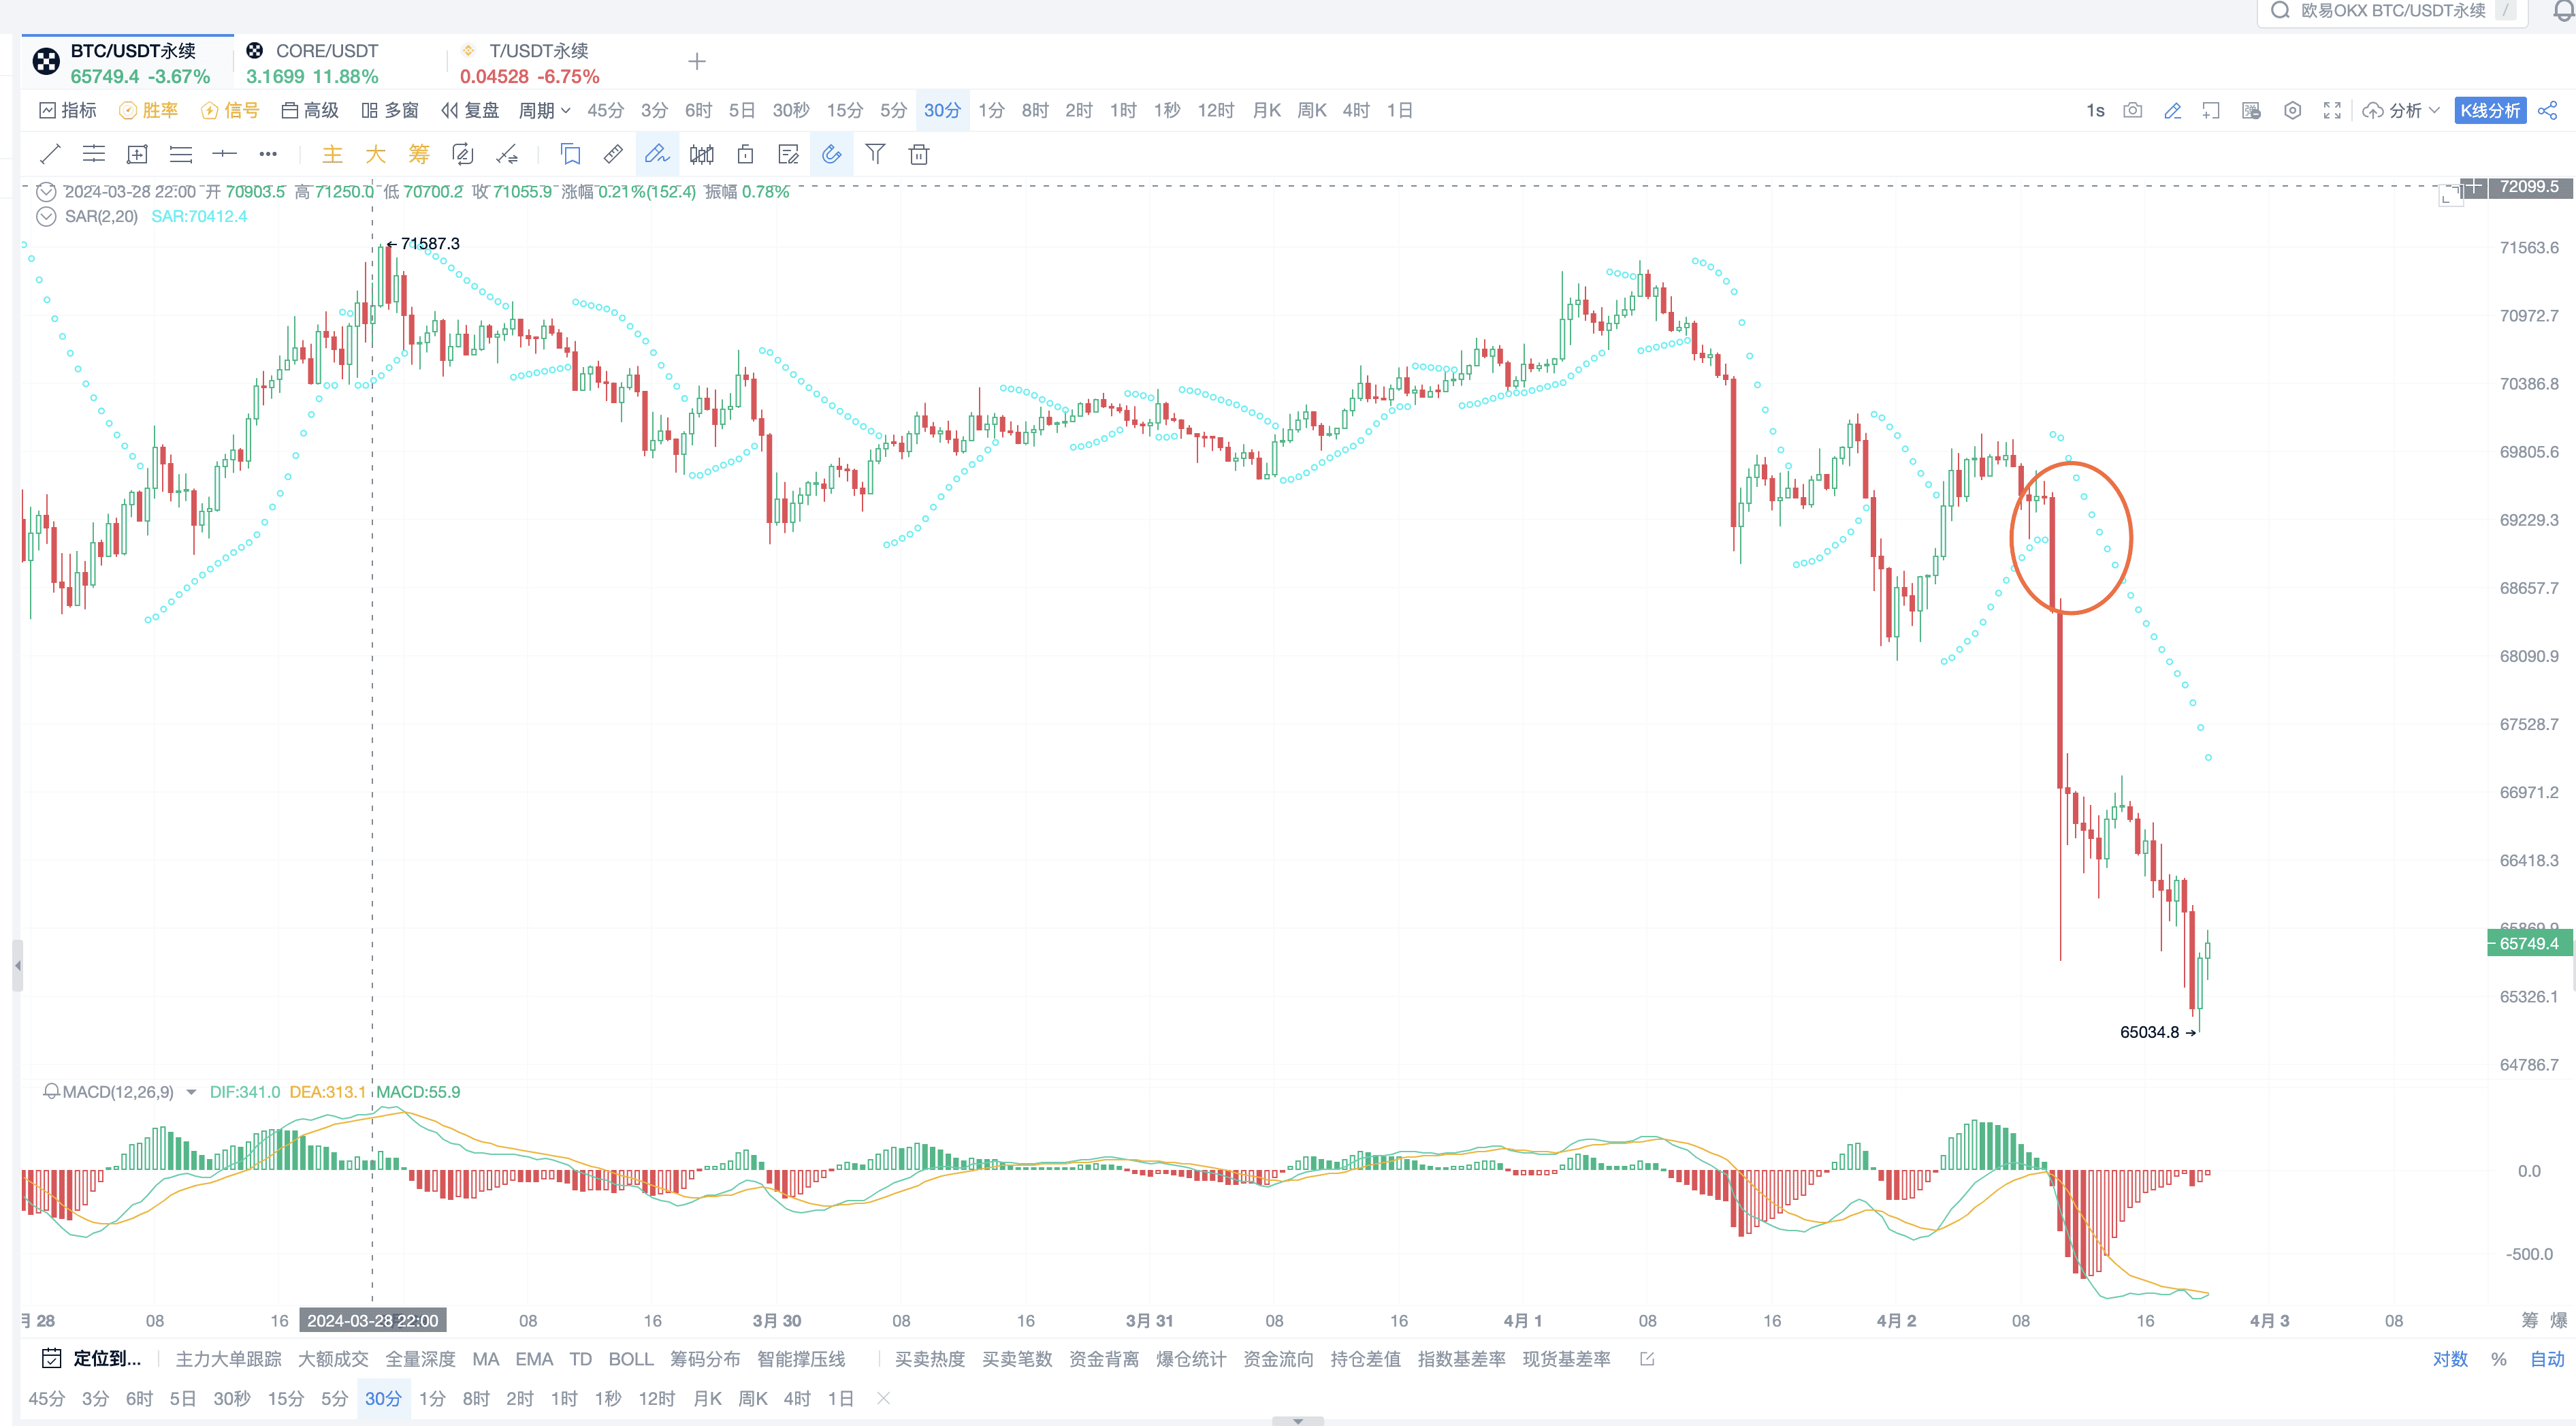
The 30-minute timeframe is currently in a trend of suppression.
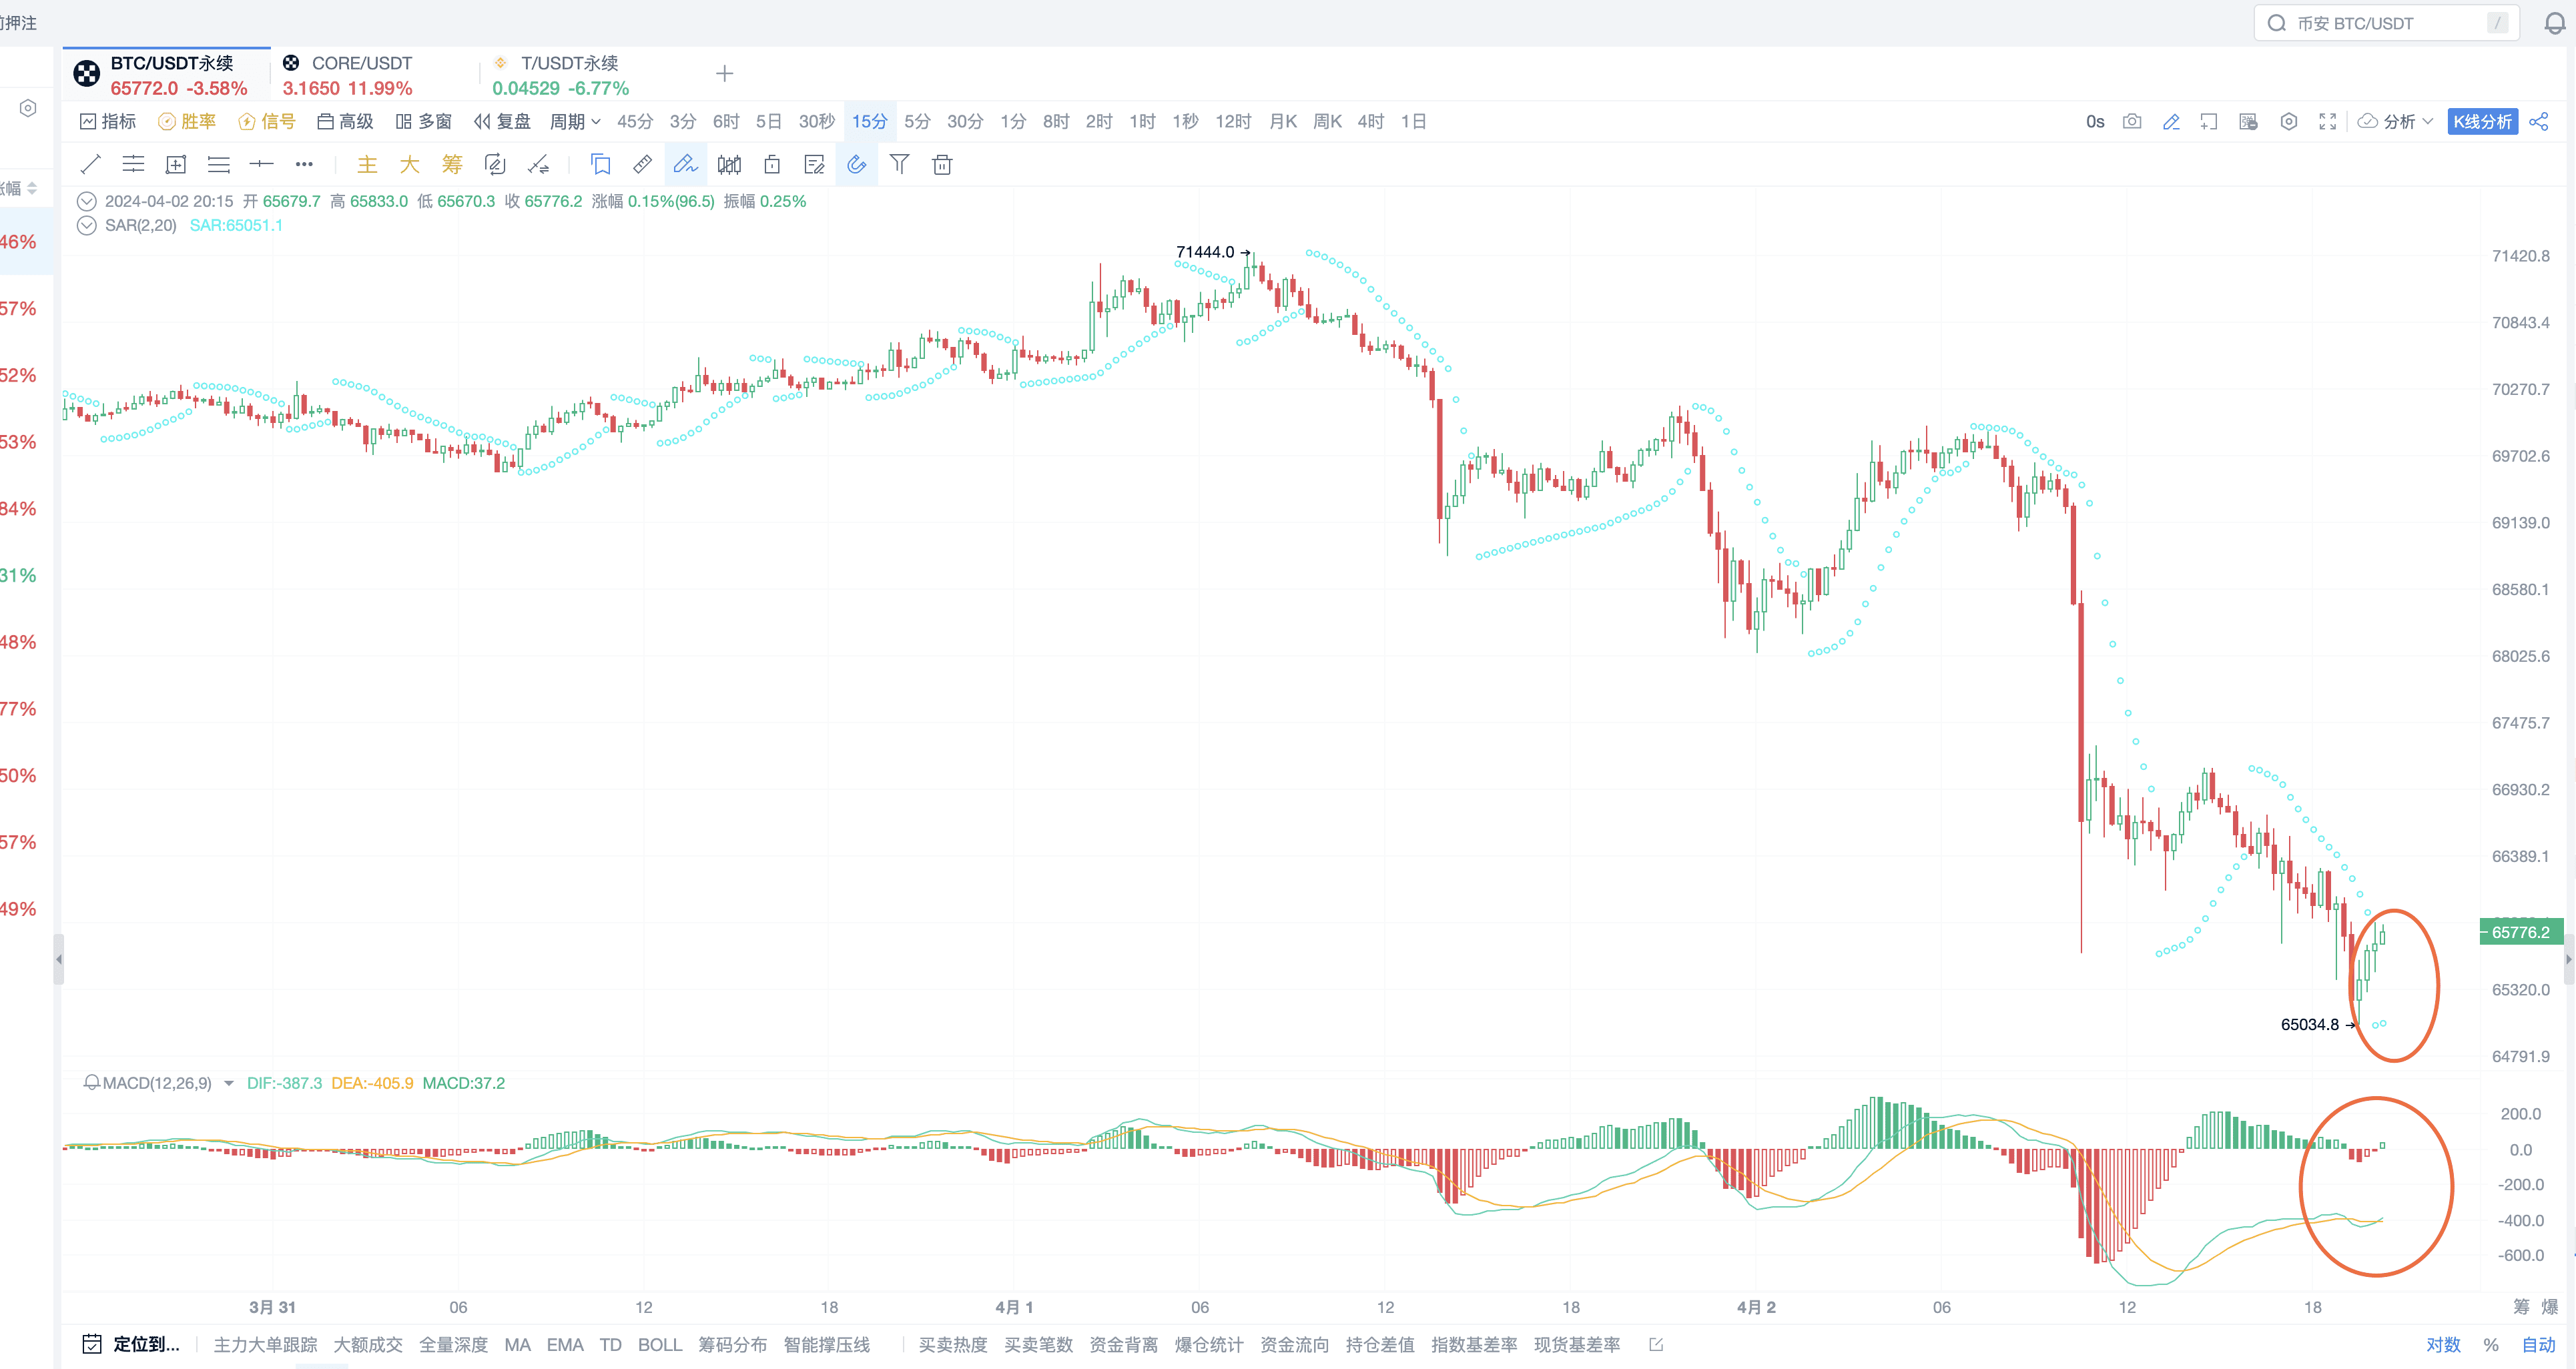
As shown in the image below, there should be a rebound in the 15-minute timeframe. This is because it forms a reversal support for SAR, as well as a bullish divergence in MACD; if this bullish divergence is absorbed by oscillation, there is still a possibility of continued downward movement.
From a capital perspective, pay more attention to the overall market's capital situation. Here is a good method for evaluation: directly observe the net inflow of ETFs, which is the Bitcoin ETF funds. Keep an eye on AICoin's news.
II. AI Writes SAR Indicator Script
AI Scripting Position
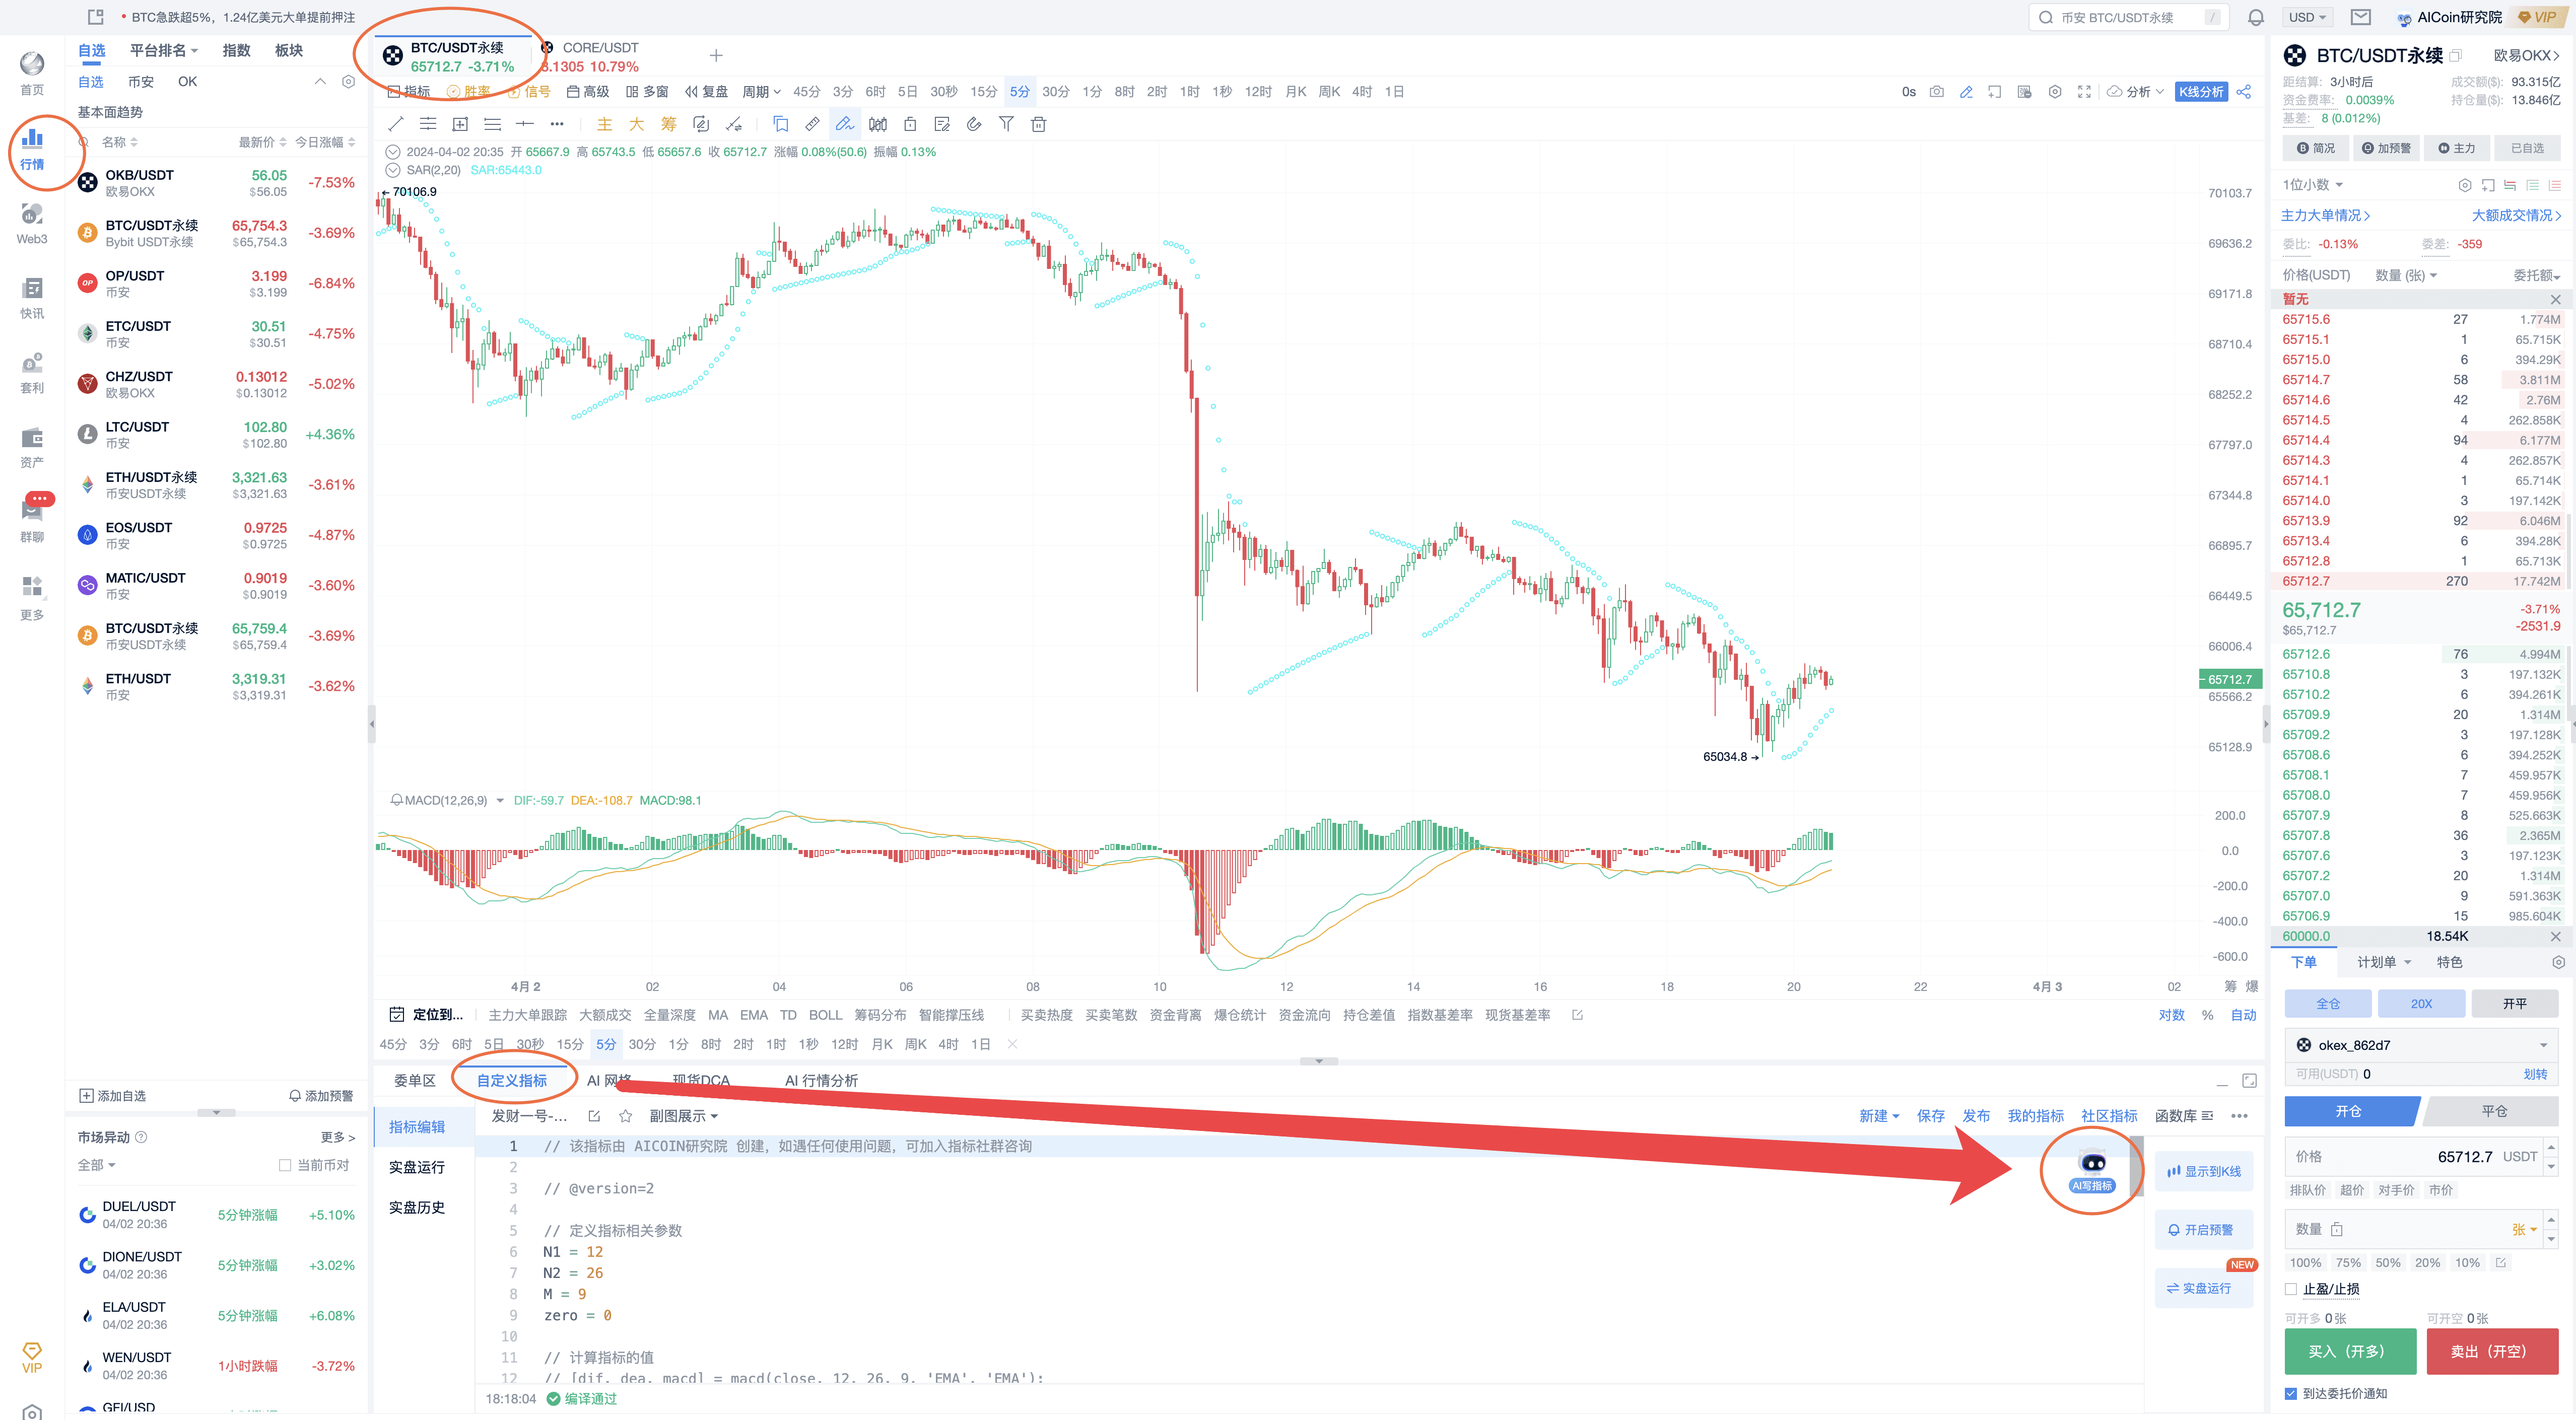
AICoin has an exclusive tool, AI Assistant, to help realize your brilliant trading ideas; as long as you have a concept, AI can help you write the program.
Directly using the AI Assistant saves time on quantitative research!
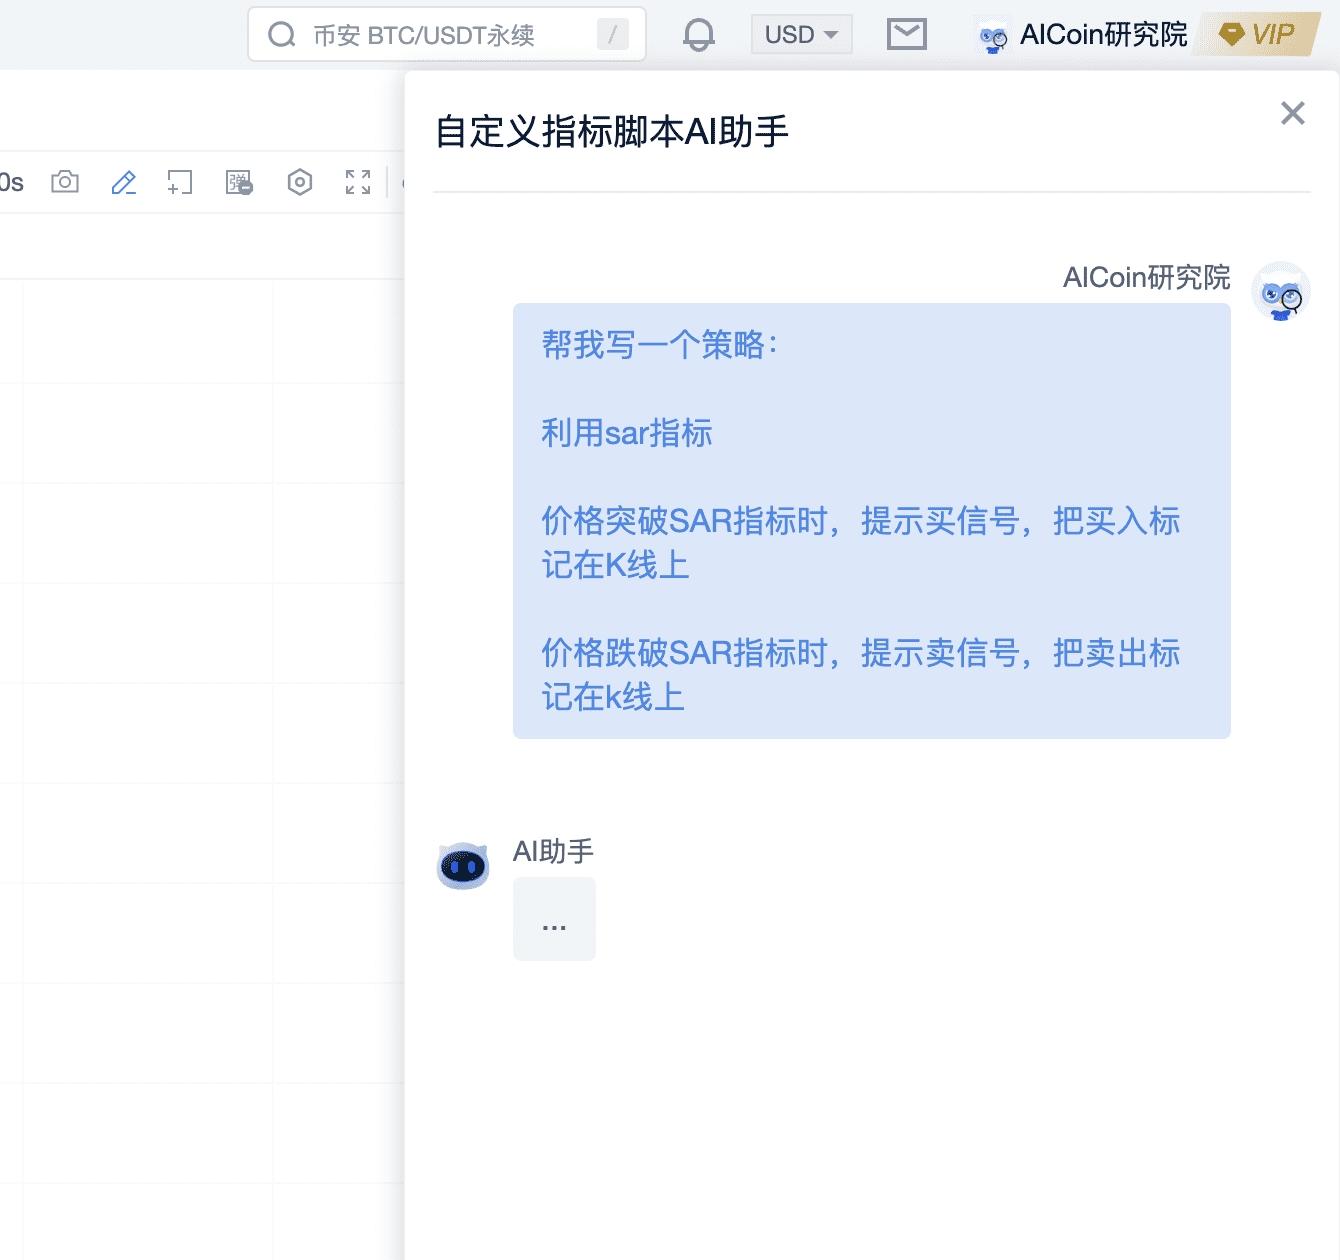
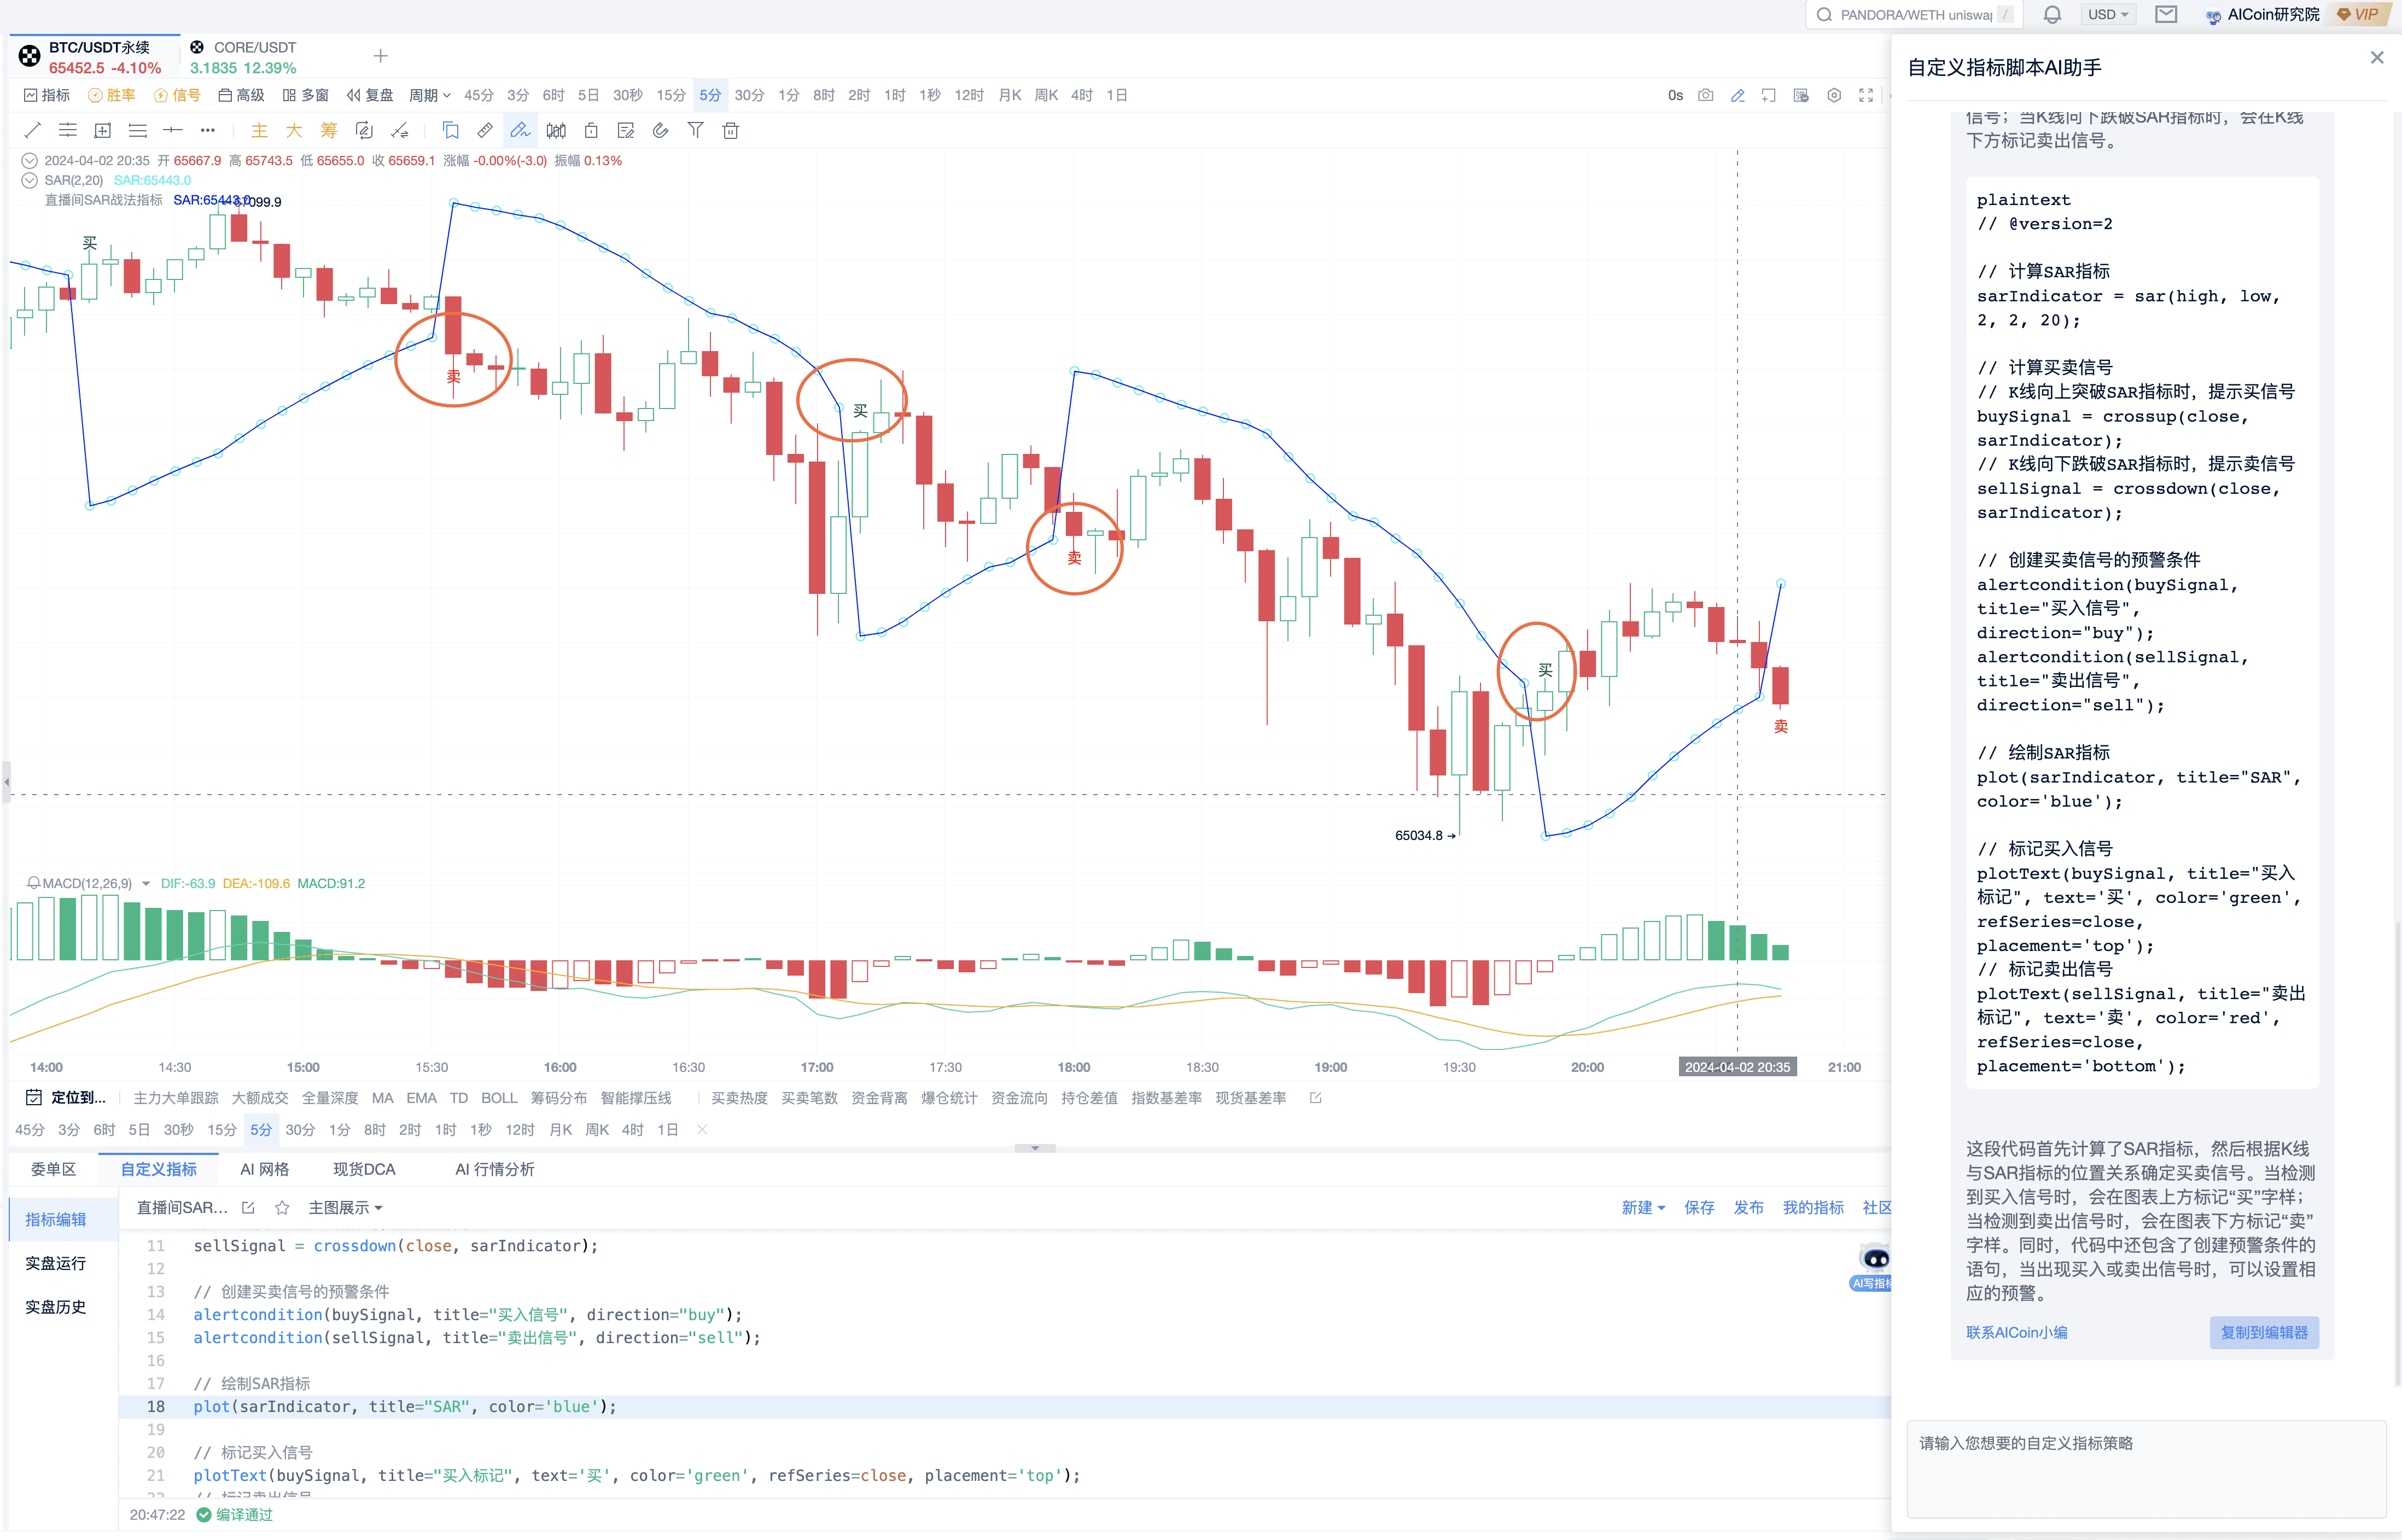
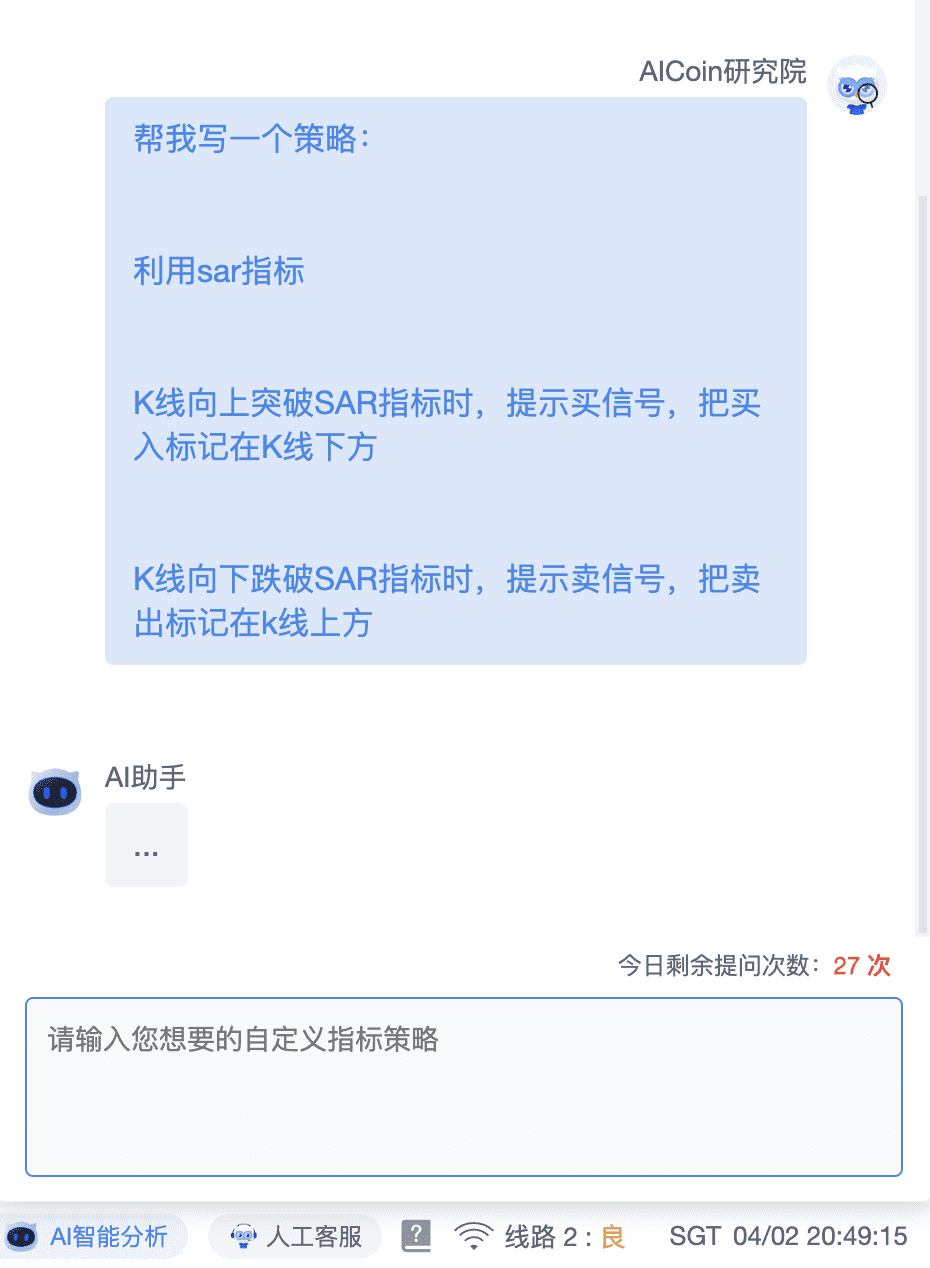
Ask AI Help me write a strategy: Utilize the SAR indicator. When the price breaks through the SAR indicator, it signals a buy, and the buy mark is placed on the candlestick. When the price falls below the SAR indicator, it signals a sell, and the sell mark is placed on the candlestick.
Save it and display it on the candlestick to see the effect.
The initial display effect failed.
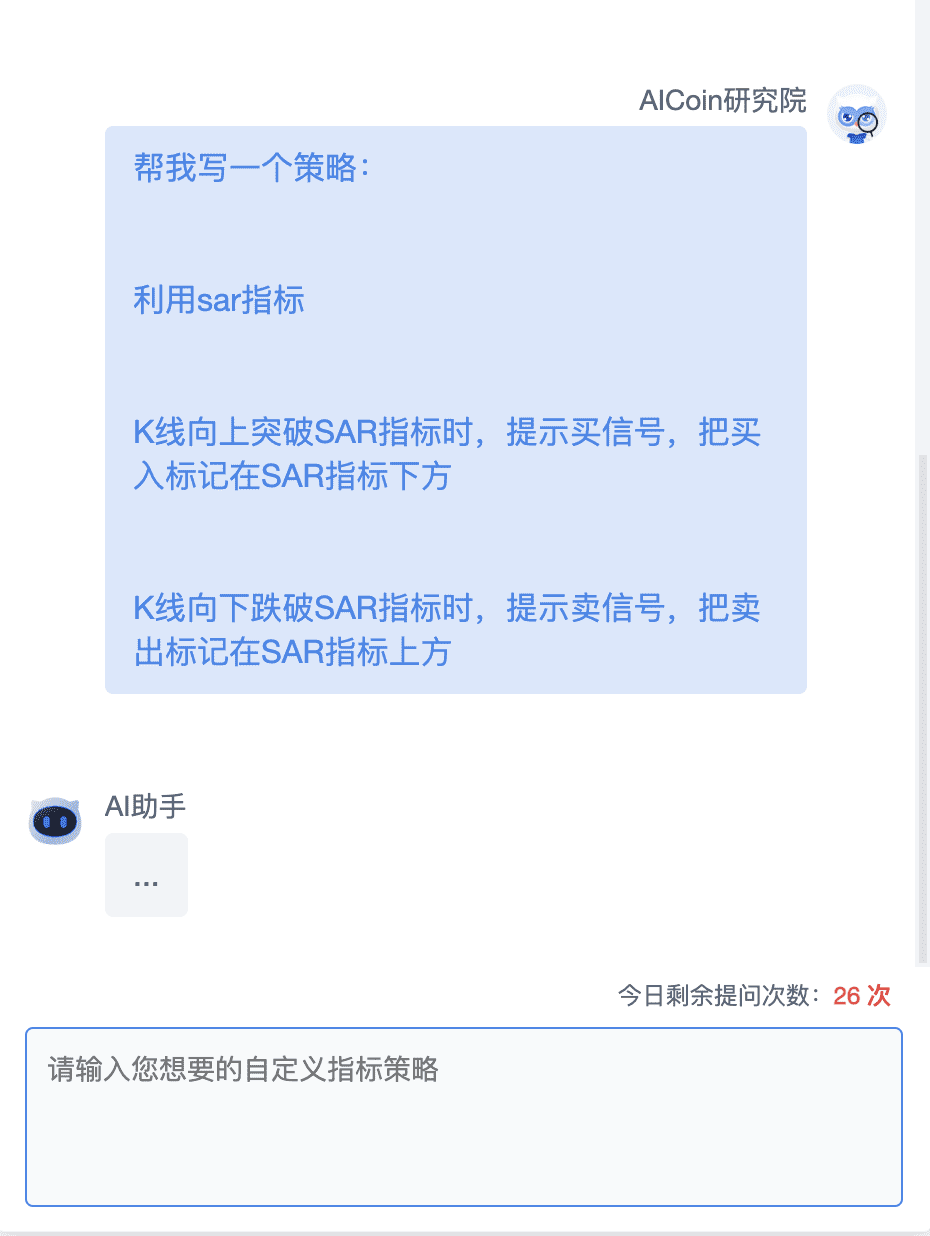
Ask AI for Optimization Help me write a strategy: Utilize the SAR indicator. When the candlestick breaks upwards through the SAR indicator, it signals a buy, and the buy mark is placed on the candlestick. When the candlestick falls below the SAR indicator, it signals a sell, and the sell mark is placed on the candlestick.
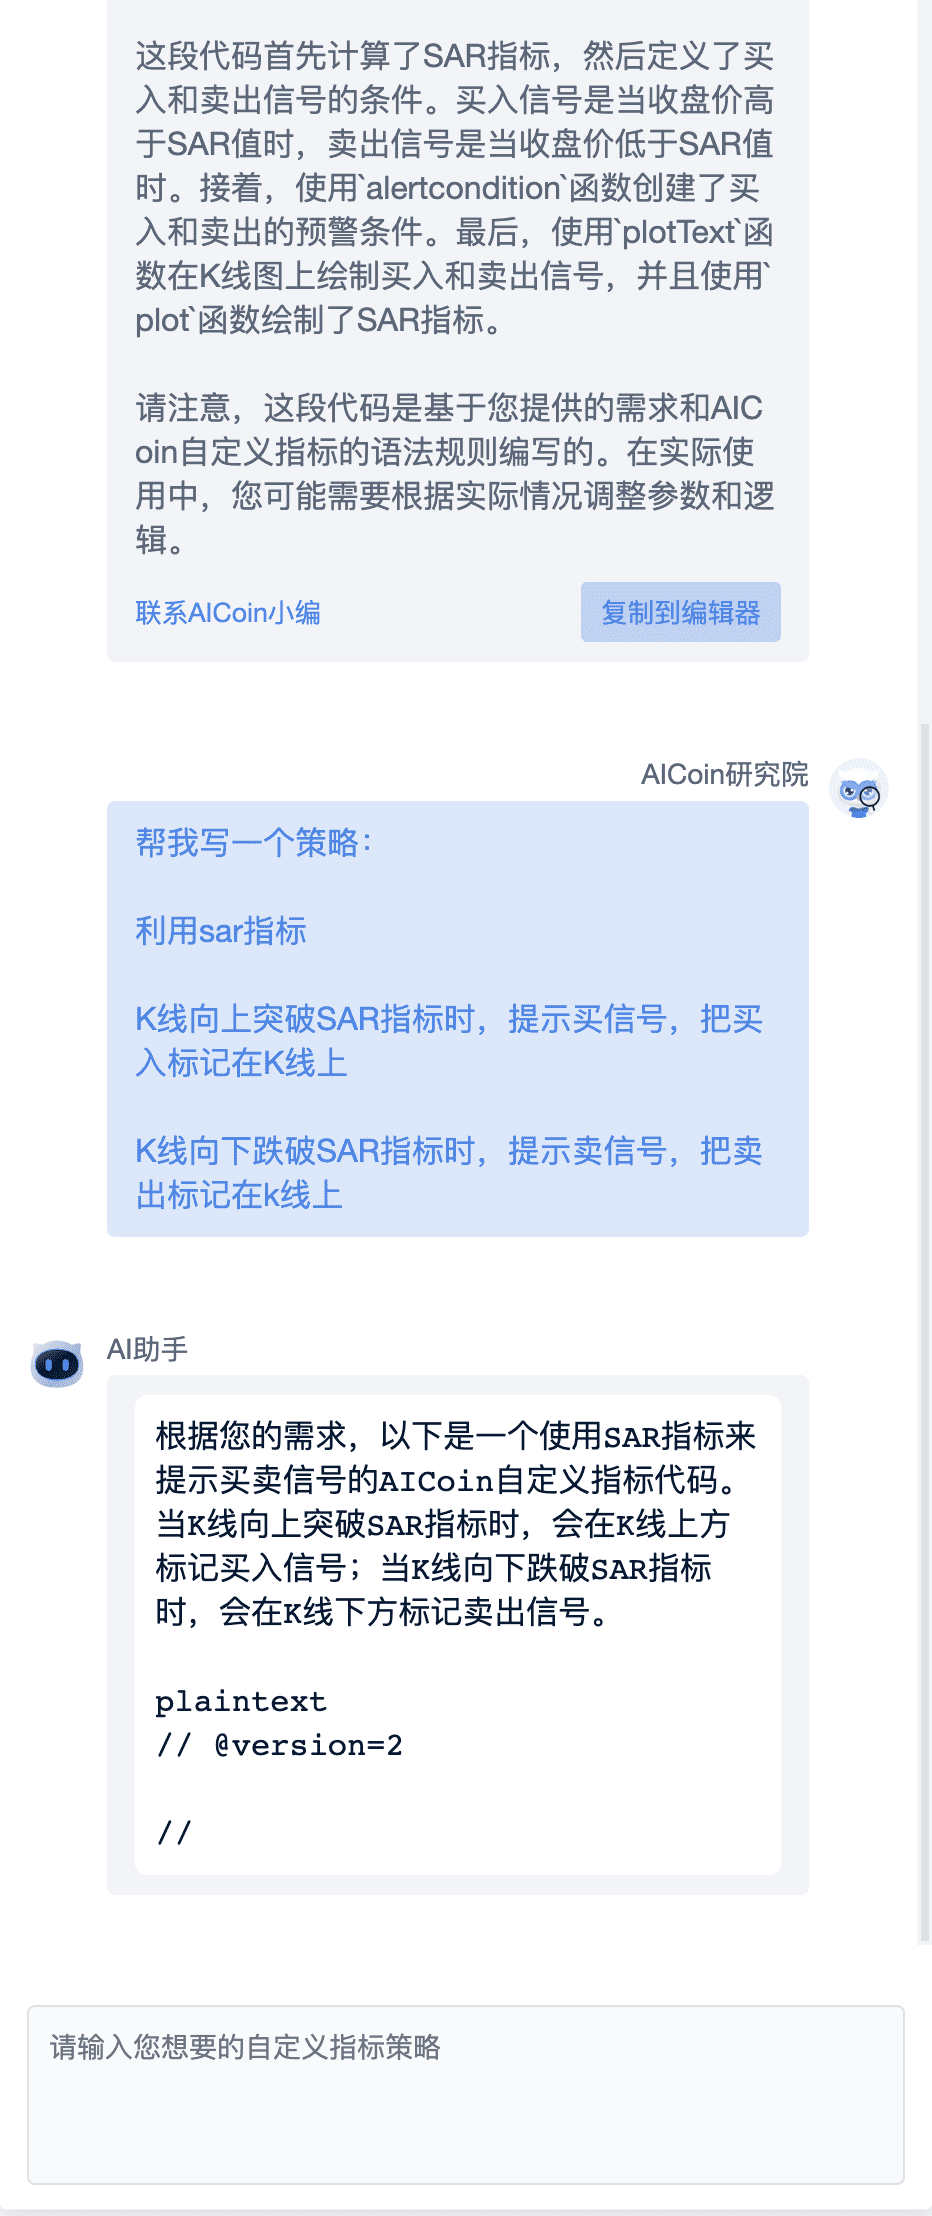
AI responds that the position marking for buy and sell is not visually appealing, so let's continue to let AI make adjustments.
Ask AI to Optimize the Indicator Display
AI responds that it is still not aesthetically pleasing, so let's continue to let AI make adjustments.
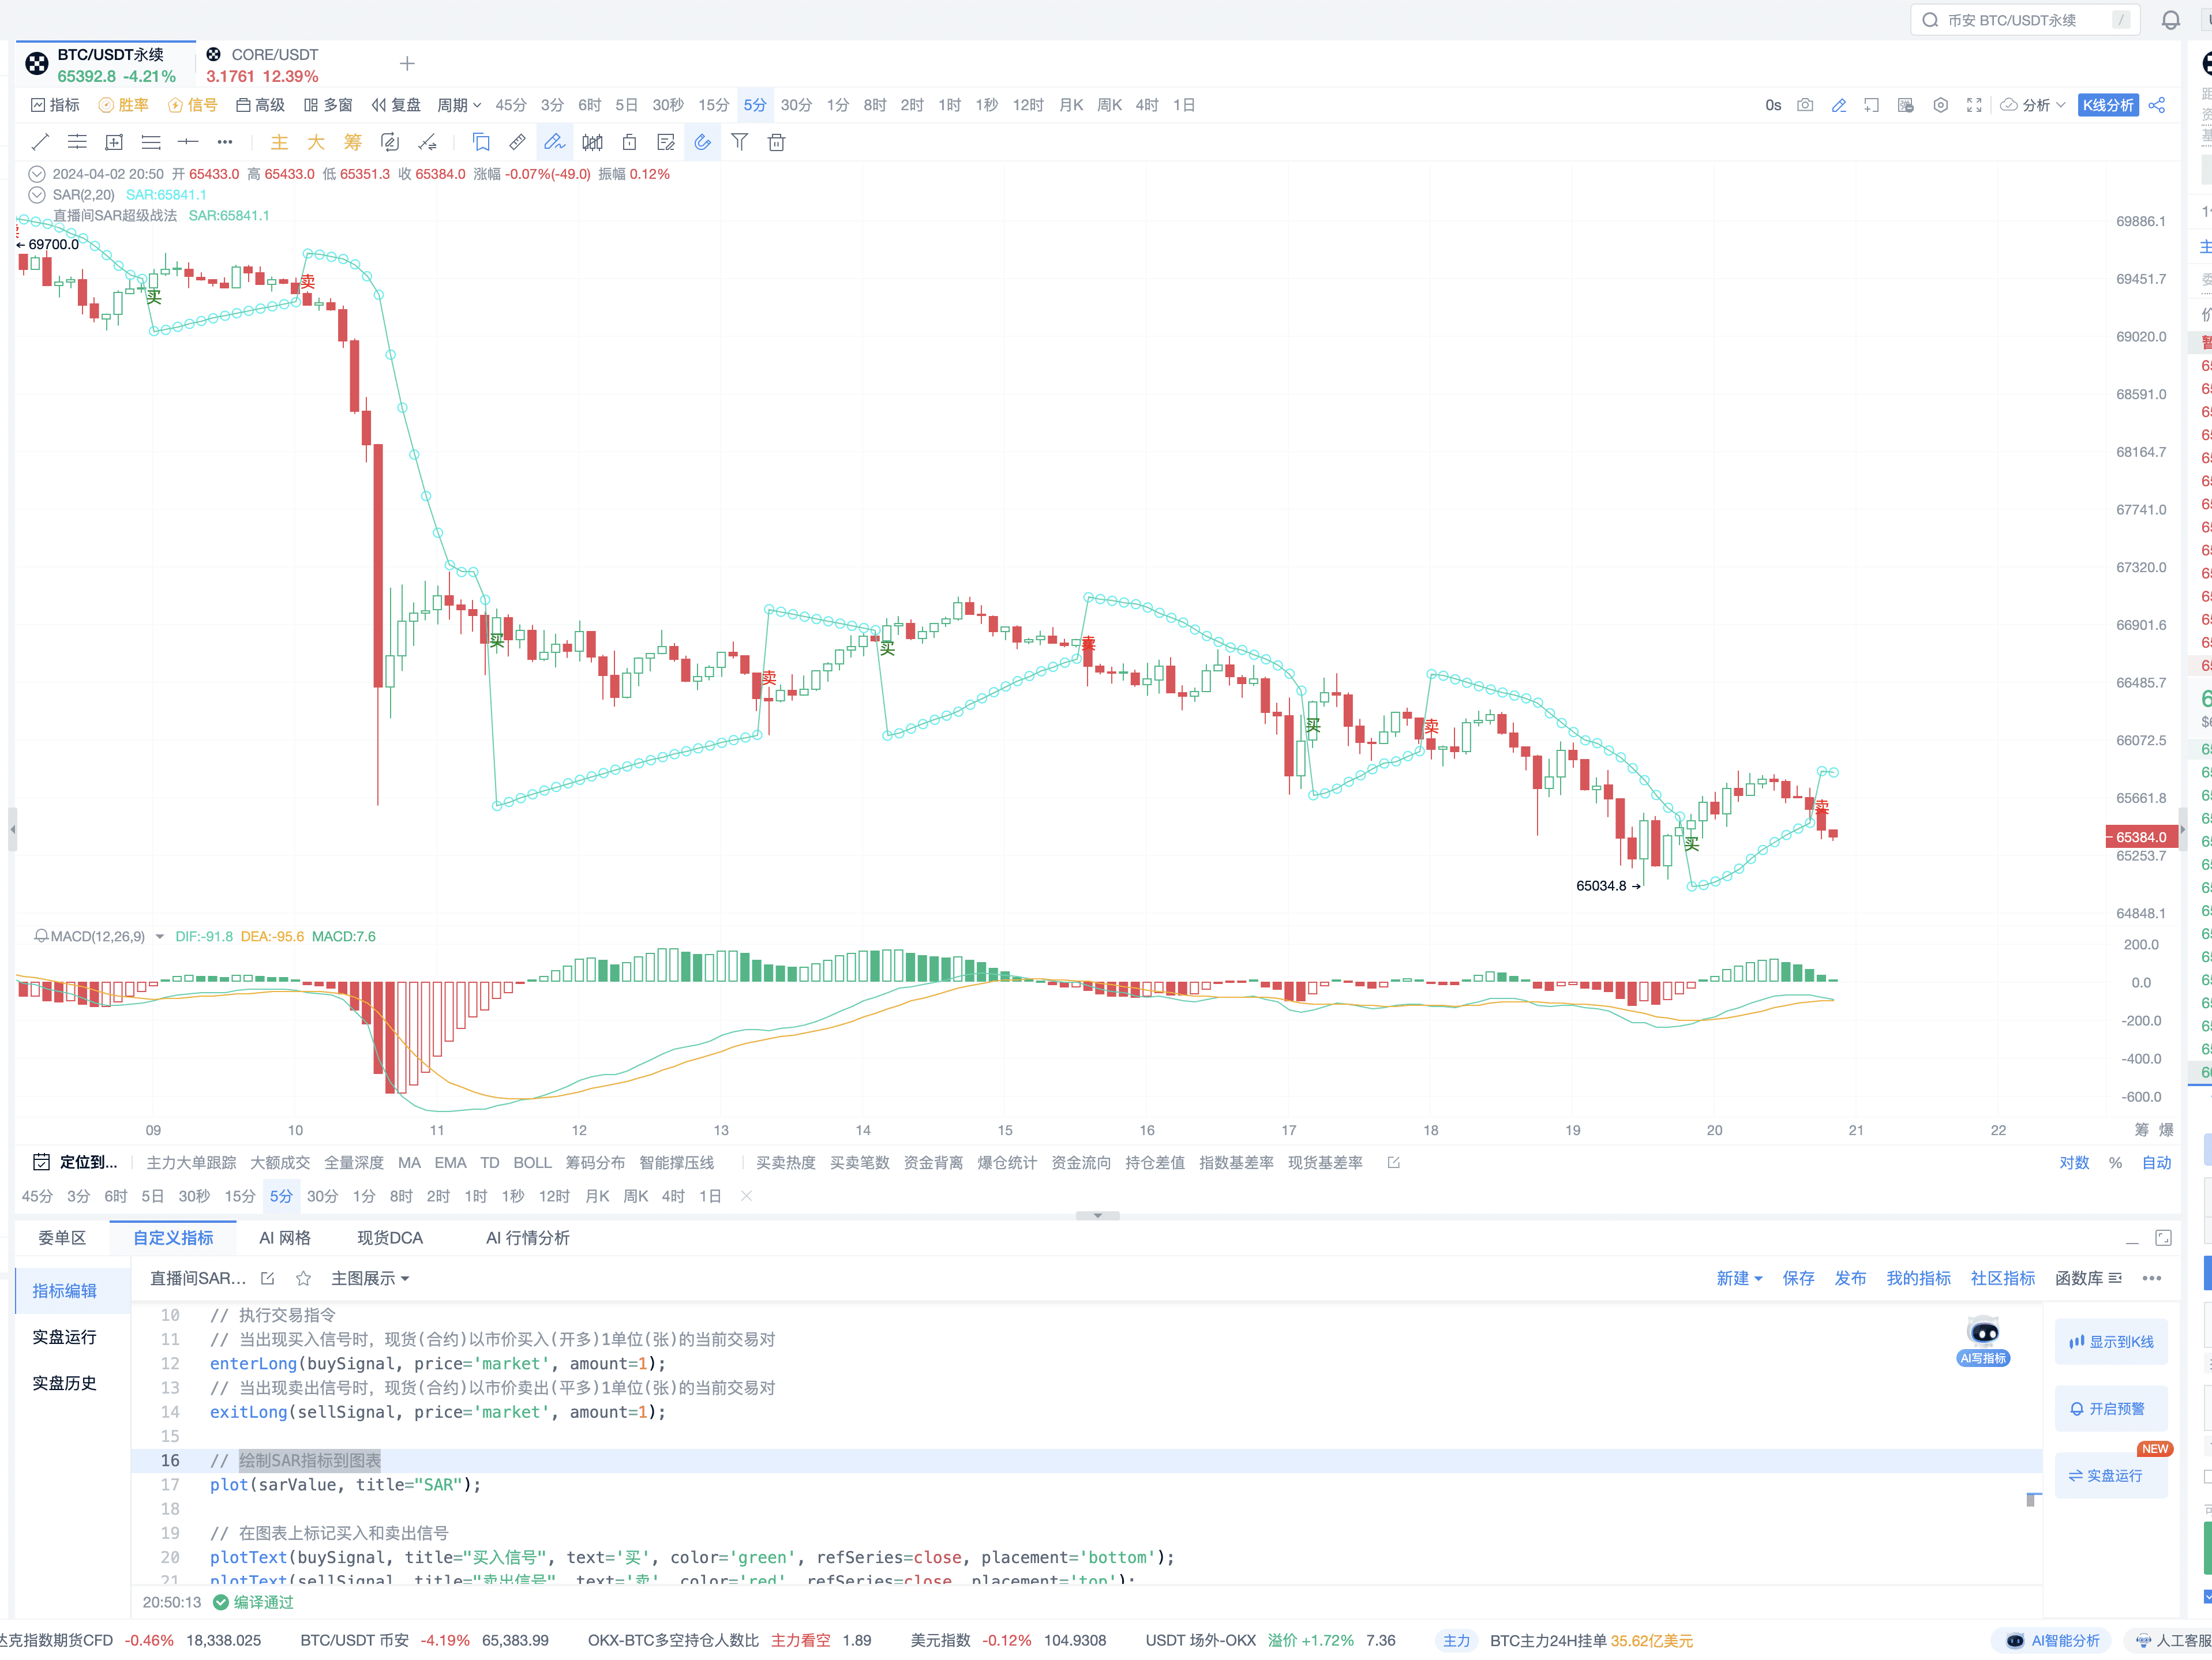
Finally, ask AI to place the buy and sell marks above and below the indicator.
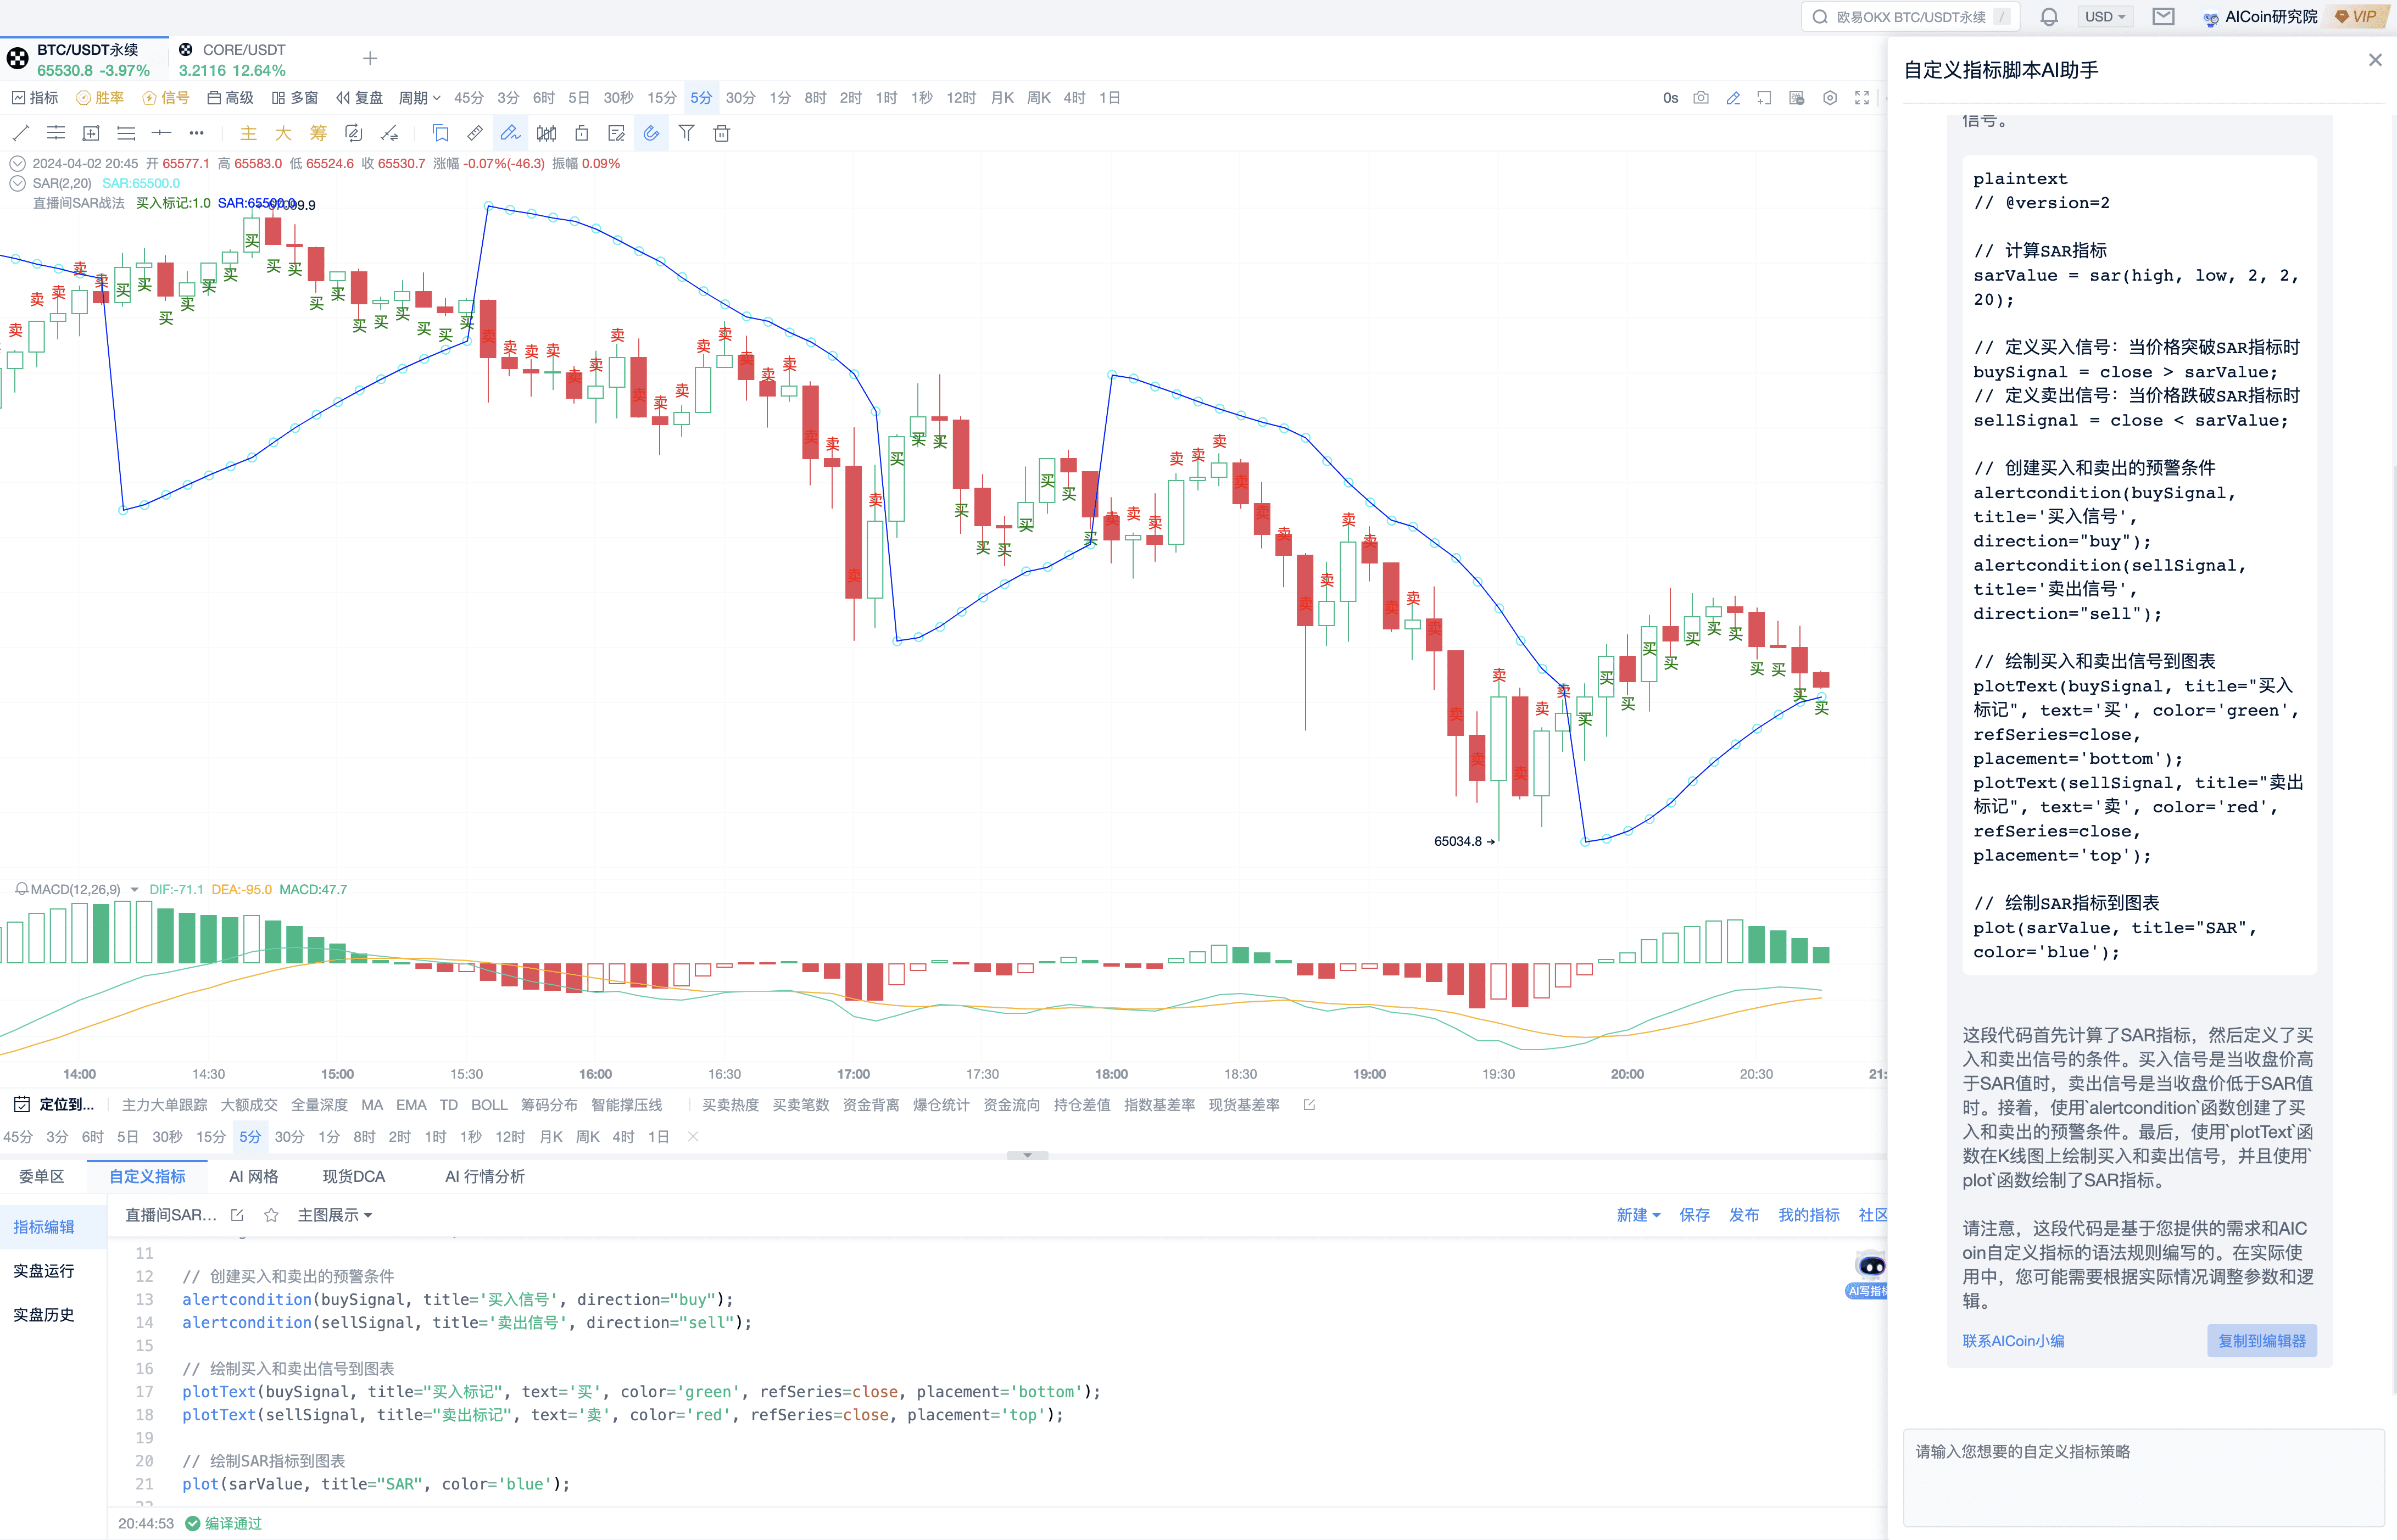
The final display effect of AI
Perfectly captured the sharp decline
PRO members, signal alert members, and indicator win rate members are exclusive premium tools tailored for lazy friends. Custom indicators can help any AICoin user plan their trades and trade their plans. For more custom indicator strategy displays and multiple alert reminders, feel free to subscribe to the signal alert/PRO version K-line/indicator win rate. You can experience the custom indicator membership for a limited time for free. Click the link below to subscribe and experience: https://aicoin.app/zh-CN/vip/chartpro
III. AI Writes Indicators with SAR Alerts and Trading Signals
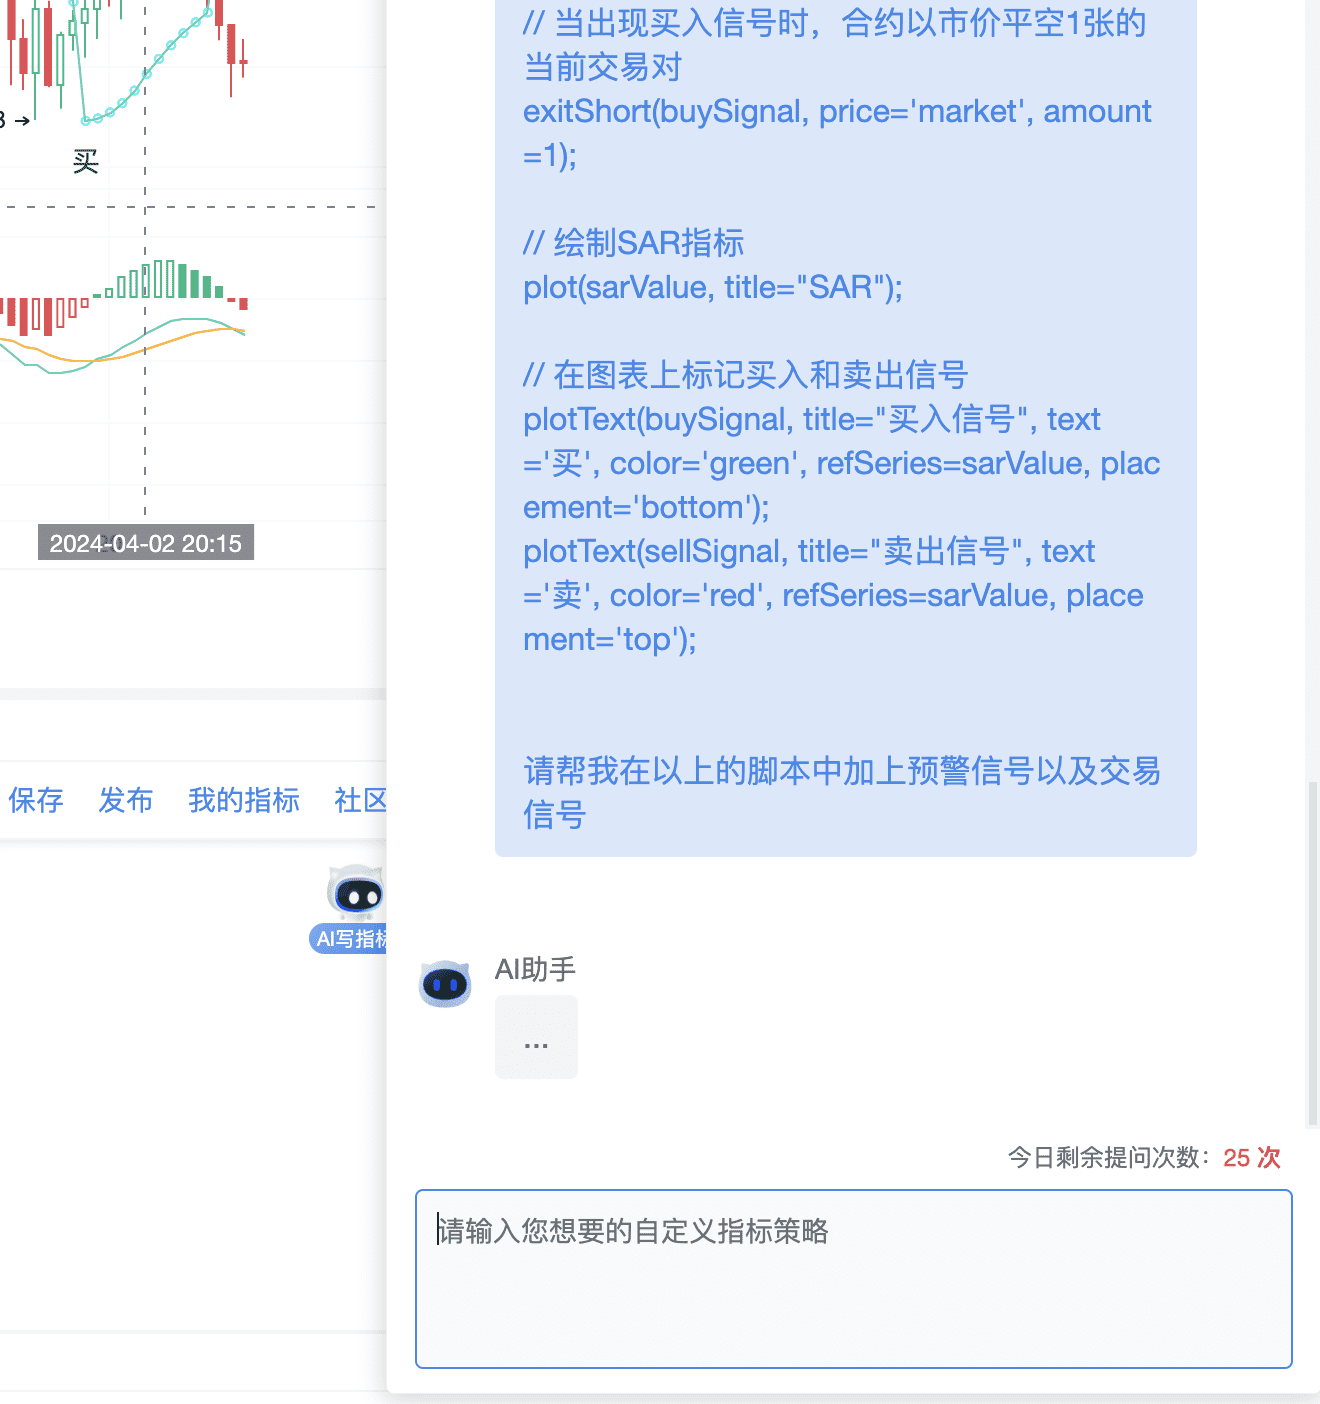
Adding alerts and trading signals to the SAR script
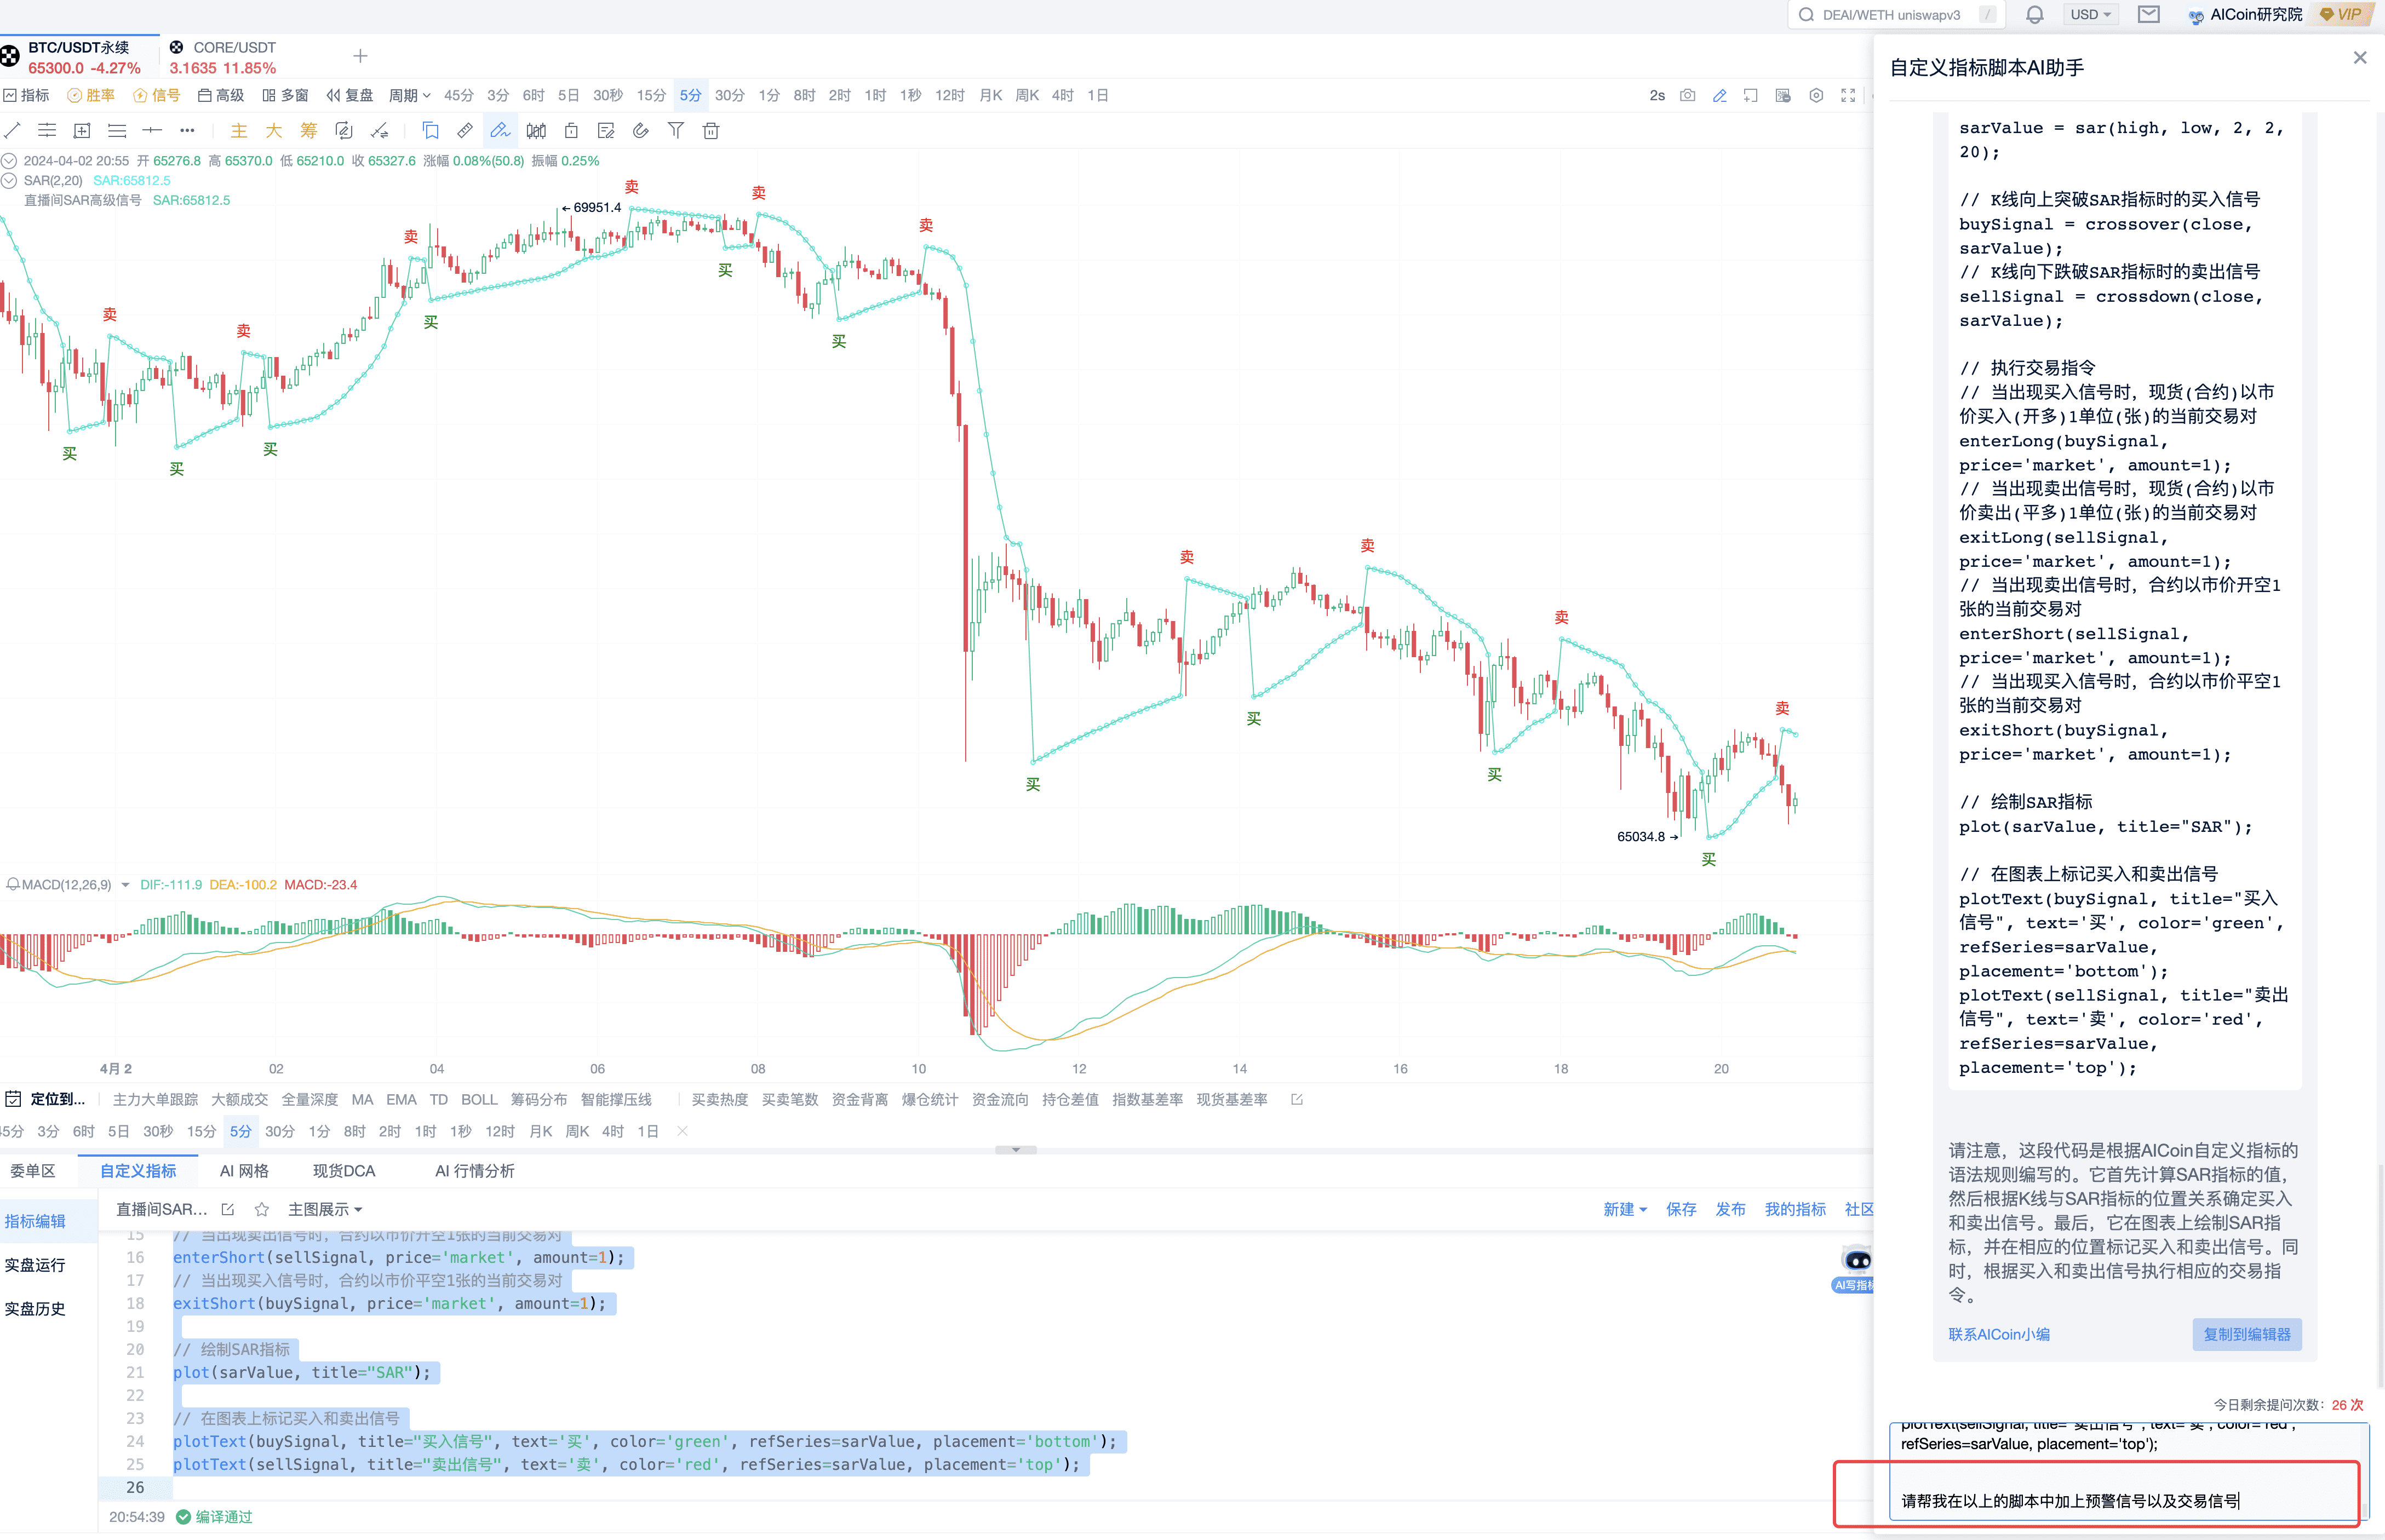
AI response
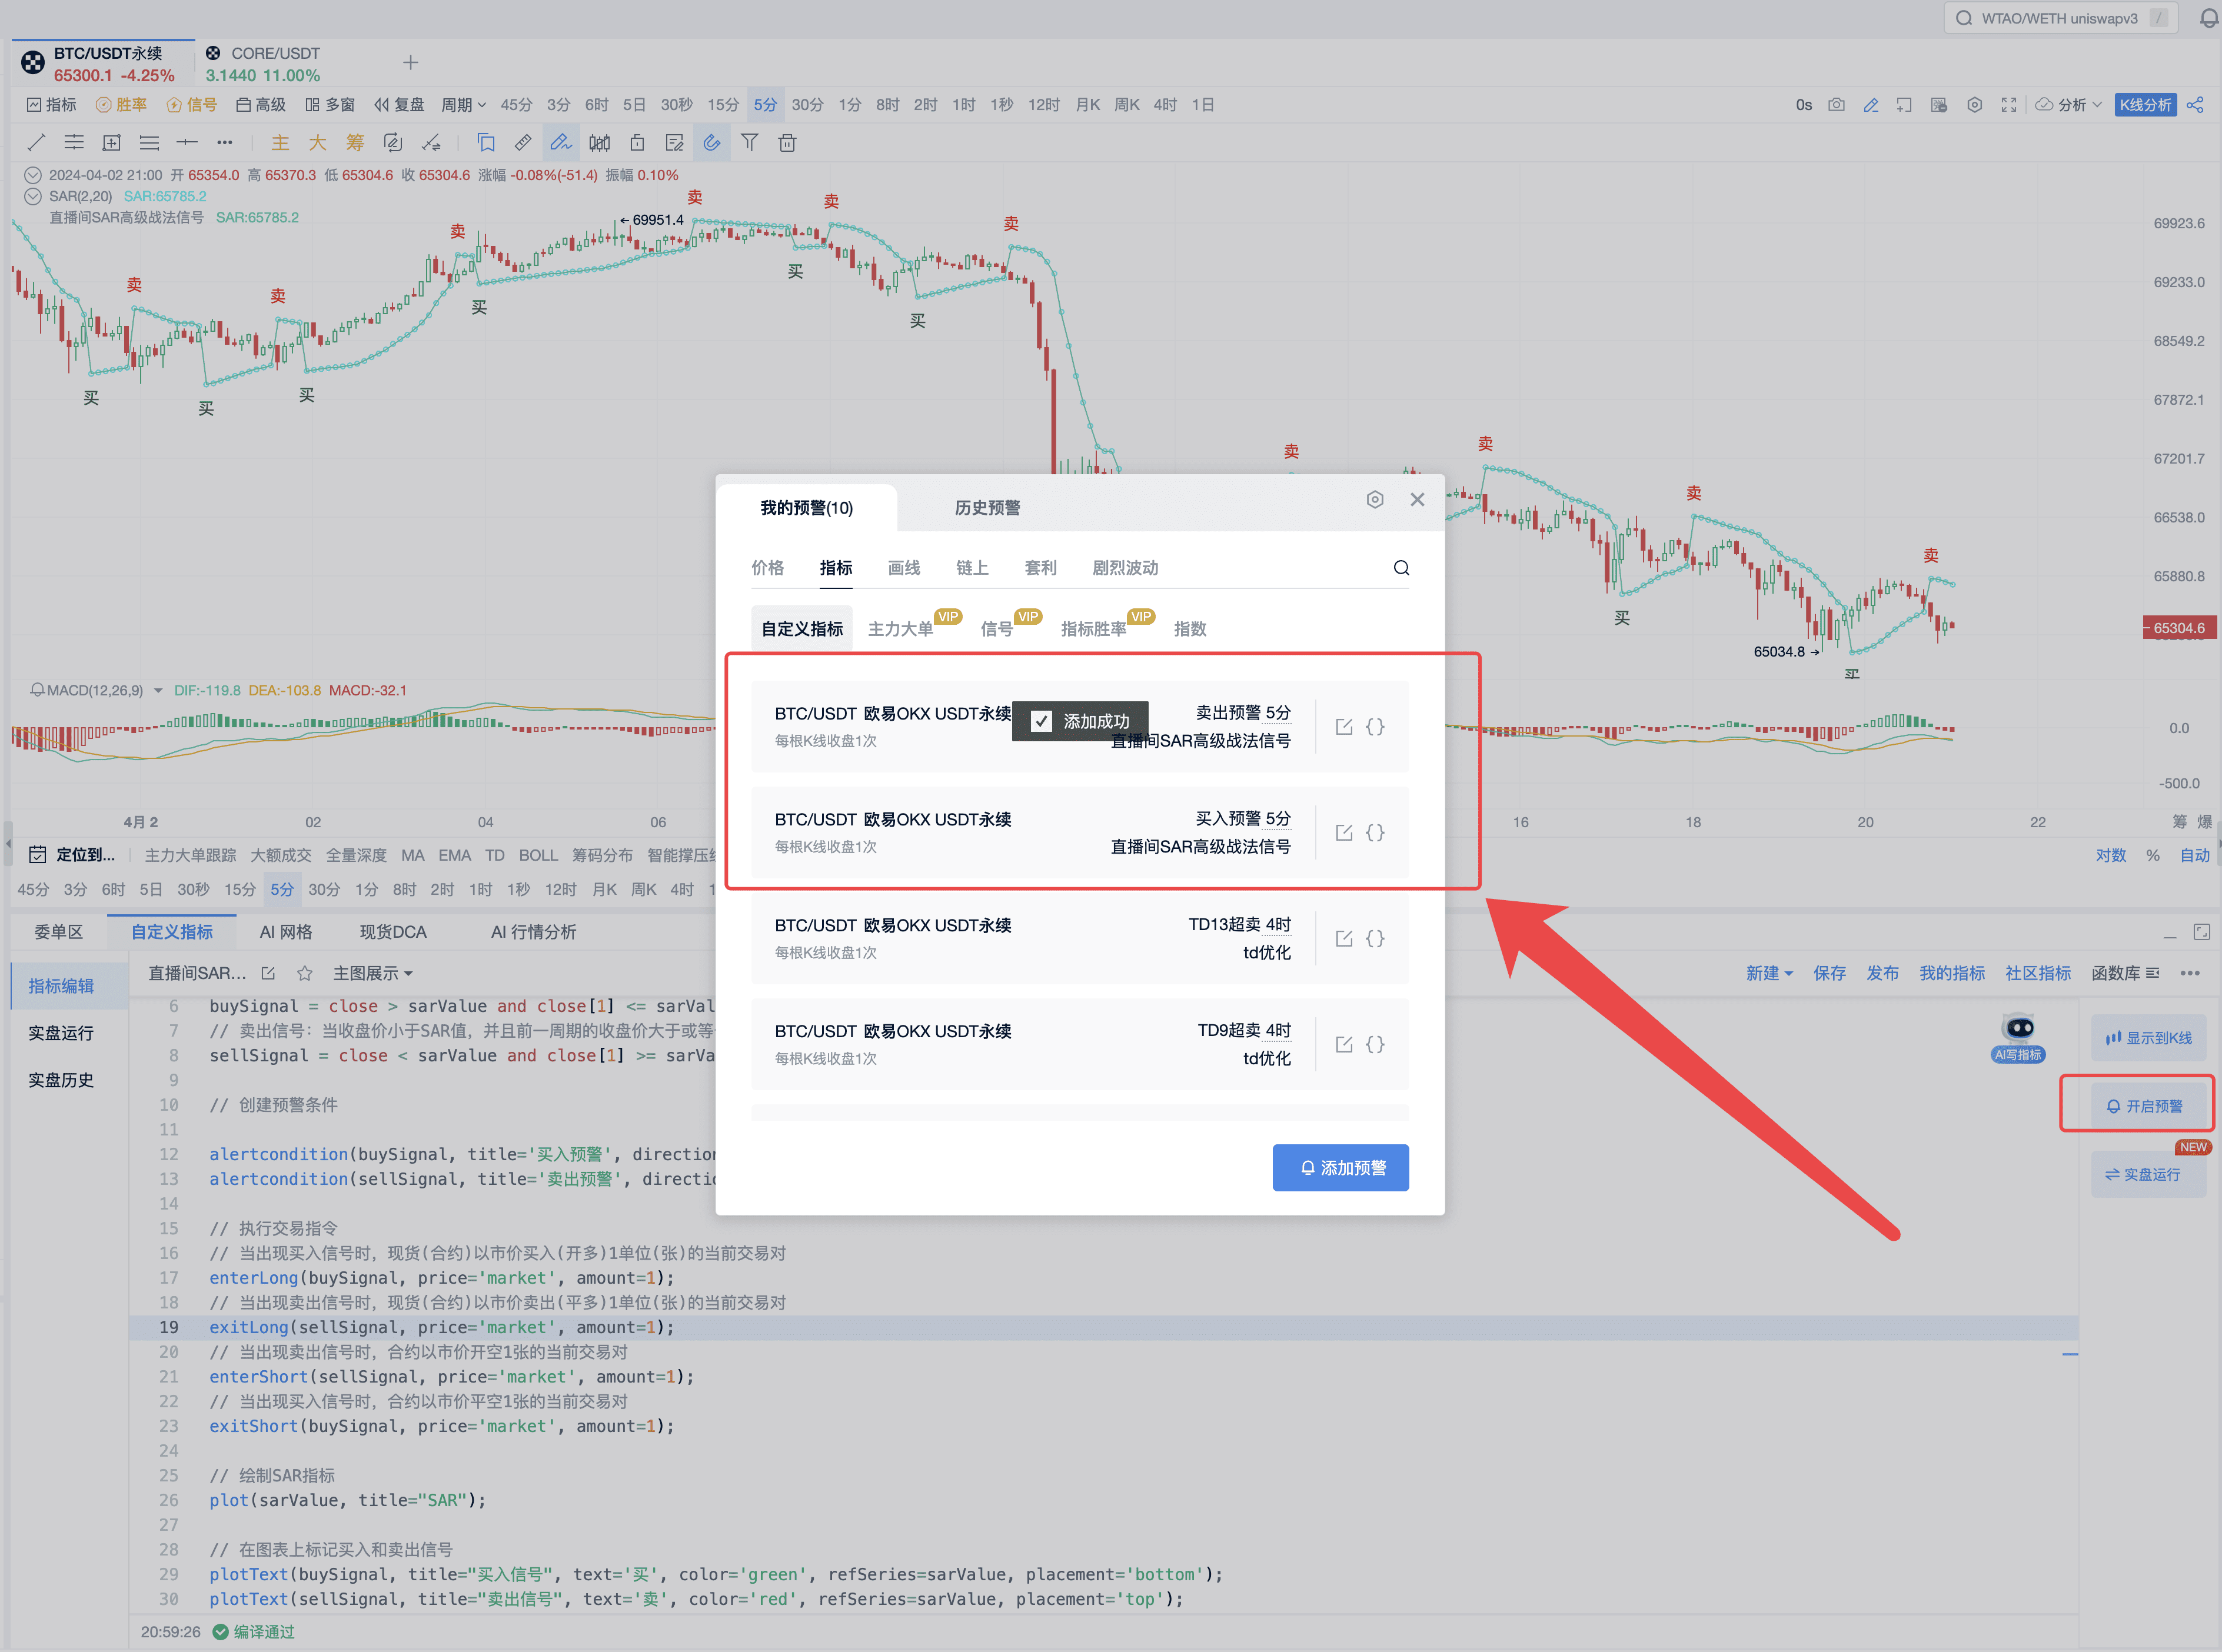
The script in the image sets up buy and sell signals, allowing for alerts and trading. Click on the candlestick to display or add alerts as shown in the image below.
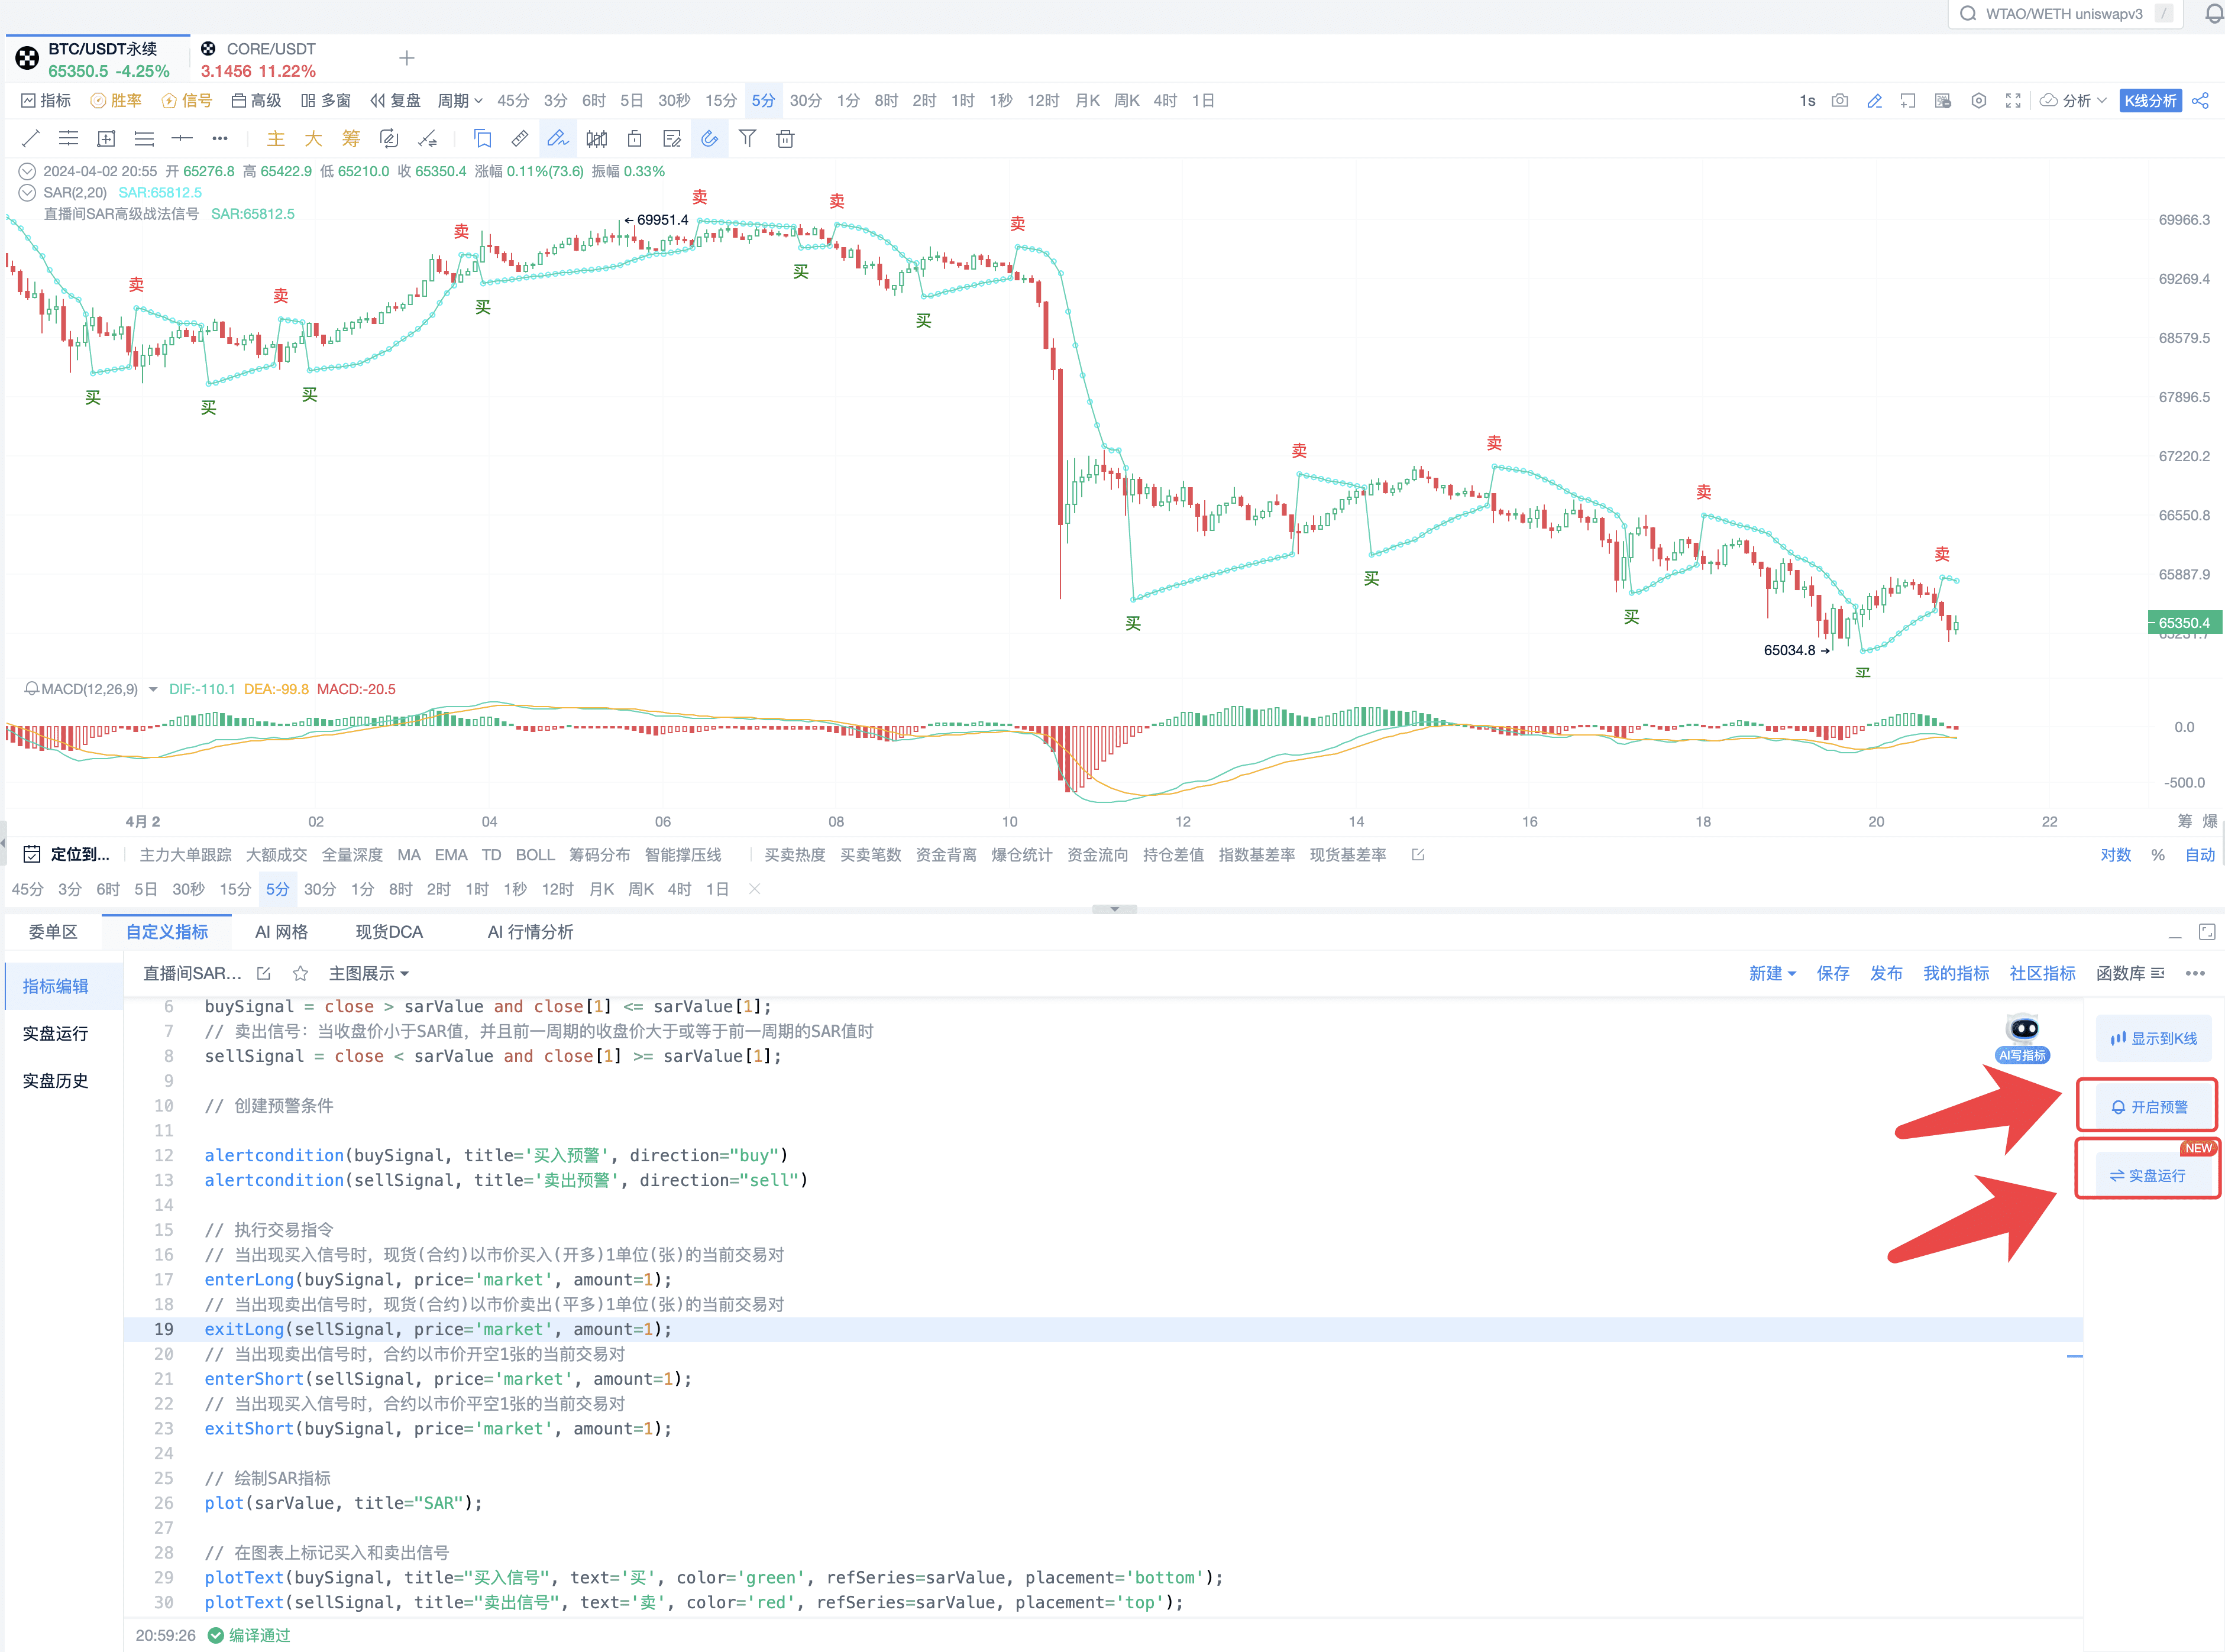
Enable alert reminders as shown in the image below.
Click on "Run in Real Account" to select the opening and closing volume.
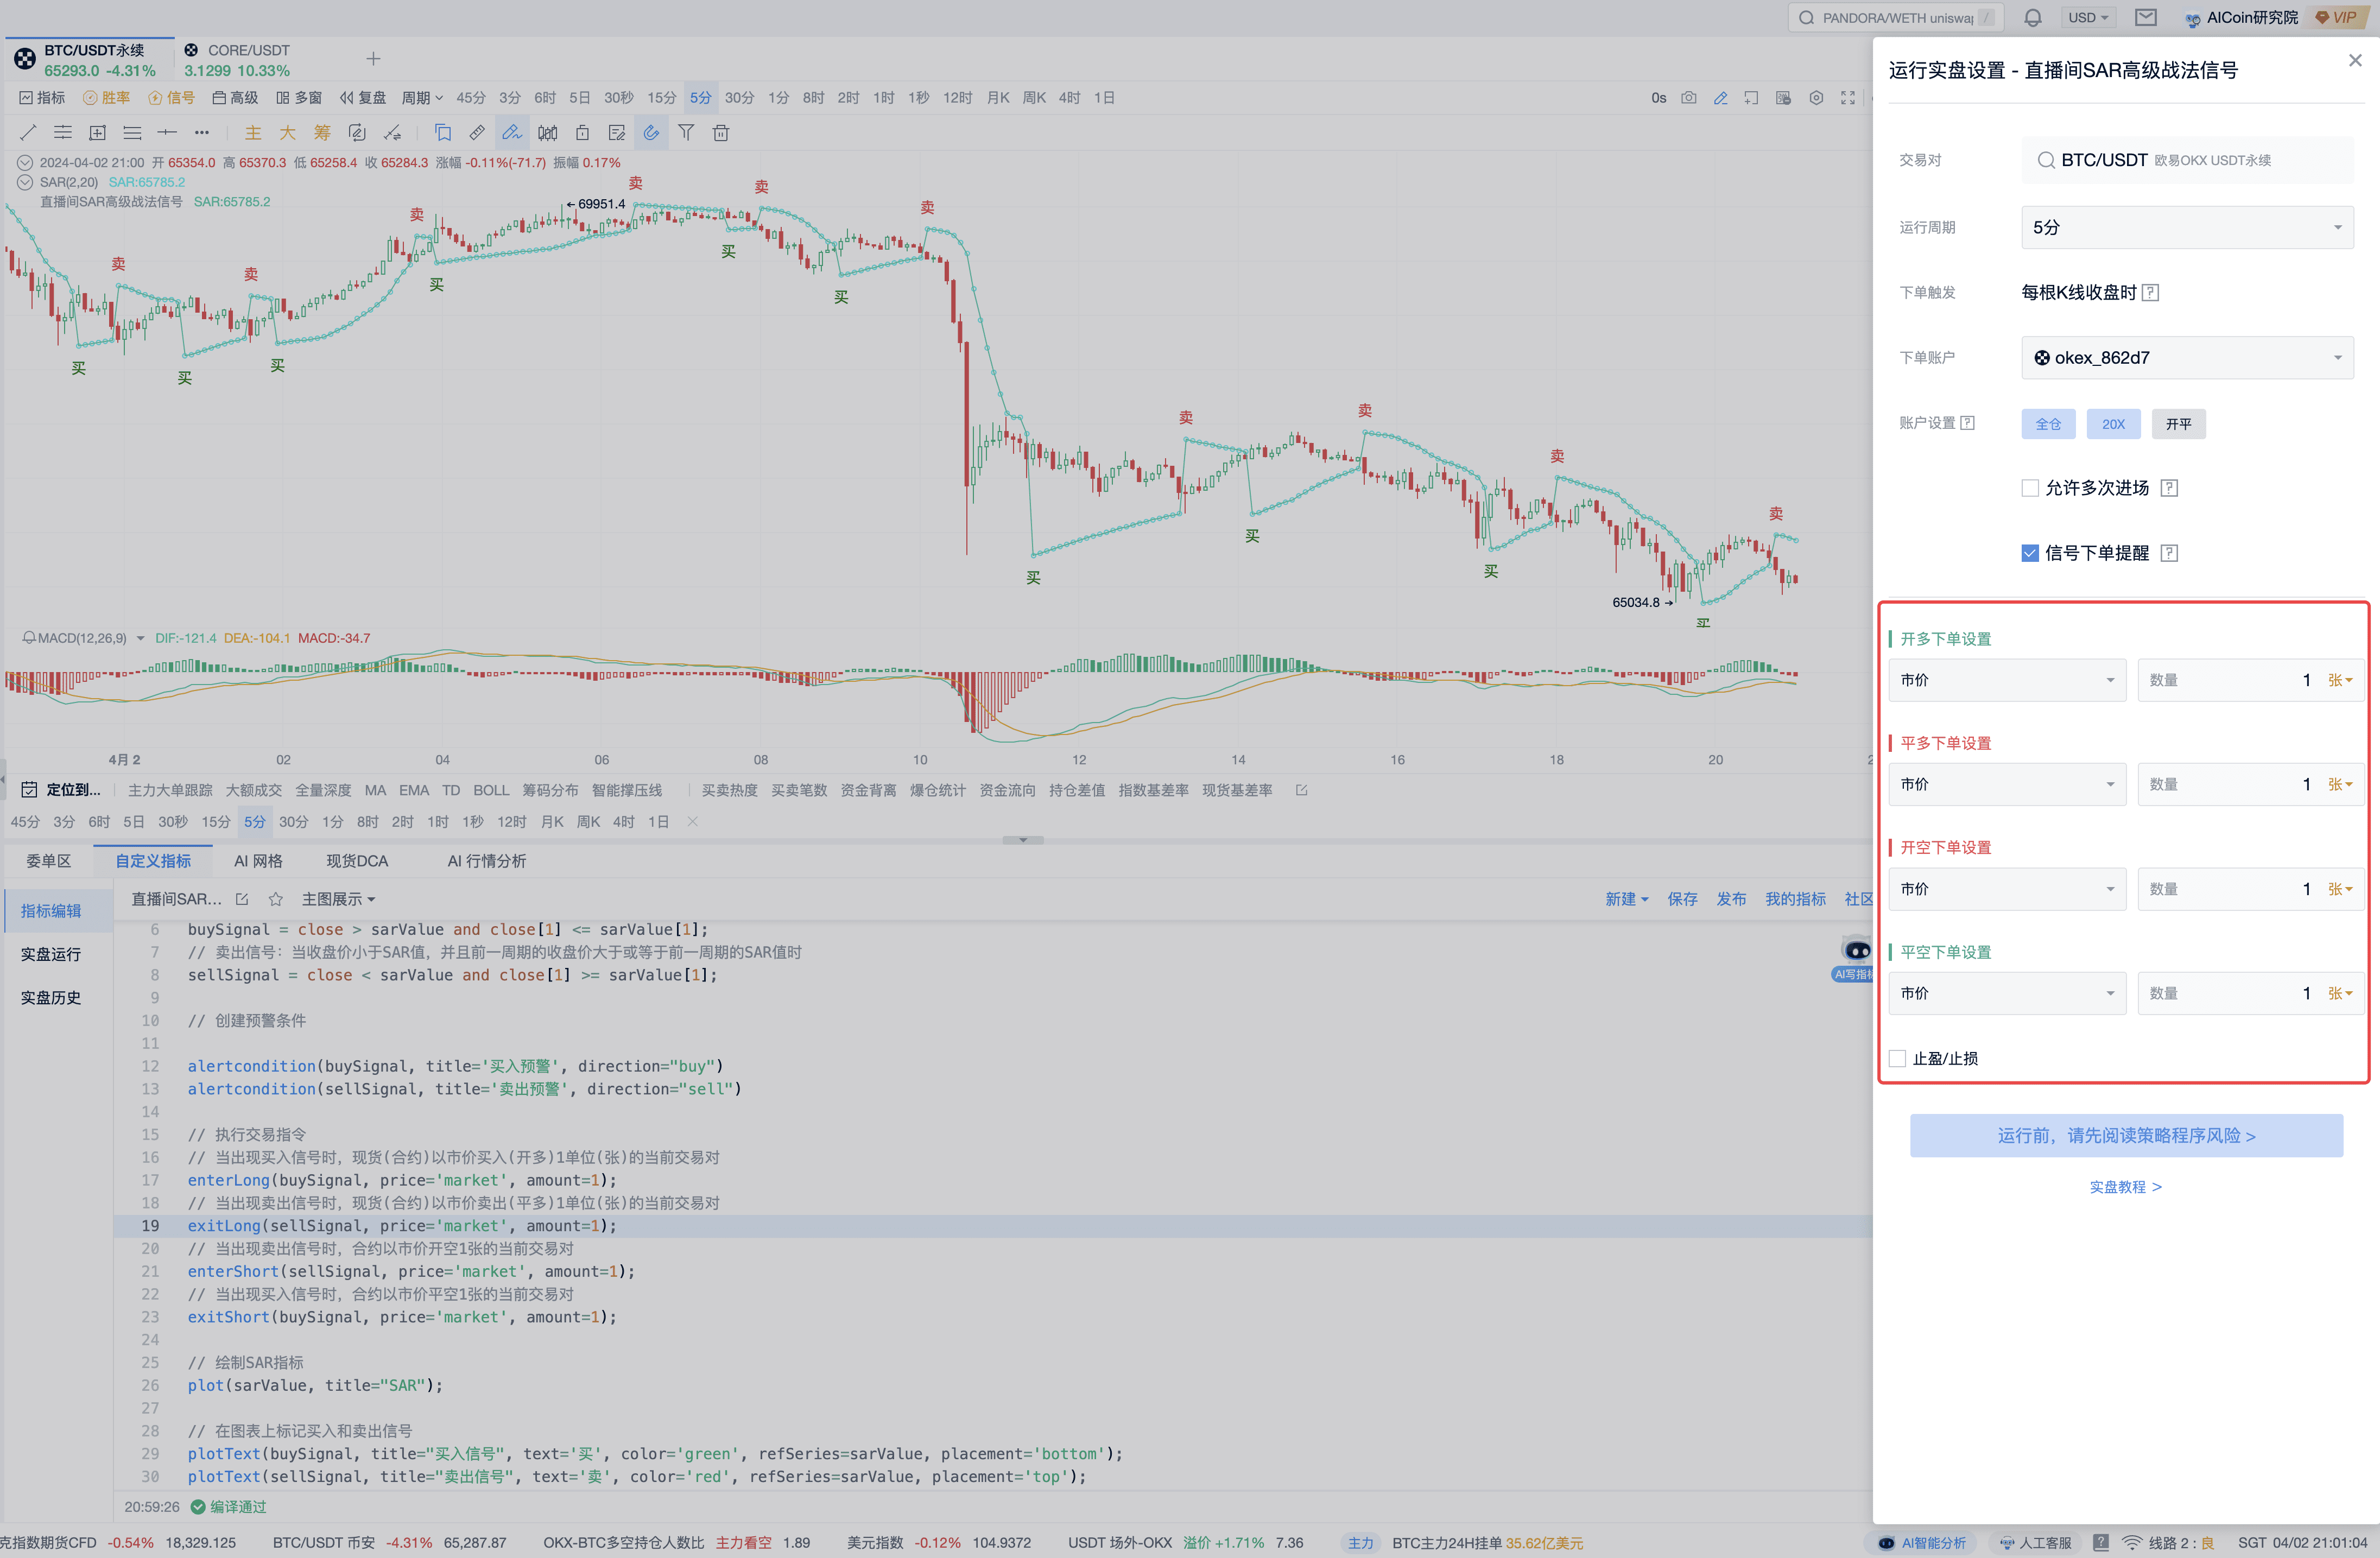
With stop-loss and take-profit, it's completely controllable risk and fully automated trading!
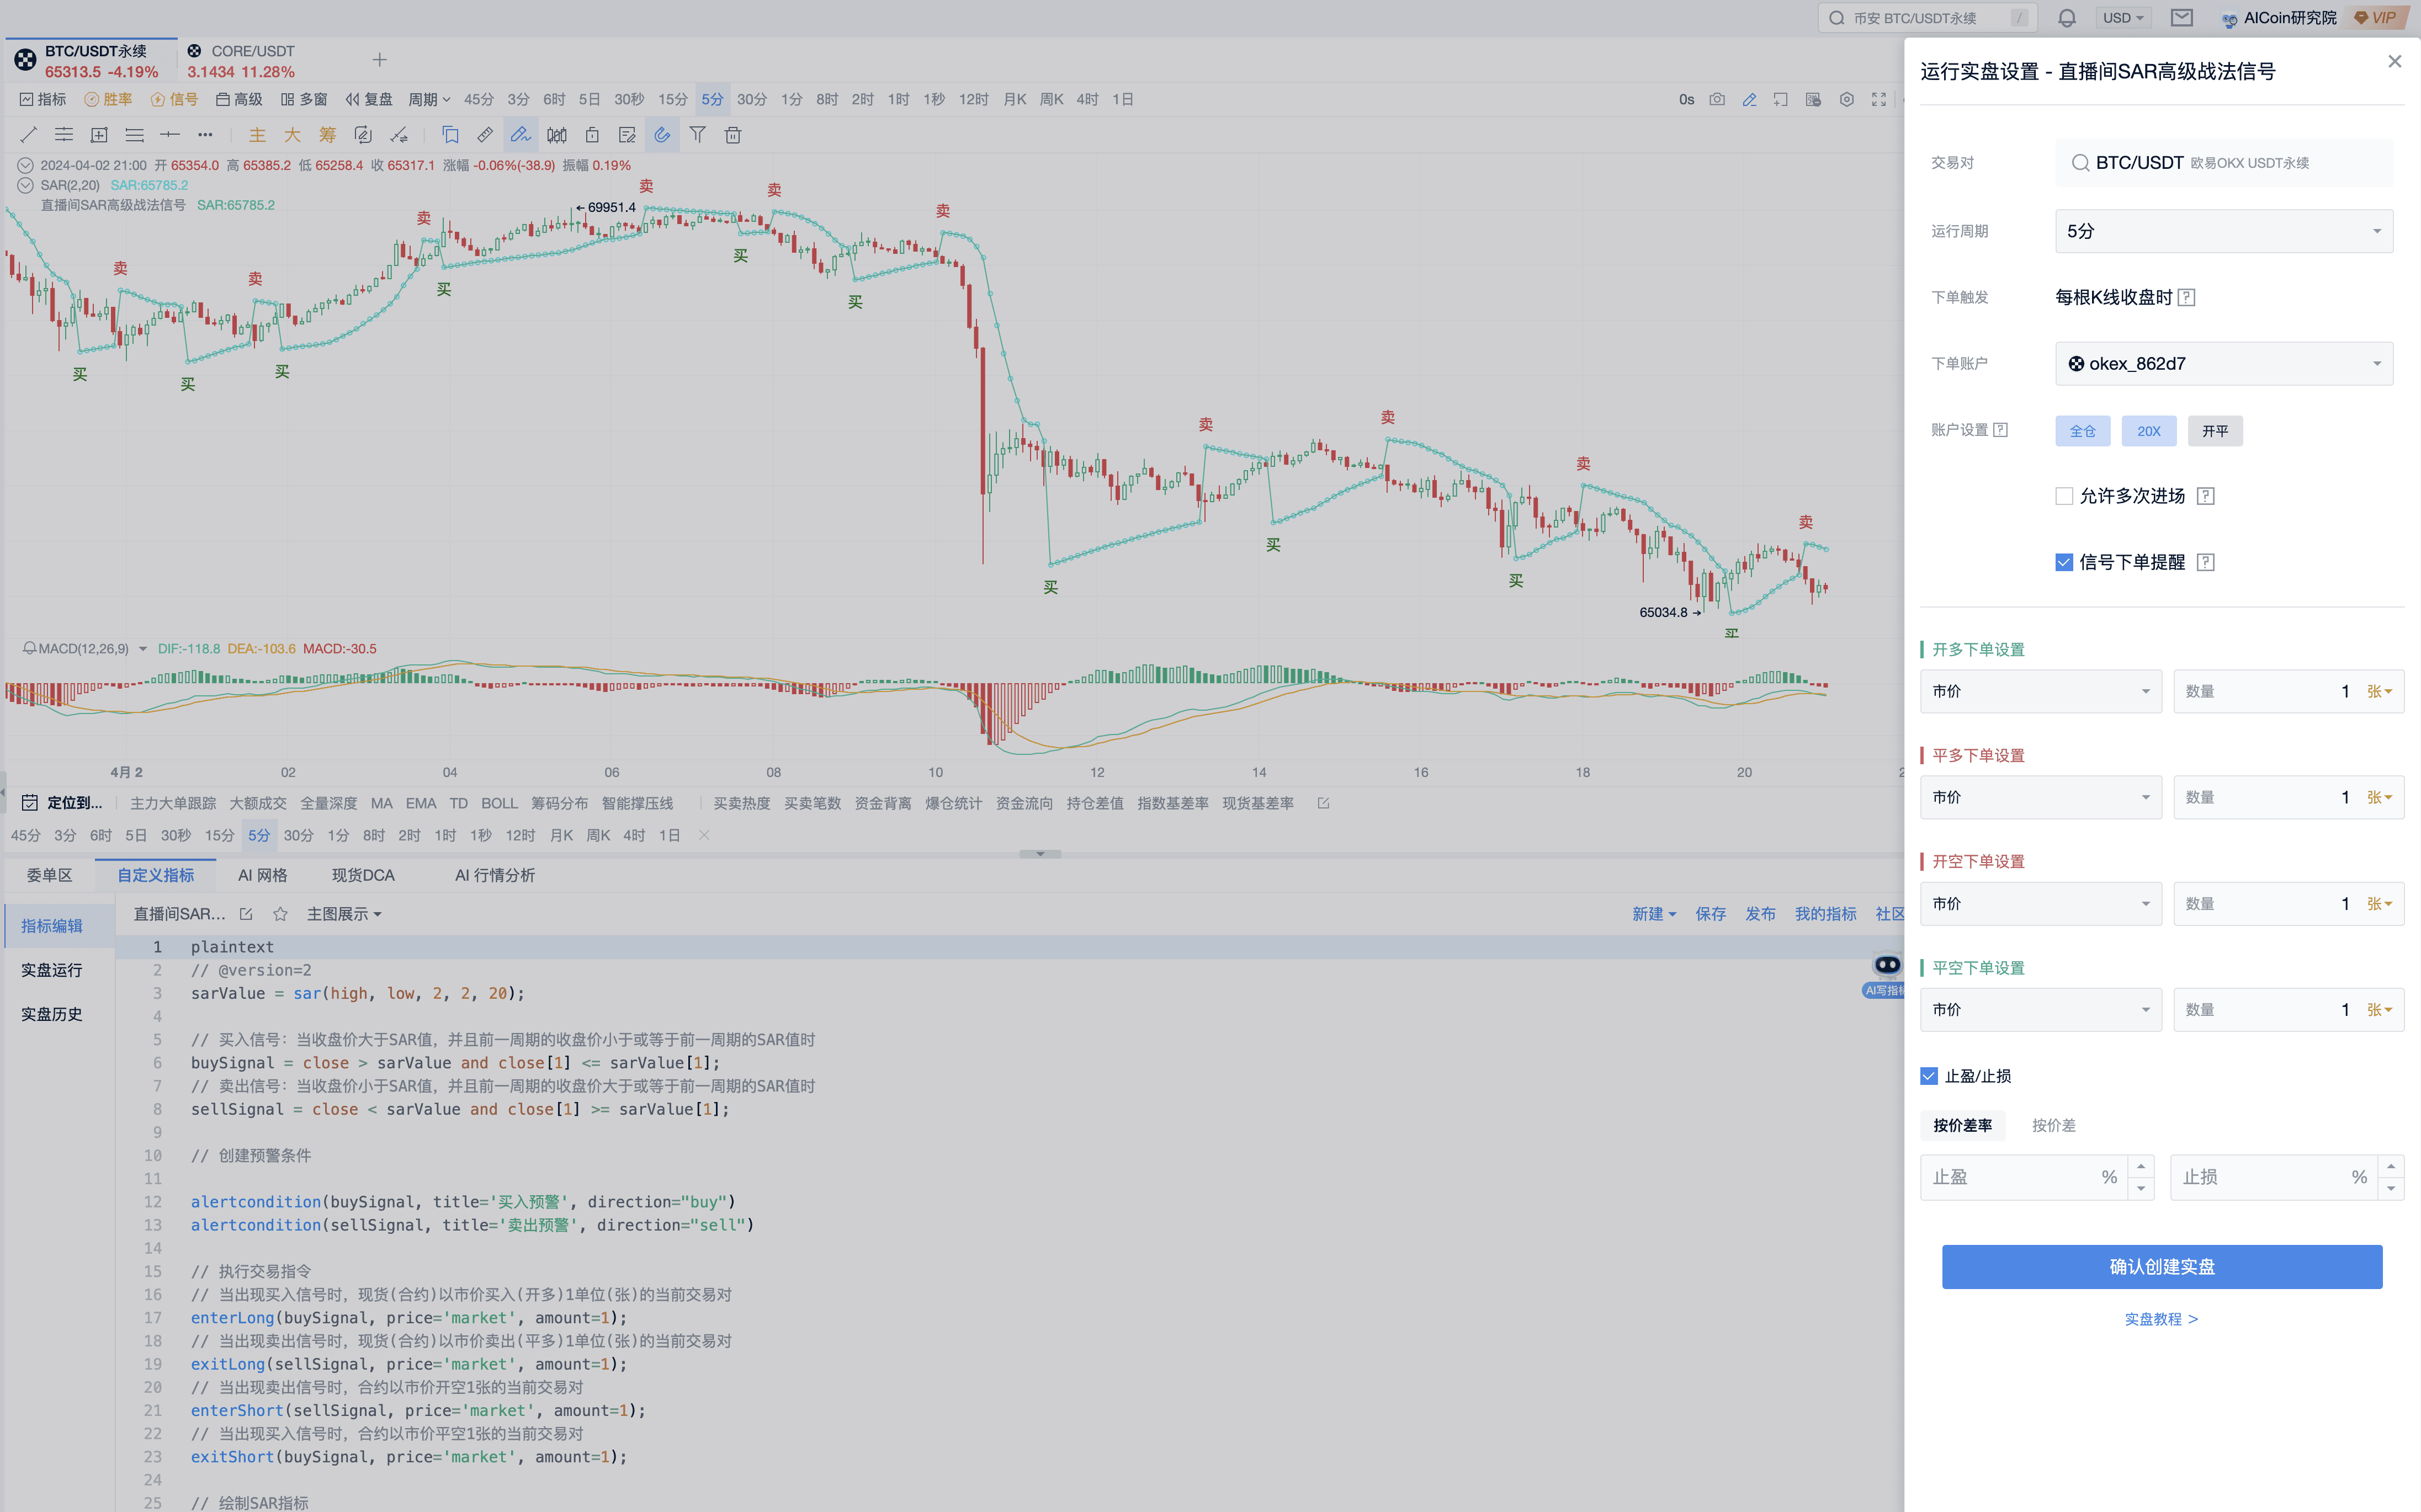
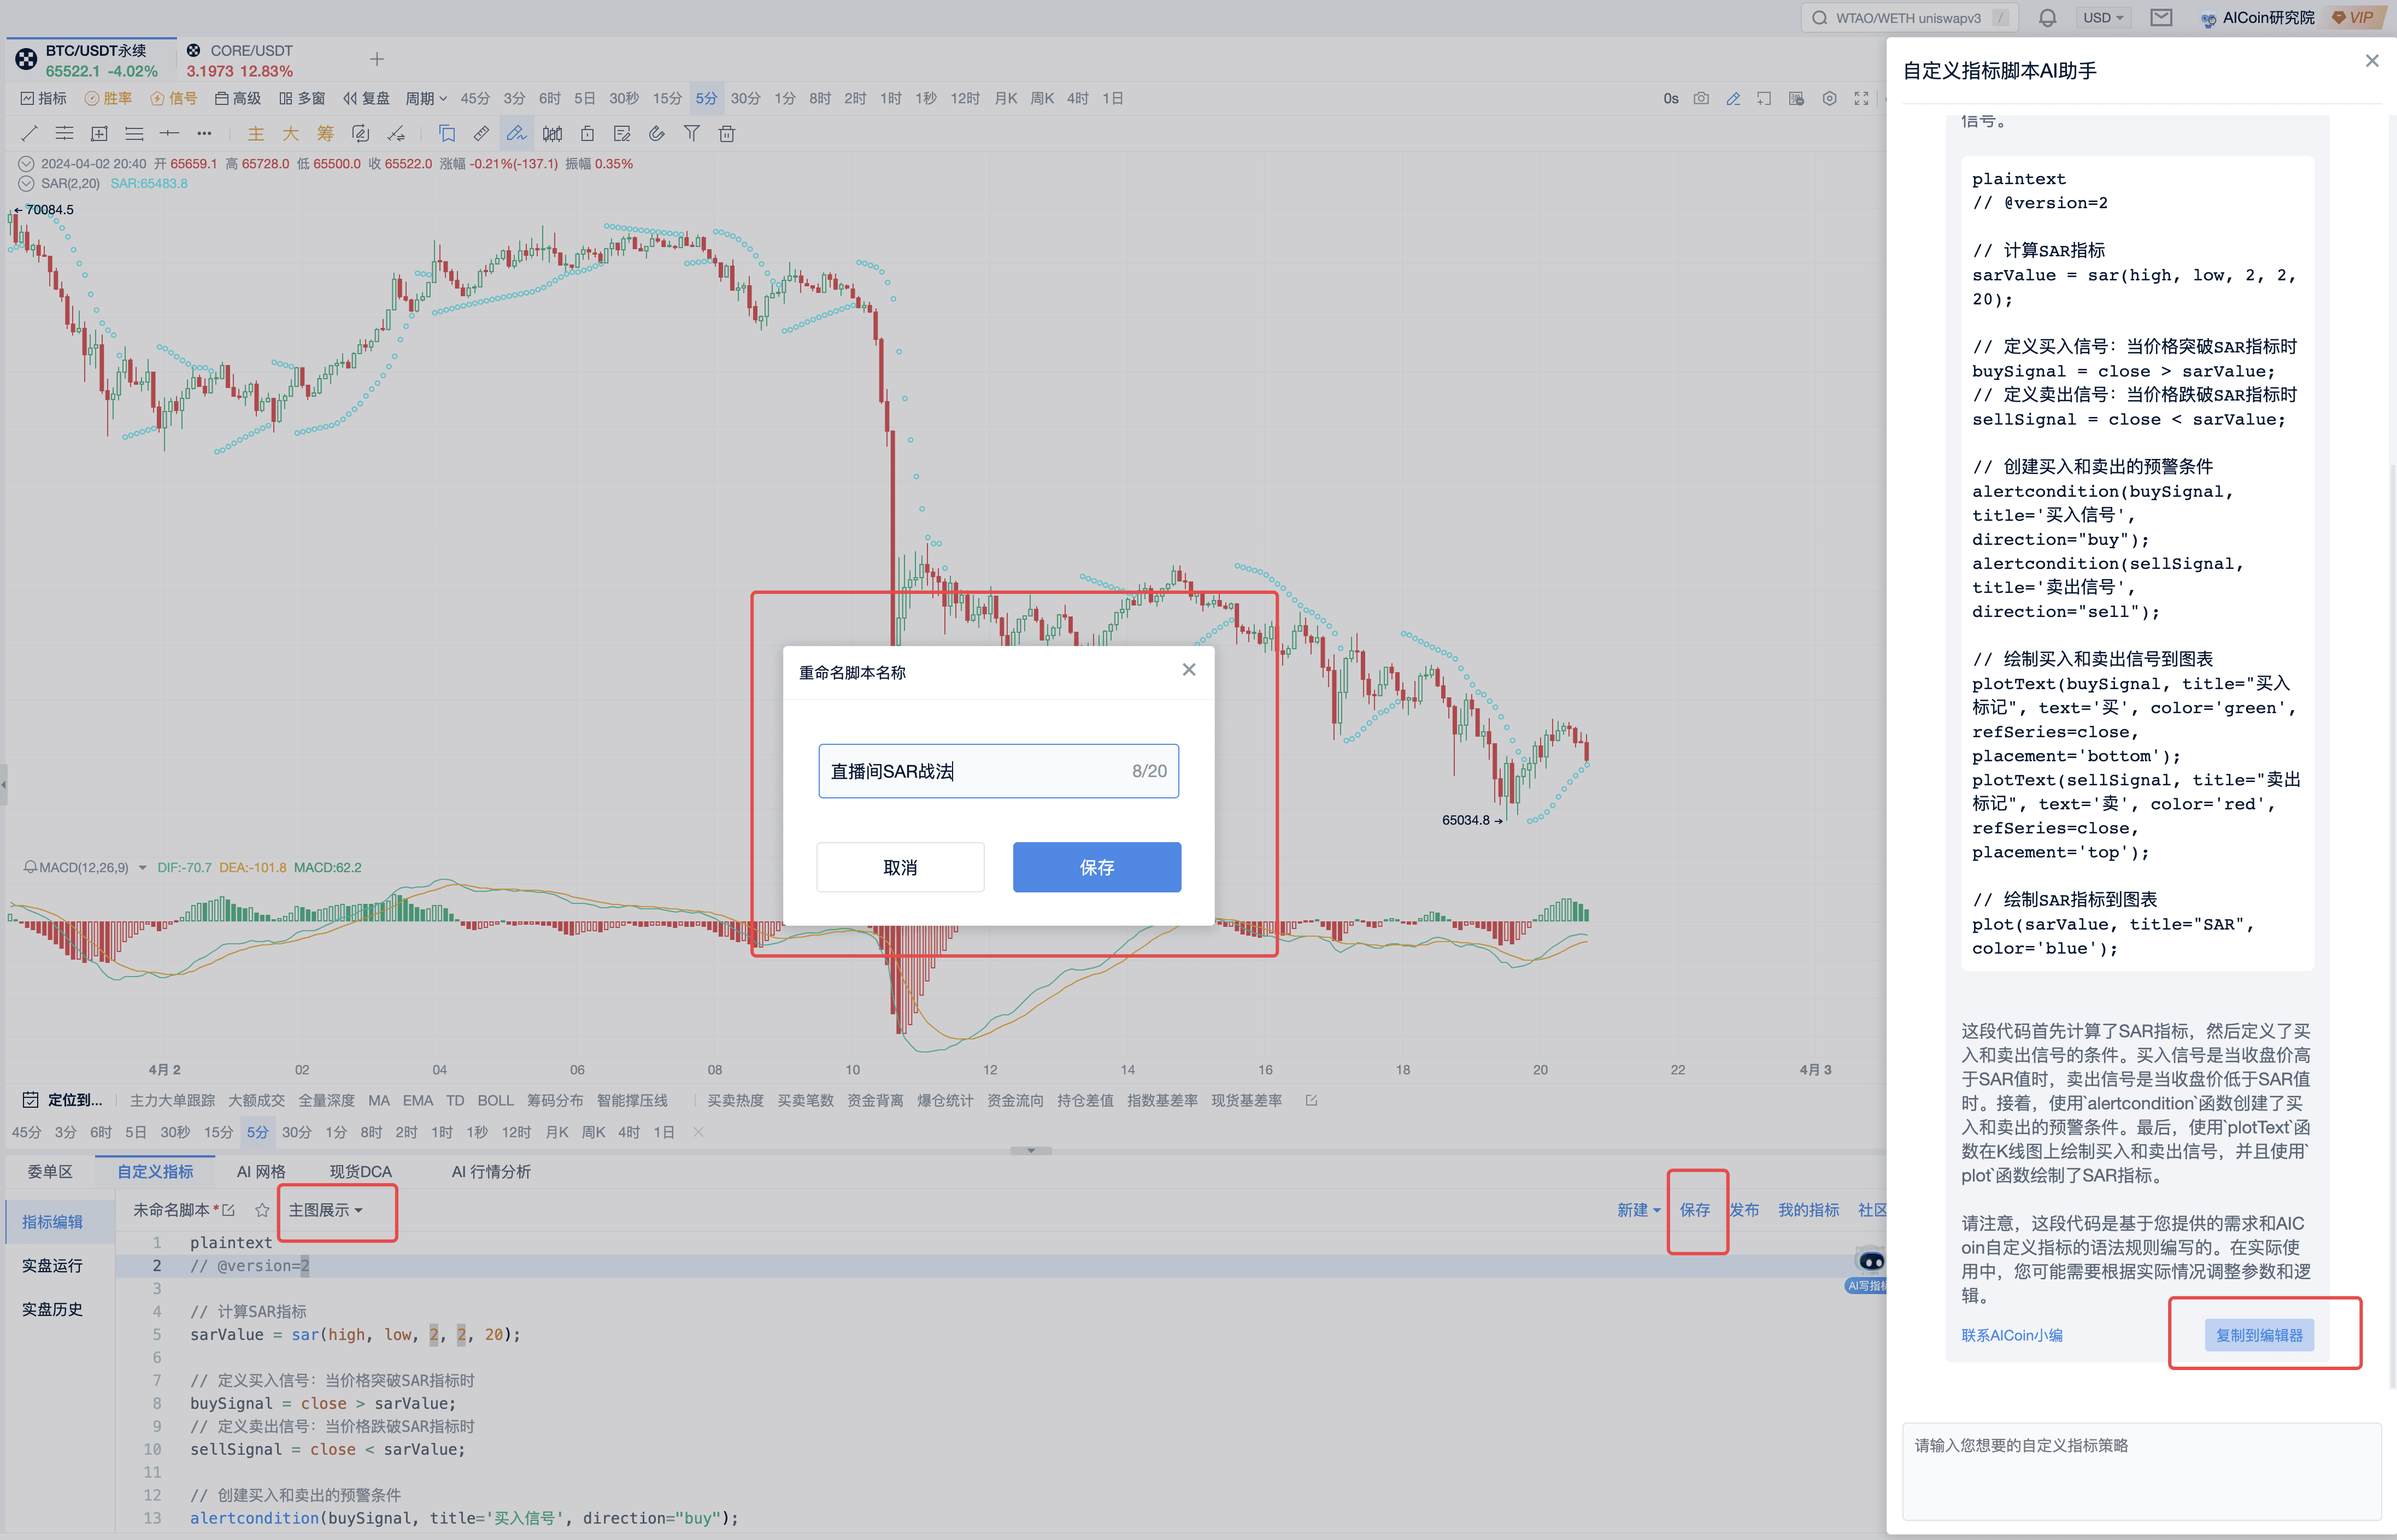
Final Code Display Copy and save this set of tactics, display it on the main chart, and then enable alerts.
   // @version=2

   SARValue = SAR(high, low, 2, 2, 20);

   // Buy signal: When the closing price is greater than the SAR value, and the closing price of the previous period is less than or equal to the previous SAR value
   buySignal = close > SARValue and close[1] <= SARValue[1];

   // Sell signal: When the closing price is less than the SAR value, and the closing price of the previous period is greater than or equal to the previous SAR value
   sellSignal = close < SARValue and close[1] >= SARValue[1];

   // Create alert conditions
   alertcondition(buySignal, title='Buy Alert', direction="buy")
   alertcondition(sellSignal, title='Sell Alert', direction="sell")

   // Execute trading commands
   // When a buy signal appears, buy 1 unit (lot) of the current trading pair at market price in spot (contract)
   enterLong(buySignal, price='market', amount=1);
   // When a sell signal appears, sell 1 unit (lot) of the current trading pair at market price in spot (close long)
   exitLong(sellSignal, price='market', amount=1);
   // When a sell signal appears, open a short position of 1 lot of the current trading pair at market price in the contract
   enterShort(sellSignal, price='market', amount=1);
   // When a buy signal appears, close a short position of 1 lot of the current trading pair at market price in the contract
   exitShort(buySignal, price='market', amount=1);

   // Draw the SAR indicator
   plot(SARValue, title="SAR");

   // Mark buy and sell signals on the chart
   plotText(buySignal, title="Buy Signal", text='Buy', color='green', refSeries=SARValue, placement='bottom');
   plotText(sellSignal, title="Sell Signal", text='Sell', color='red', refSeries=SARValue, placement='top');
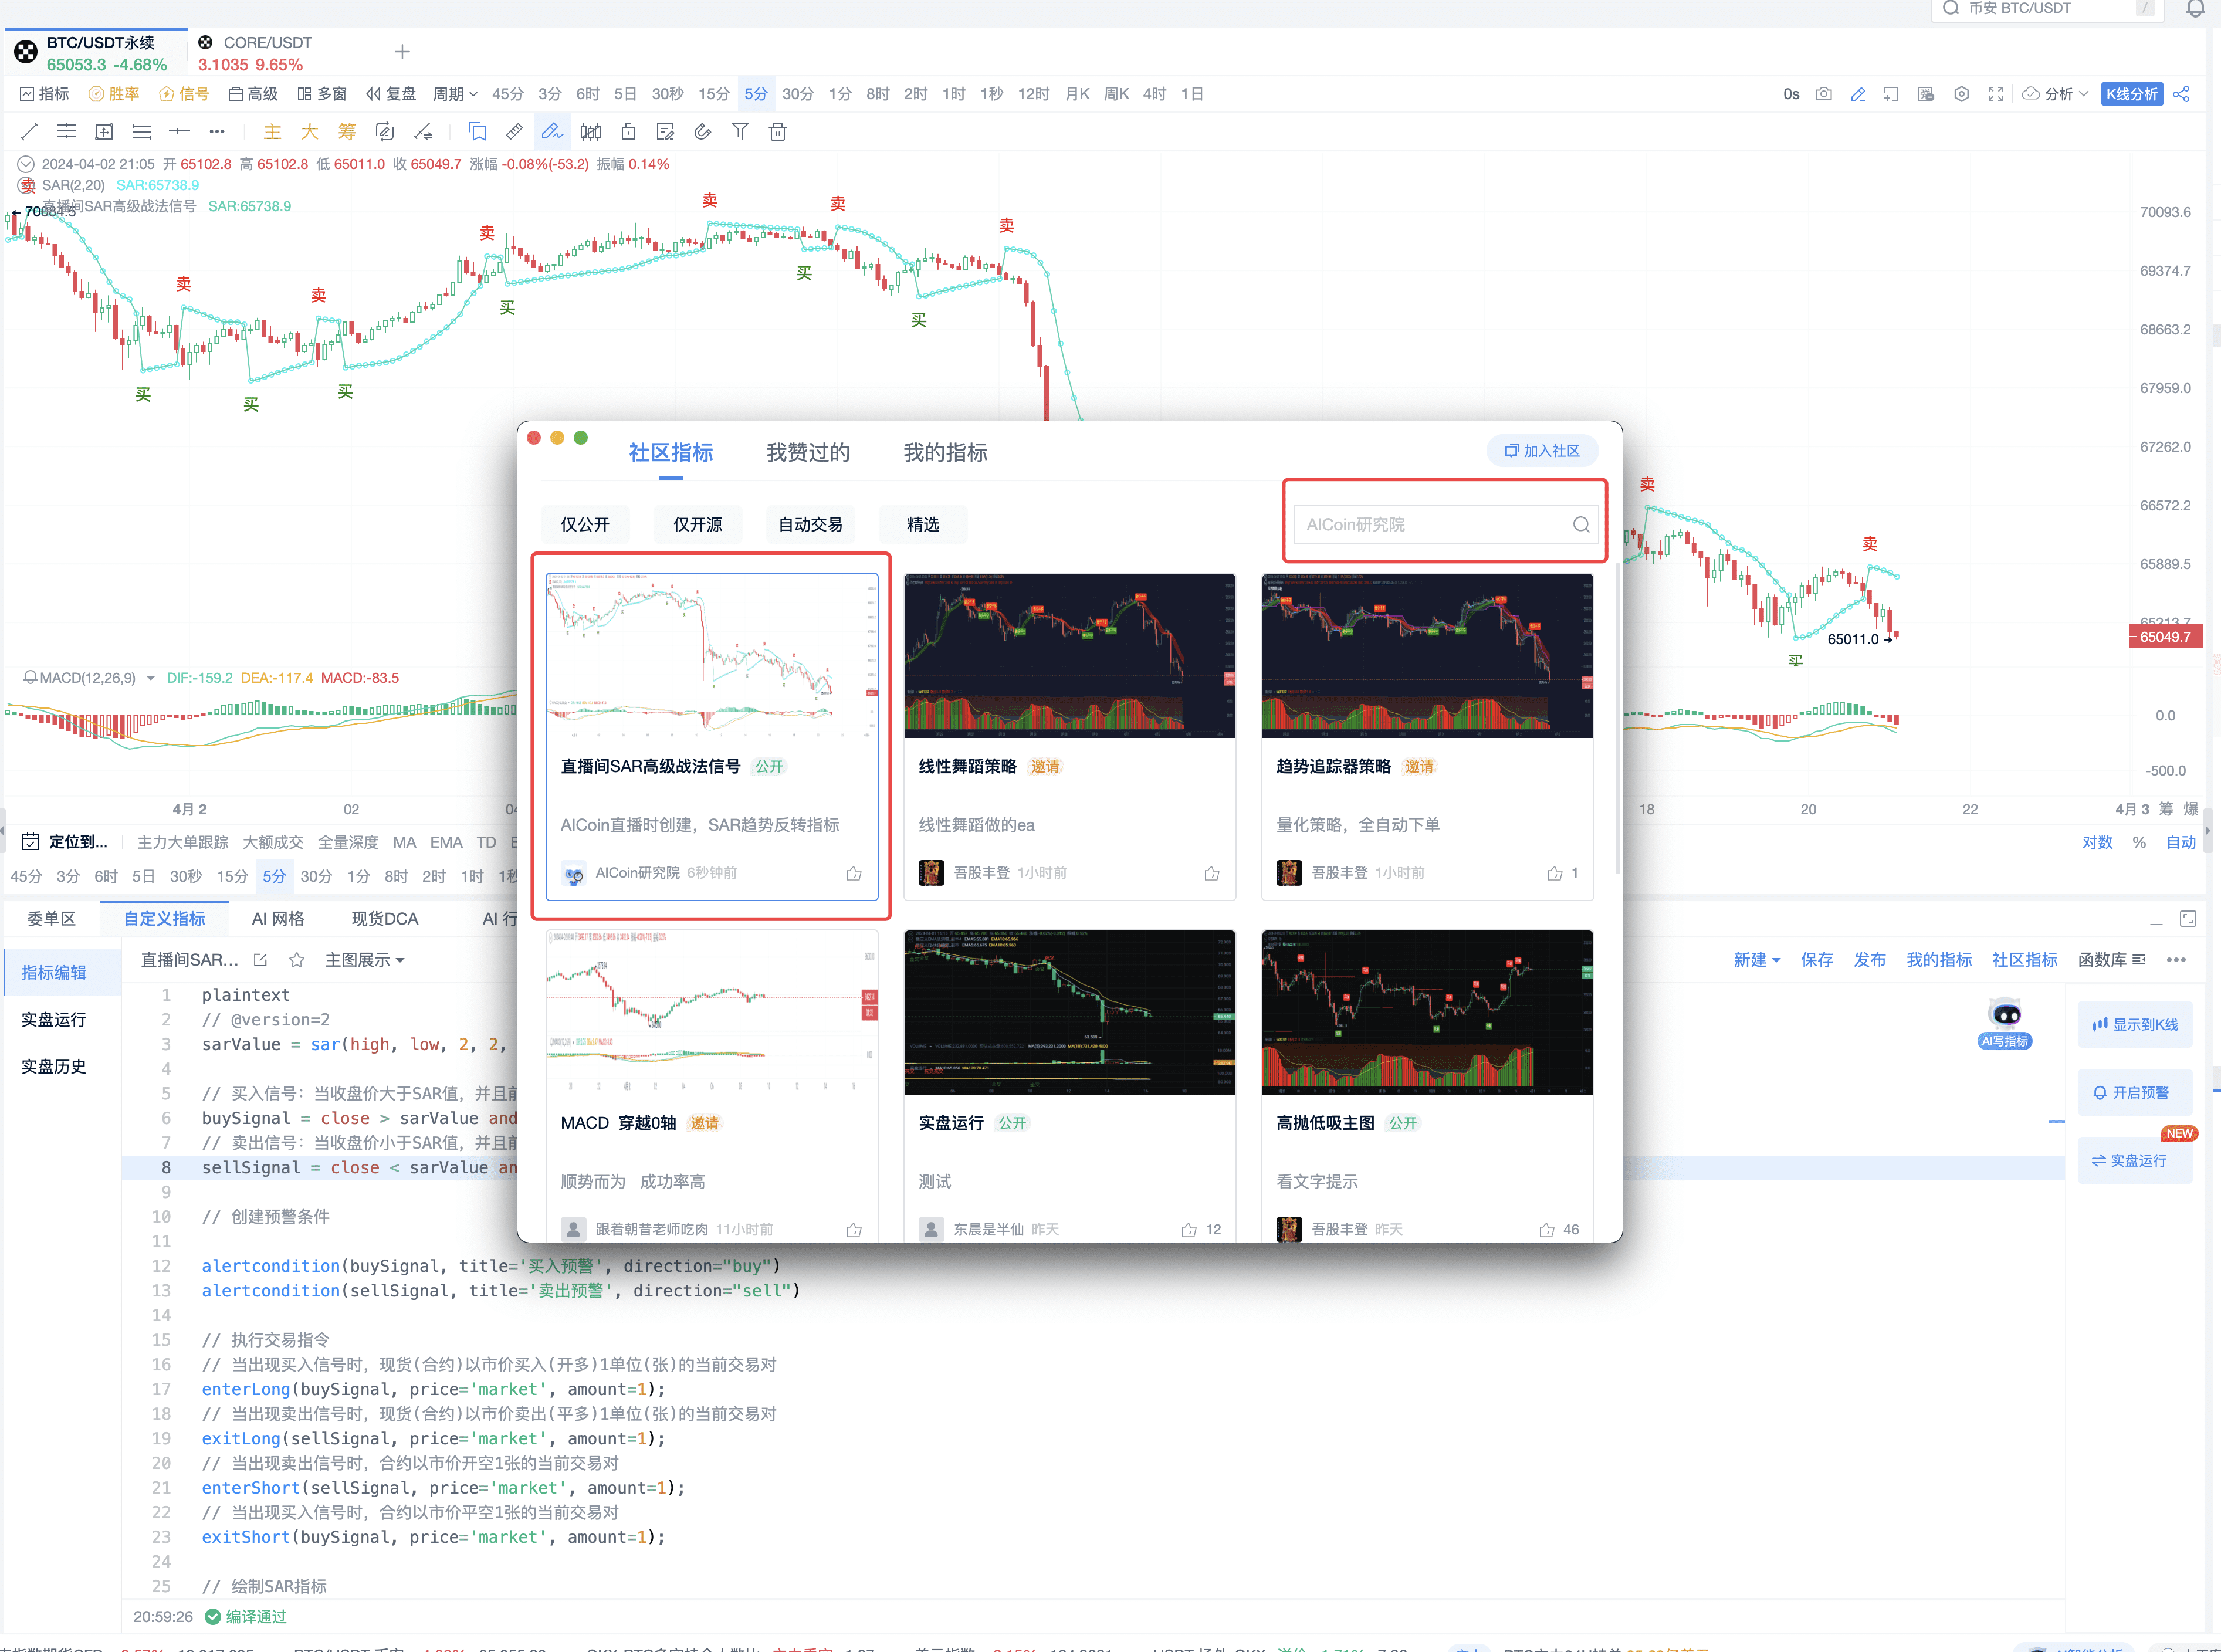
Click to enter the community indicators, and feel free to subscribe!
AI writing indicators can meet many conditions, as long as you present your ideas to AI. Our AI tools and custom indicator tools provide more support for members. If you are interested in AI writing indicators and want to build your own trading strategy, feel free to subscribe to the signal alert/PRO version K-line/indicator win rate. You can experience the custom indicator membership for a limited time for free. Click the link below to subscribe and experience: https://aicoin.app/zh-CN/vip/chartpro
For more live content, please follow AICoin's "News/Information - Live Review" section. Feel free to download AICoin PC-end
免责声明:本文章仅代表作者个人观点,不代表本平台的立场和观点。本文章仅供信息分享,不构成对任何人的任何投资建议。用户与作者之间的任何争议,与本平台无关。如网页中刊载的文章或图片涉及侵权,请提供相关的权利证明和身份证明发送邮件到support@aicoin.com,本平台相关工作人员将会进行核查。