The ancients said: "Reading ten thousand books is not as good as traveling ten thousand miles; traveling ten thousand miles is not as good as having a famous teacher to guide you." In the field of digital currency, this famous saying is even more precious. It is well known that accumulating information and broadening one's knowledge is the first step to acquiring wisdom. However, the digital currency market is constantly changing and full of variables. It is difficult to deal with the challenges of practice based solely on theory. Only when one is in the situation can they truly understand the difficulties of moving forward. Traveling ten thousand miles may be awe-inspiring or inspiring, but it is full of dangers, like walking on thin ice. However, with the careful guidance of Li Hui, one can avoid going astray, manage risks, and walk alone in this vast world. Li Hui is willing to explore the mysteries of digital currency with everyone, to open up the path of investment, and not to disappoint the golden age. Li Hui hopes that you will pick up the banner of struggle, follow Li Hui, and embark on this challenging and opportunistic journey together. Let us break through the waves together and write your own brilliance!

Today, Zhang Lihui shares a detailed explanation of commonly used technical indicators:
KDJ pattern, MACD interpretation, and EMA moving average are commonly used tools in technical analysis, used to predict market trends and formulate trading strategies. Below is Li Hui's detailed explanation of these three concepts.
First, let's talk about the KDJ pattern. The KDJ indicator is used to measure the overbought and oversold conditions of the coin price or other trading assets. It consists of three lines: K line, D line, and J line. The K line represents the ratio of the closing price to the lowest price within a certain period of time, the D line is a smoothed line based on the K line, and the J line is calculated based on the values of the K line and D line. The value of the KDJ indicator usually fluctuates between 0 and 100. If it exceeds 80, it indicates overbought, and if it is below 20, it indicates oversold.
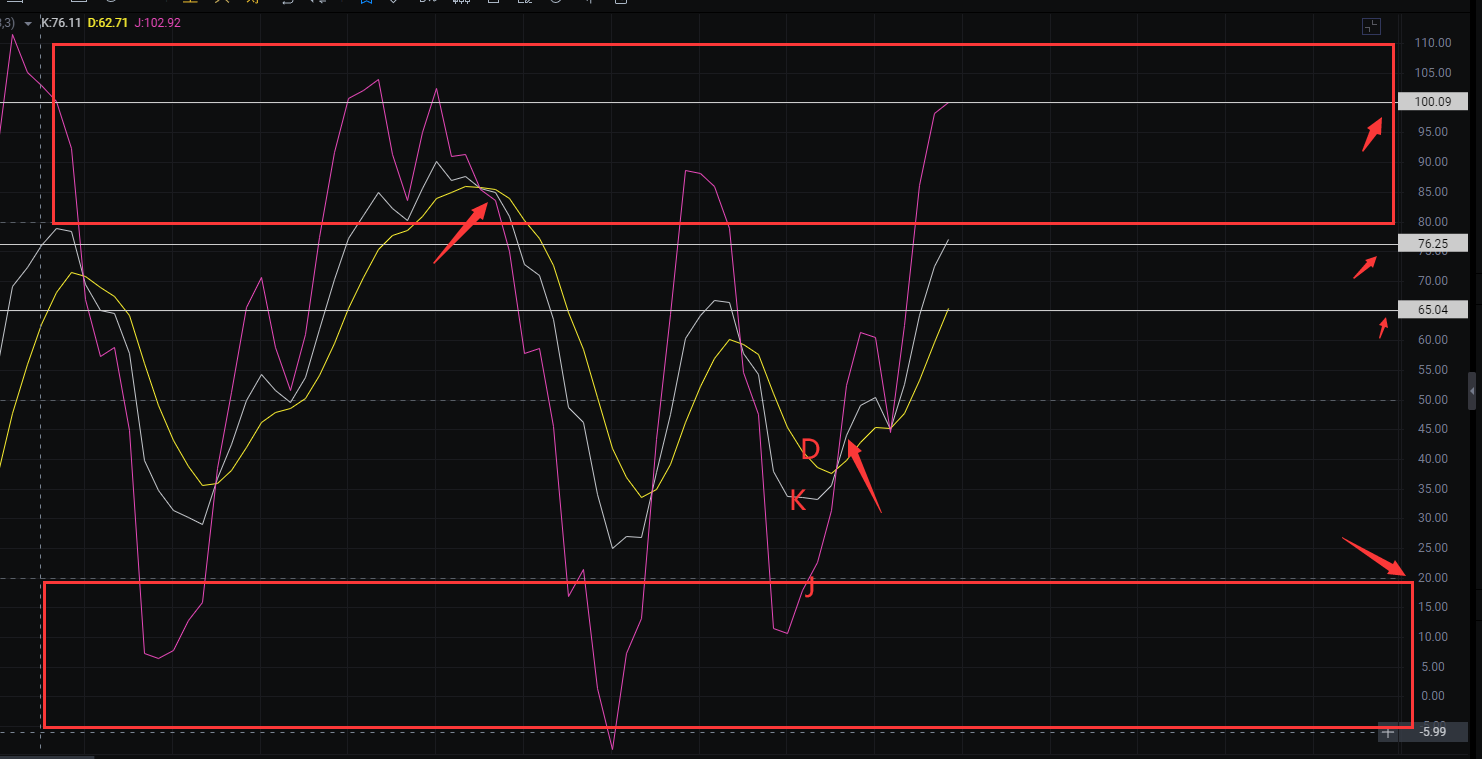
The KDJ pattern can be displayed by the KDJ line of the coin you want to trade. When the K line crosses below the D line and the value of the KDJ indicator is below 20, it indicates that the coin price is oversold, which is a good buying opportunity. Conversely, when the K line crosses above the D line and the value of the KDJ indicator is above 80, it indicates that the coin price is overbought, which is a good time to sell.
Next is the MACD interpretation. MACD (Moving Average Convergence/Divergence) is a trend indicator that measures price fluctuations. It consists of two lines and a histogram: the DIF line, the MACD line, and the histogram. The DIF line is the difference between the short-term exponential moving average and the long-term exponential moving average, while the MACD line is the exponential moving average of the DIF line. The histogram represents the difference between the DIF line and the MACD line.
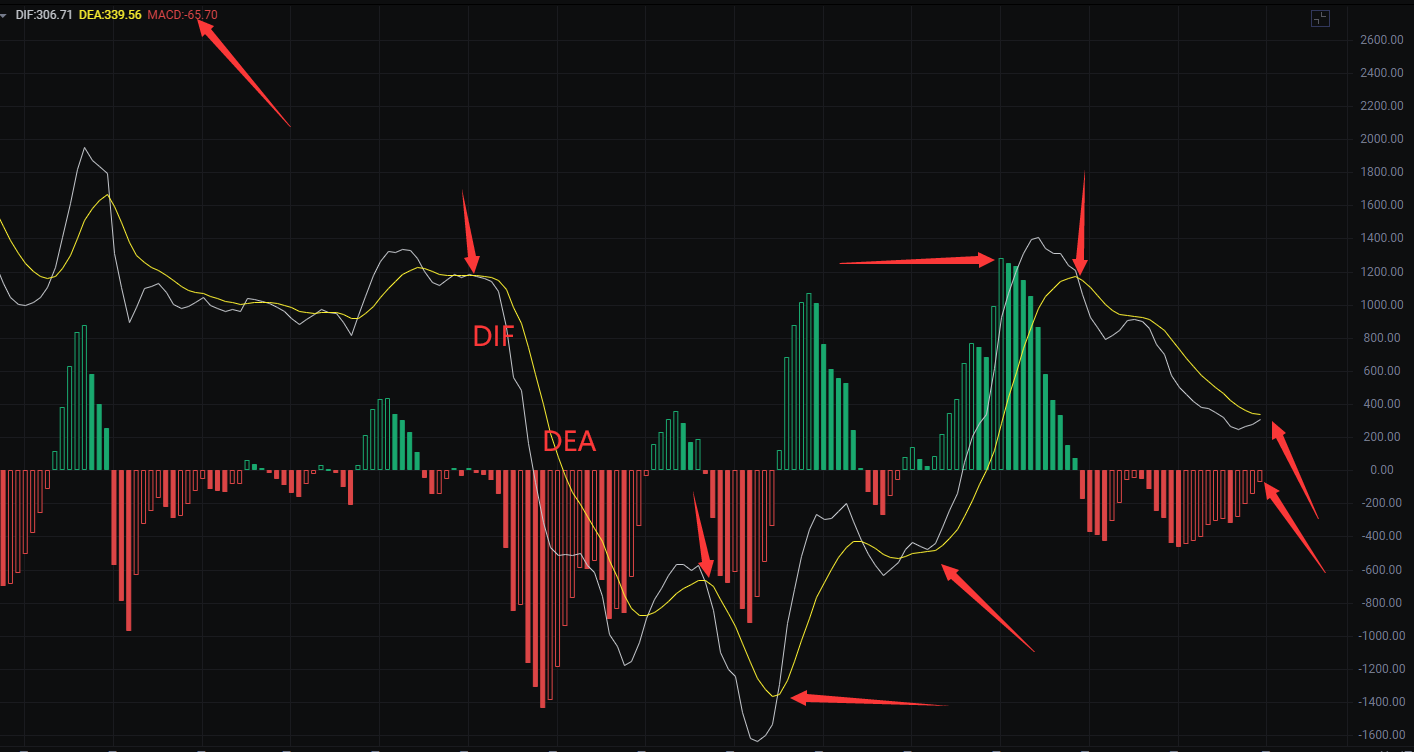
The MACD interpretation can be used to judge market trends by observing the relationship between the DIF line, the MACD line, and the histogram. When the DIF line crosses above the MACD line and the histogram turns from negative to positive, it indicates an upward trend in the coin price, which is a buy signal. Conversely, when the DIF line crosses below the MACD line and the histogram turns from positive to negative, it indicates a downward trend in the coin price, which is a sell signal.
Finally, the EMA moving average interpretation. EMA (Exponential Moving Average) is an indicator that smoothes the price trend of the coin. It calculates the average price of the coin over a certain period of time based on certain weighting coefficients. Compared to other moving averages, EMA is more sensitive and can react to price changes more quickly.
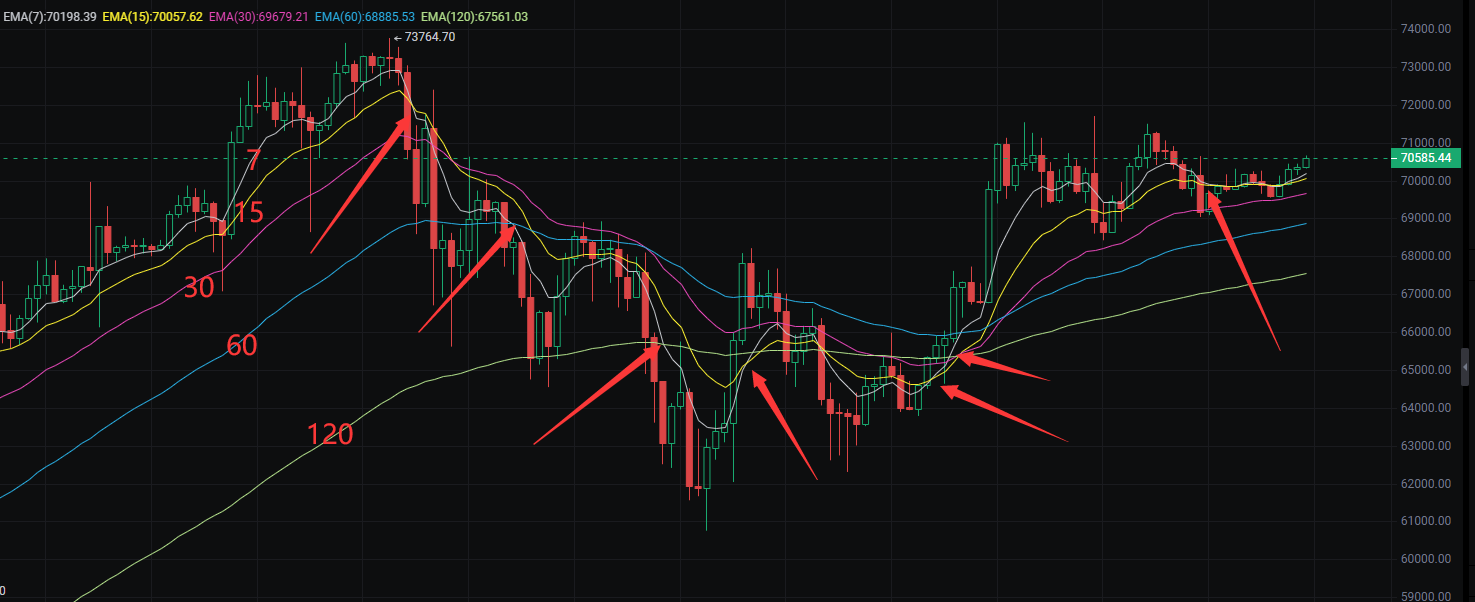
The EMA moving average interpretation can be used to judge market trends by observing the relationship between the coin price and the EMA line. When the coin price is above the EMA line and the EMA line is trending upward, it indicates an upward trend in the coin price, which is a buy signal. Conversely, when the coin price is below the EMA line and the EMA line is trending downward, it indicates a downward trend in the coin price, which is a sell signal.
In summary, Li Hui believes that KDJ pattern, MACD interpretation, and EMA moving average are all important tools for technical analysis and trading decisions. By understanding and using these tools, traders can more accurately predict market trends and make corresponding trading decisions. However, Li Hui reminds everyone to pay attention to the fact that these tools are only auxiliary and cannot solely determine trading strategies. It is also necessary to conduct comprehensive analysis combining fundamental factors and other aspects.

I, Li Hui, interpret world economic news, analyze the global trend of the coin circle, and have conducted in-depth research on BTC, ETH, LTC, DOT, EOS, BNB, SOL, and other coins while studying and furthering my education in the United States. For those who are not familiar with the operations, you are welcome to comment and leave a message!
You can follow the author by scanning the QR code below!

This article is exclusively published by (WeChat Official Account: Zhang Lihui) and does not represent any official position. The publication and review of the article have a time delay, and the above points are for reference only. Risk is self-borne! May we always carry humility and courage in this complex world of digital currency, fear no challenges, and dare to explore. Just as traveling ten thousand miles, "the road ahead is long and distant, I will seek and explore." May we read ten thousand books, keep pace with the times, and draw wisdom. Travel ten thousand miles, experience storms, witness scenery, and comprehend life. With Li Hui's guidance, may you heed advice, play to your strengths, and create value together. May we always remember the baptism of the market, not forget our original intentions, and move forward with determination. In the wave of digital currency, holding onto faith with Li Hui, let us forge ahead with perseverance. May we jointly compose the future's brilliant chapter and share the joy of success. Let us gather in the turbulent world of digital currency, create brilliance together, and Li Hui is willing to embark on this challenging and opportunistic investment journey with you.
免责声明:本文章仅代表作者个人观点,不代表本平台的立场和观点。本文章仅供信息分享,不构成对任何人的任何投资建议。用户与作者之间的任何争议,与本平台无关。如网页中刊载的文章或图片涉及侵权,请提供相关的权利证明和身份证明发送邮件到support@aicoin.com,本平台相关工作人员将会进行核查。


