Click to watch the video: Master Chen's 3.29 Video: Will DOGE Reach a New High Next Month? Is the Market Reversing from the Head and Shoulders Pattern?
Today's video will first discuss whether it's time to close long positions if Dogecoin reaches a new all-time high next month. Currently, there is still about a 200% upside potential for Dogecoin to reach its historical high. We will also analyze the short-term and long-term trend predictions for Bitcoin.
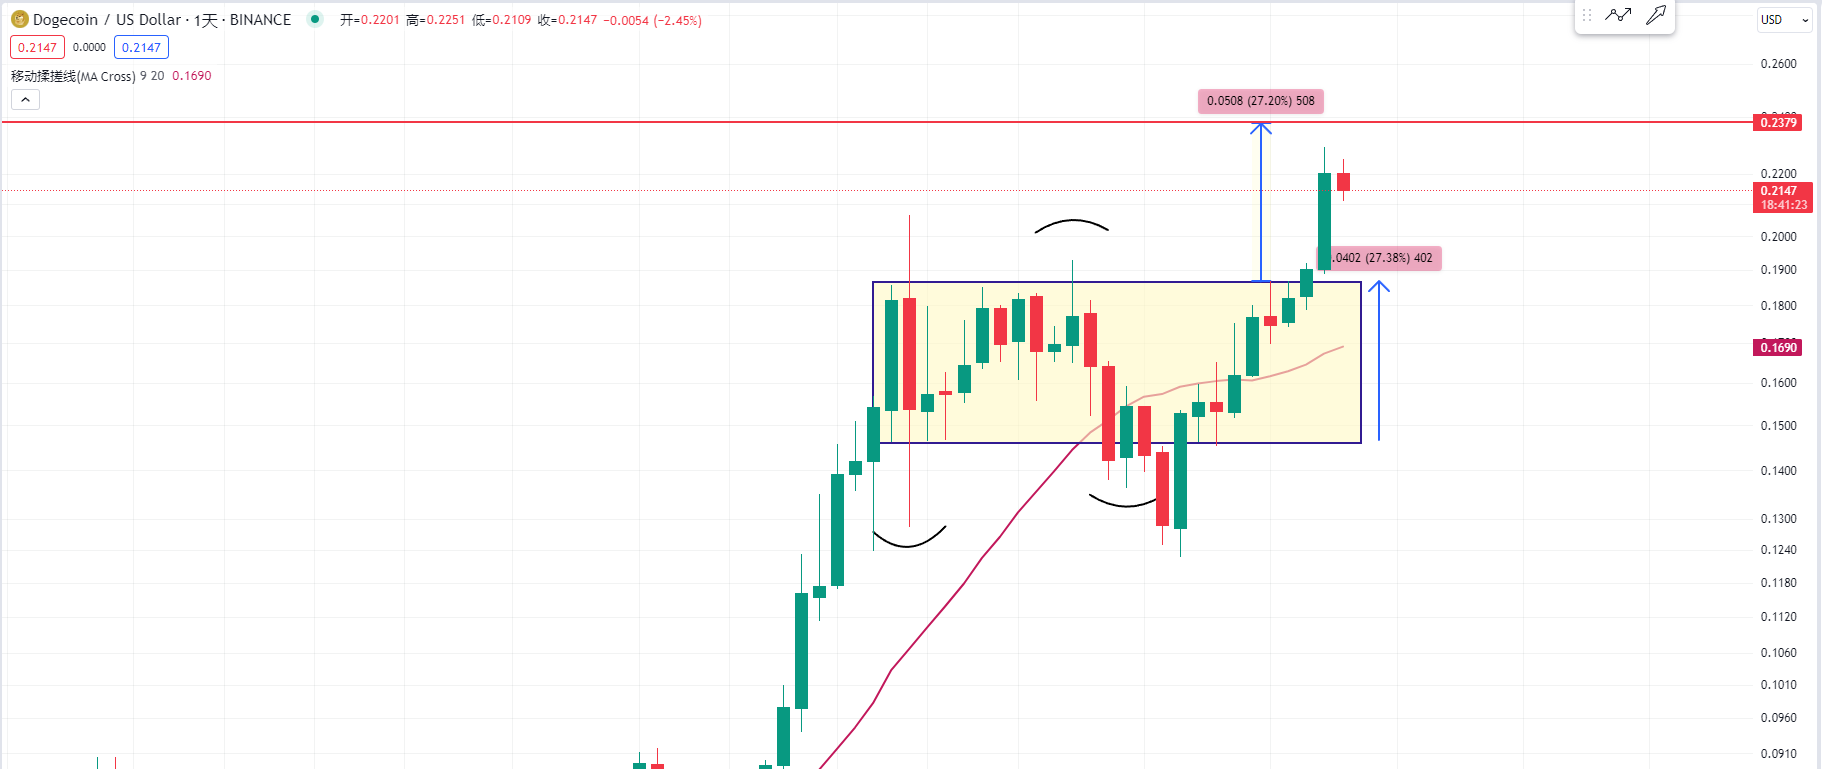
Let's start by looking at the daily chart of Dogecoin. Some fans have asked if it's still a good time to buy Dogecoin. I believe that if you want to invest in altcoins, you should control your position carefully.
As I have mainly been focusing on short-term contract trading for Bitcoin and Ethereum recently, we need to observe the current trading range. Based on previous experience, after a breakout from the trading range, the price tends to replicate the same distance, possibly reaching around 0.22. The price has already broken through this 0.22 level, and now we need to consider if it has effectively stayed above 0.22.
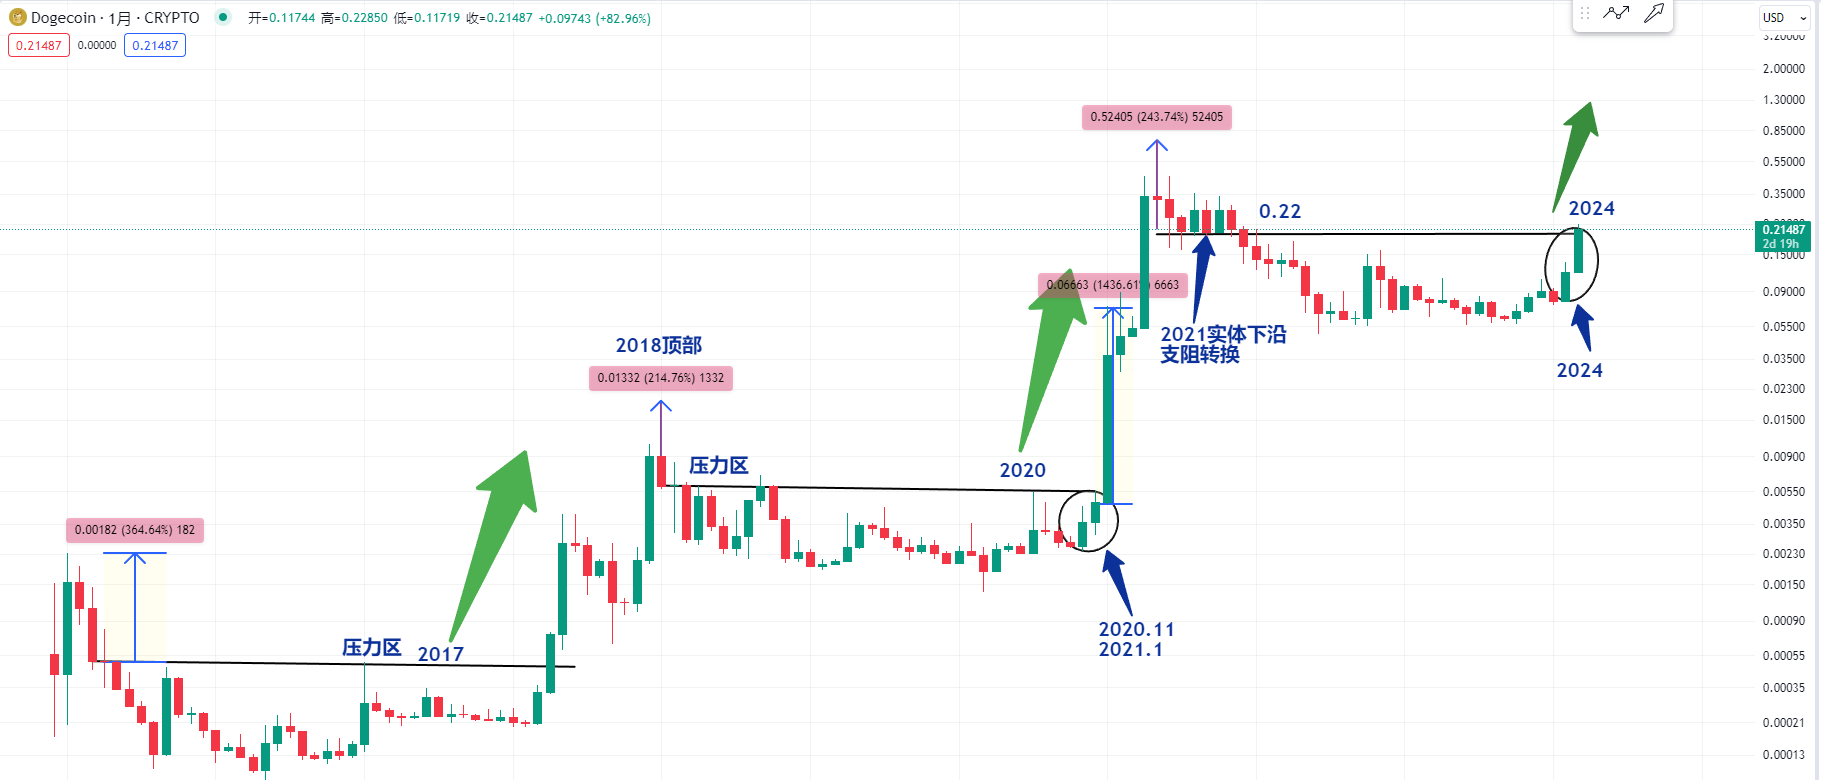
Now let's look at the monthly chart of Dogecoin. The 0.22 level is approximately at the lower end of the candlesticks in 2021. This level is a crucial support and resistance conversion point. The price has currently stayed above this level.
I believe that by the end of this month, we need to pay attention to whether the price can stay above 0.22 or even 0.23. Then we can observe Dogecoin's historical positions, such as the position in 2020.
As I mentioned in yesterday's video, the candlesticks in November 2020 and January 2021 are very similar to the current ones. Now that the price has broken through this resistance area, similar to the situation in 2020 or when Dogecoin's top fell in 2018, we need to pay attention to the crucial resistance area at the lower end of the candlestick. From this position to Dogecoin's historical high, the potential upside is only about twice the current price.
Alternatively, if we observe when it broke through this position in November 2020 and January 2021, a long bullish candlestick appeared, and Dogecoin surged by 6 to 7 times in about a month. Therefore, if Dogecoin can stay and stabilize at this position this month, it may experience a significant surge next month, possibly breaking through the historical high.
We can also observe that in 2017, when Dogecoin was at its bottom, there were two consecutive months of significant upward candlesticks. Similarly, there was a resistance area at that time, including a resistance area at the high point of the candlestick. If it breaks through the bear market's resistance area, there is a potential upside of about 350%. Therefore, from the historical chart of Dogecoin, once the resistance level is broken, there is a 200% upside potential.
Therefore, I believe that Dogecoin has the potential to rise by 200% and break through its historical high next month. If it does break through the historical high next month, should holders of long positions close a portion of their positions? We can look at the position in 2020 when it broke through the historical high and be cautious of a potential pullback, as I mentioned in yesterday's video. Just like in 2017, after breaking through the historical high, the subsequent decline was significant. Therefore, if Dogecoin reaches a new high next, it's advisable to close a portion of the position to prevent a similar pullback.
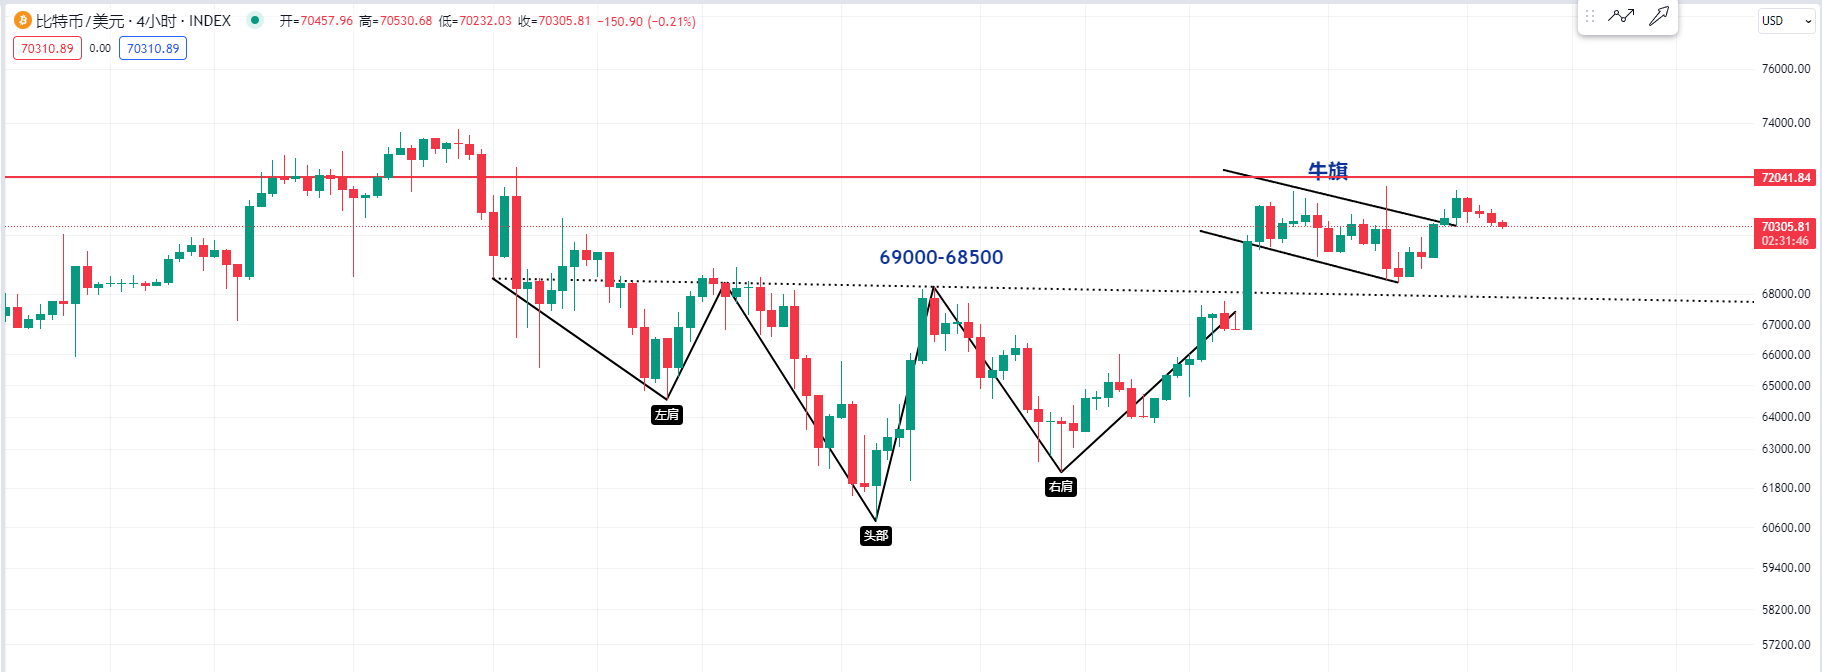
Now let's look at the 4-hour chart of Bitcoin. Some friends have asked if there is a head and shoulders pattern on the 4-hour chart of Bitcoin and whether there is a bull flag. It's important to observe that Bitcoin does not decline from its current position, especially for those who like to trade altcoins.
I believe that if the price continues to rise in the short term, just like when it started from the bottom at 39,000, and then consolidated in a range, the price should not return to the lower end of that range for Bitcoin to continue breaking upwards.
Therefore, it's crucial to observe that the price does not decline from the current position. There seems to be a resistance area around 72,000, and if a head and shoulders pattern forms in the range of 69,000 to 68,500, the price should not drop below this range. If it does, the price may further decline.
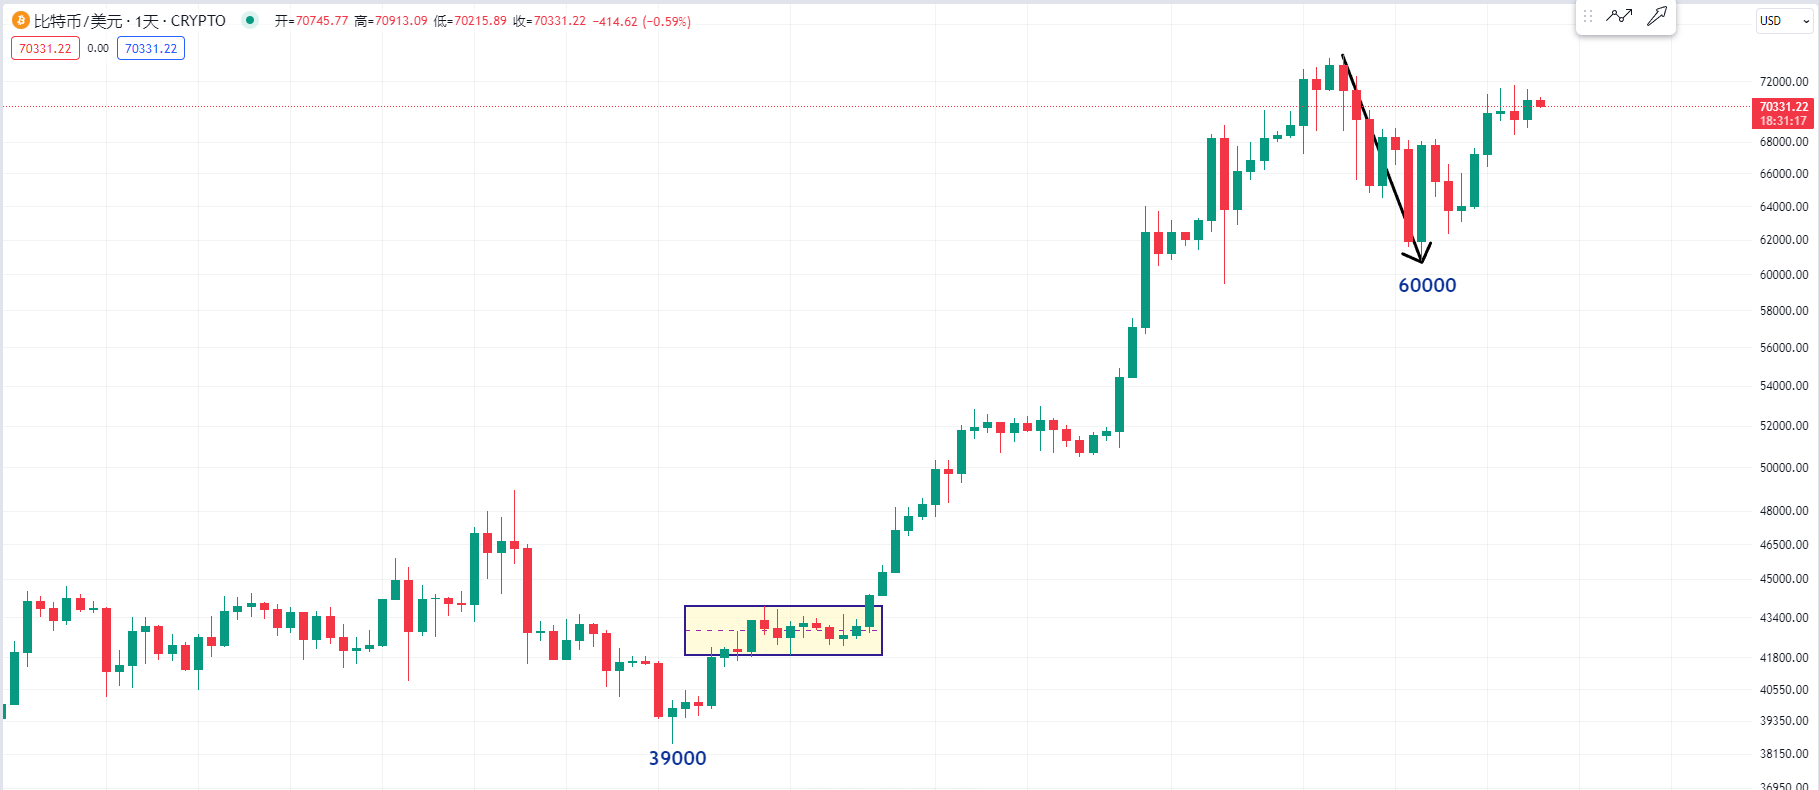
If the price continues to rise in the short term, just like when it started from the bottom at 39,000, and then consolidated in a range, the price should not return to the lower end of that range for Bitcoin to continue breaking upwards.
The content of this article is exclusively planned and published by Master Chen (WeChat public account: 币神师爷陈). For more real-time investment strategies, solutions to investment dilemmas, spot contract trading techniques, operational skills, and knowledge of candlesticks, you can add Master Chen for learning and communication. I hope it can help you find what you want in the cryptocurrency circle. Focusing on BTC, ETH, and altcoin spot contracts for many years, there is no 100% method, only 100% following the trend. Daily updates on macro analysis articles across the web, technical indicator analysis of mainstream coins and altcoins, and spot mid- to long-term replay price predictions in videos.

Friendly reminder: Only the official WeChat public account (shown in the image above) is written by Master Chen. The end of the article and other advertisements in the comments section are not related to the author. Please carefully distinguish between true and false. Thank you for reading.
免责声明:本文章仅代表作者个人观点,不代表本平台的立场和观点。本文章仅供信息分享,不构成对任何人的任何投资建议。用户与作者之间的任何争议,与本平台无关。如网页中刊载的文章或图片涉及侵权,请提供相关的权利证明和身份证明发送邮件到support@aicoin.com,本平台相关工作人员将会进行核查。


