On the afternoon of March 28th, AICoin researchers conducted a live graphic and text sharing session titled "From Novice to Winner (with Membership)" in the AICoin PC-end Group Chat-Live. Here is a summary of the live content.
I. High-quality Tool - Indicator Win Rate
- Meaning of Indicator Win Rate
The indicator win rate combines real-time market analysis and high-winning trading signals, providing precise decision support. Indicators with a certain win rate provide a way to predict future trends through historical data analysis, helping us make wiser trading decisions. We should rely on strategy indicators supported by historical win rates.
- Usage of Indicator Win Rate
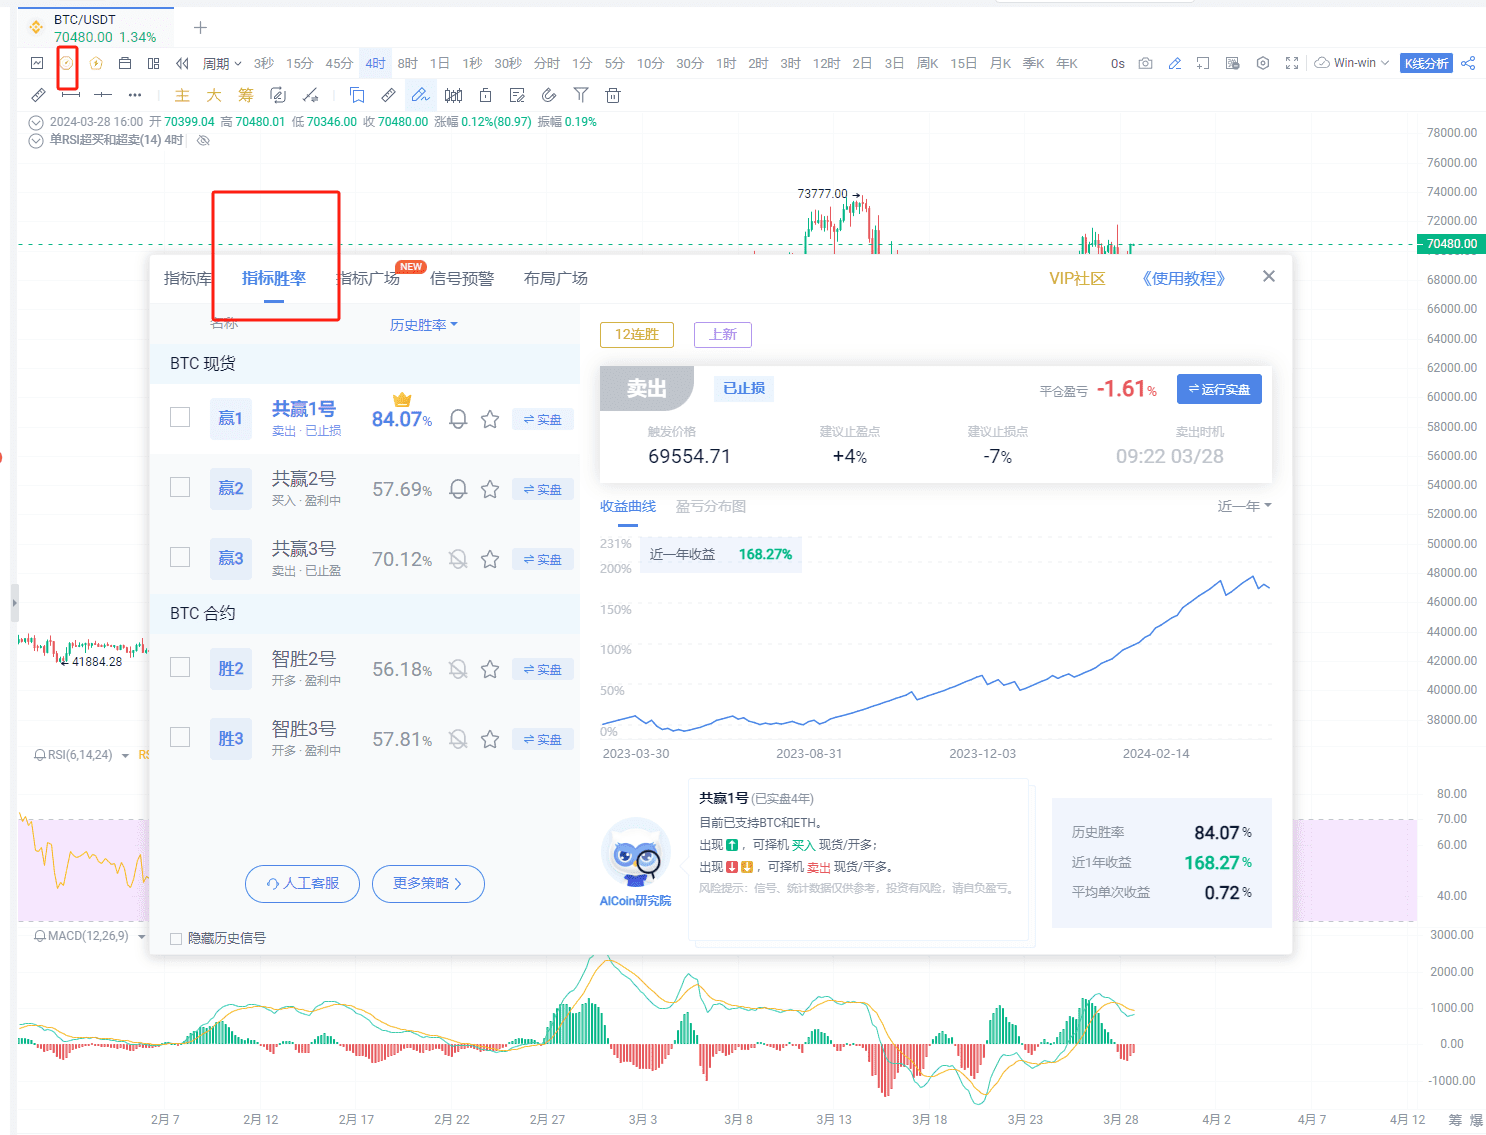
Introduction to Indicator Win Rate Usage
(1) Effectiveness of Indicator Win Rate Strategy
In recent market fluctuations, AICoin's self-developed strategy, SmartWin 3, has issued multiple long/short signals, achieving a good record of 6 wins and 1 loss with a total profit of 22%. Specific signals are shown in the following image.
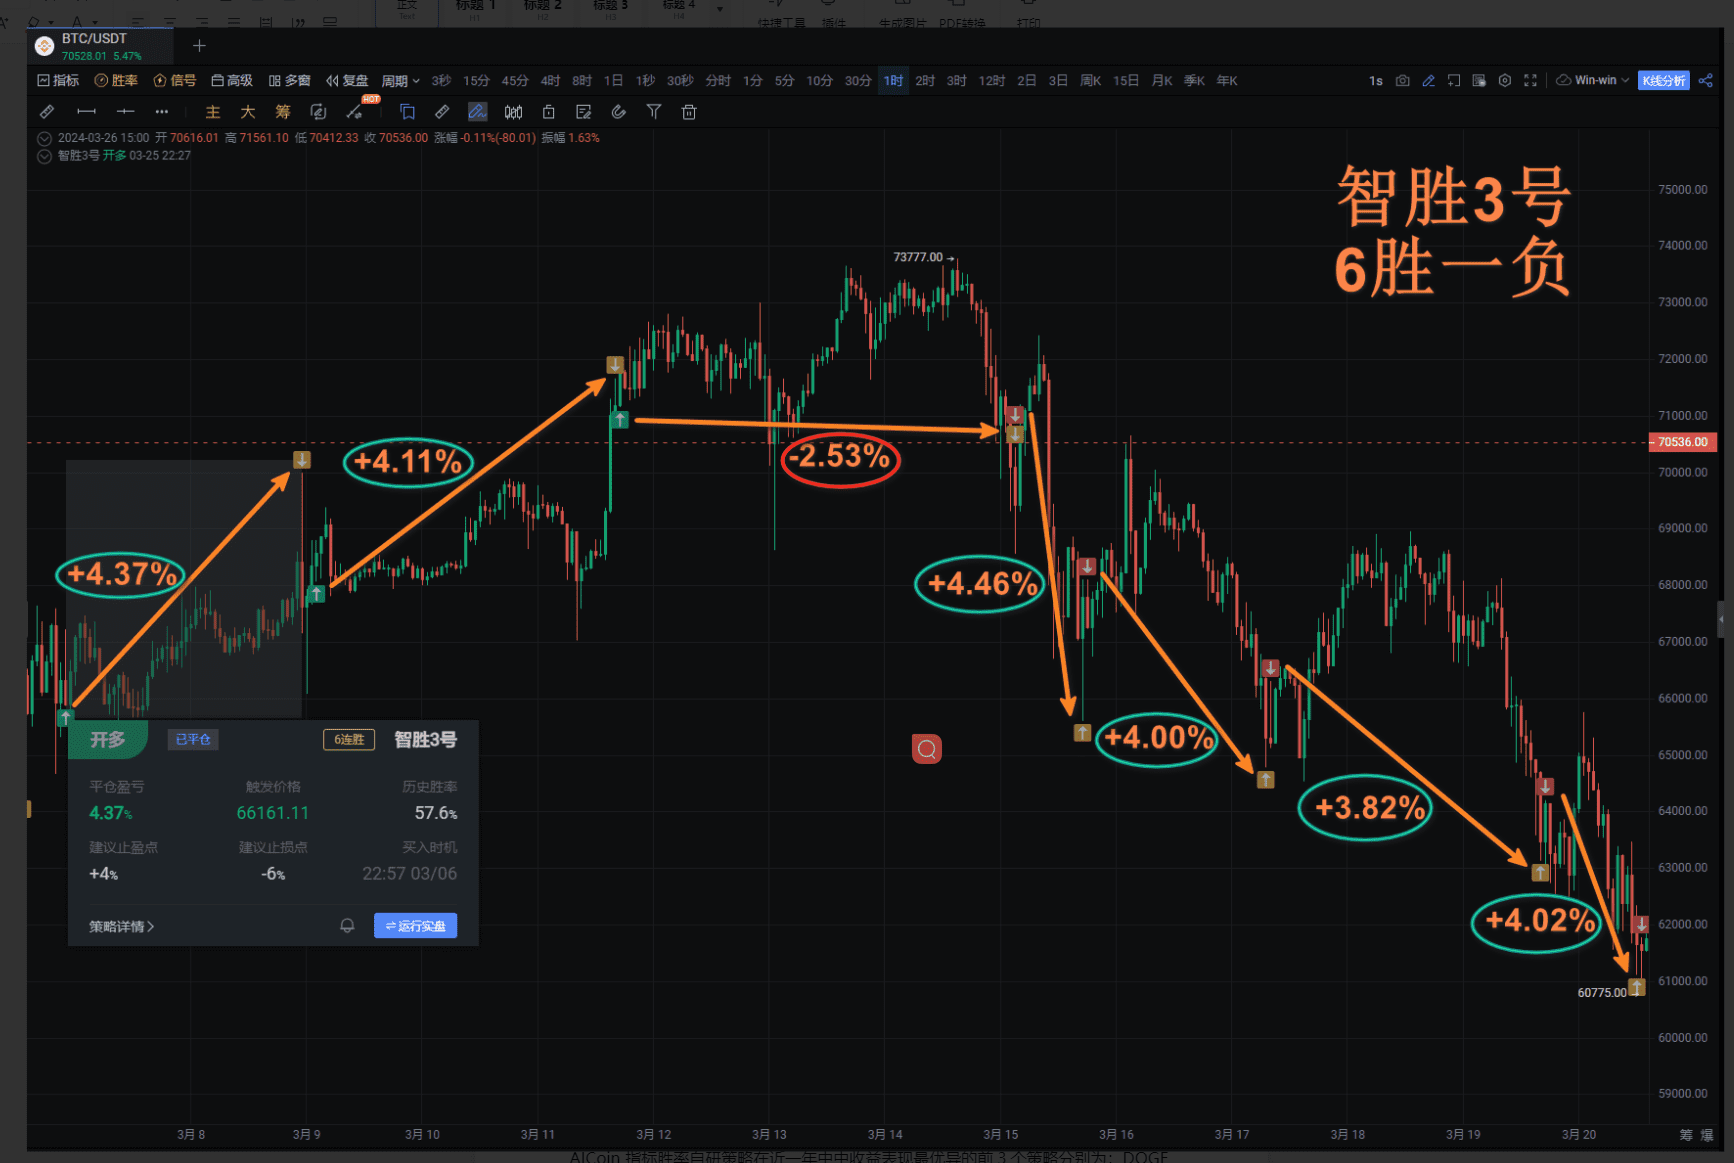
(2) Meaning of Strategy Arrow Signals
Green: Short position; Red: Long position; Yellow: Close position
Several Characteristics of Indicator Win Rate:
(1) Supported by repeatedly demonstrated win rate performance, AICoin's indicator win rate is the result of multiple experiments. The six major strategies are selected from hundreds of long and short-term strategies through rigorous logical reasoning and numerous live tests.
(2) Strategy Diversity - covering contract and spot strategies, allowing selection of the most suitable strategy based on trading preferences and risk tolerance.
(3) Real-time buy/sell point reminders presented on the candlestick chart, and can also be executed in live trading - enhancing the intuitiveness of our trading decisions. (Sometimes you can make money even when you accidentally fall asleep)
Specific Win Rate Situations:
AICoin's self-developed indicator win rate strategies have shown the best performance in the past year, with the top 3 strategies being: DOGE SmartWin 3; BTC SmartWin 1; BTC SmartWin 2.
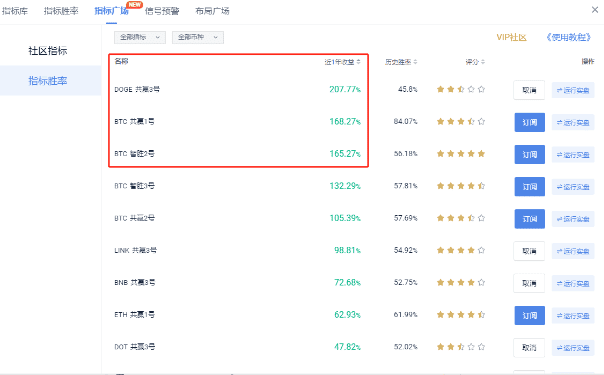
Operational suggestion: You can try several strategies to see which one aligns with your investment habits and can achieve more stable and objective returns.
Others
The latest version of the indicator win rate interface and interaction has been completely upgraded, making it more convenient for novices to operate and providing more comprehensive strategy information.
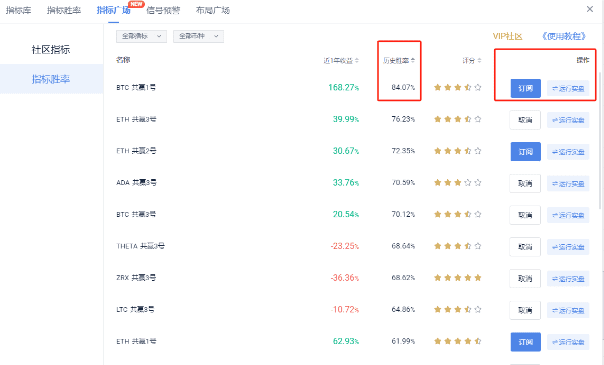
Operational suggestion: For those with a long-term vision, you can also select some high win rate indicators for subscription; if you have investment intentions but no time to watch the market, you can use the live trading feature.
The indicator win rate provides reference buy/sell points on the candlestick chart, and relevant spot contract strategies. Click the link below to experience: https://aicoin.app/zh-CN/vip/indicator
II. High-quality Tool - Signal Alert System
- Concept of Signal Alert
It allows us to respond to market changes at all times. In the event of a sudden market shift, a reliable signal alert system can help us adjust our strategies in a timely manner and avoid unnecessary losses.
Detailed introduction to signal alert: "Signal Alert" Launched!
- Easy and Effective Signal Indicator - RSI
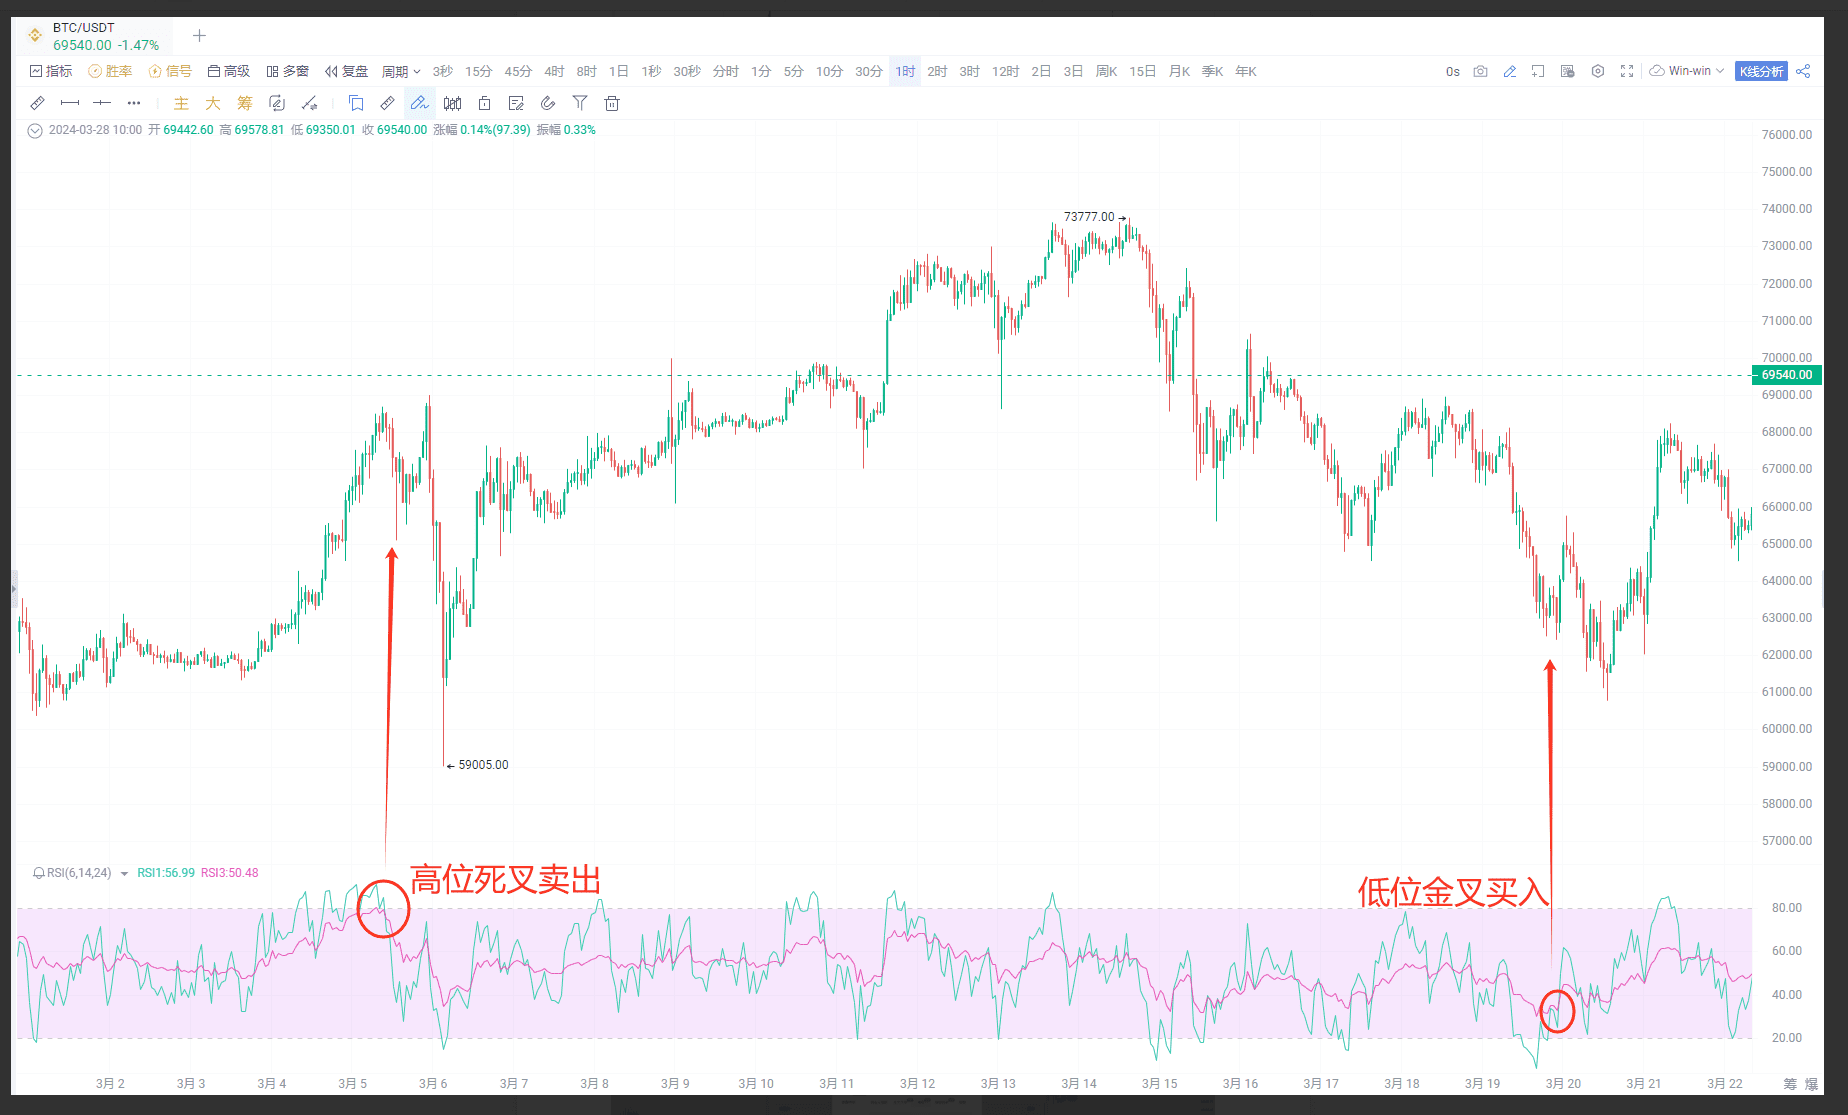
Taking RSI as an example, which stands for Relative Strength Index.
(1) Concept: In general, RSI reflects the market's strength and weakness by comparing the ups and downs within a certain period.
From the formula, RSI mainly reflects the market's strength and weakness, observing the short-term market's overbought or oversold conditions.
(2) Recommended Parameters:
The recommended parameter settings are 6, 12, 24, corresponding to short-term, medium-term, and long-term RSI, respectively.
(3) Evaluation of Period Usage:
The shorter the period of RSI, the higher the sensitivity; the longer the period, the more stable the trend but with reduced sensitivity. When the period is shorter and the sensitivity is higher, using a shorter time period to calculate RSI (e.g., using 5 days instead of 14 days) will make the RSI indicator more responsive to price changes. This feature allows RSI to more accurately indicate overbought or oversold conditions in the short term, but it may also generate false signals due to its high sensitivity to price changes.
(4) Summary:
Choosing the period for RSI is a balancing process, involving the desire for a more sensitive indicator and how to use the indicator - whether as a tool to find short-term trading opportunities or to confirm long-term trends.
Reference reading: RSI Artifact: Creating a Stable and Profitable Trading Strategy
III. 3 Classic Uses of RSI Signal Indicator
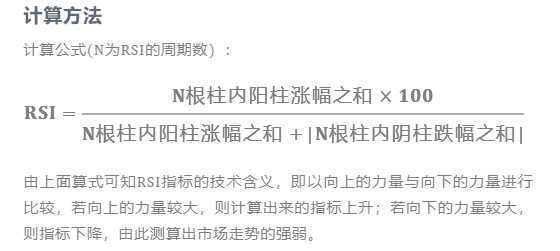
(1) Classic Use 1 - Overbought/Oversold Trading Method
Oversold: RSI below 20, suitable for buying;
Overbought: RSI above 80, suitable for selling;
Analysis of the above chart: Crossing below 20 and above 20 is the best buying opportunity, crossing above 80 and below 80 is the best selling opportunity.
It is important to note that overbought/oversold as a judgment of short-term trends has significant reference significance. Just breaking through the overbought/sold area indicates a strong trend. If it falls back from the overbought/sold area, it indicates that the original trend is slowly weakening.
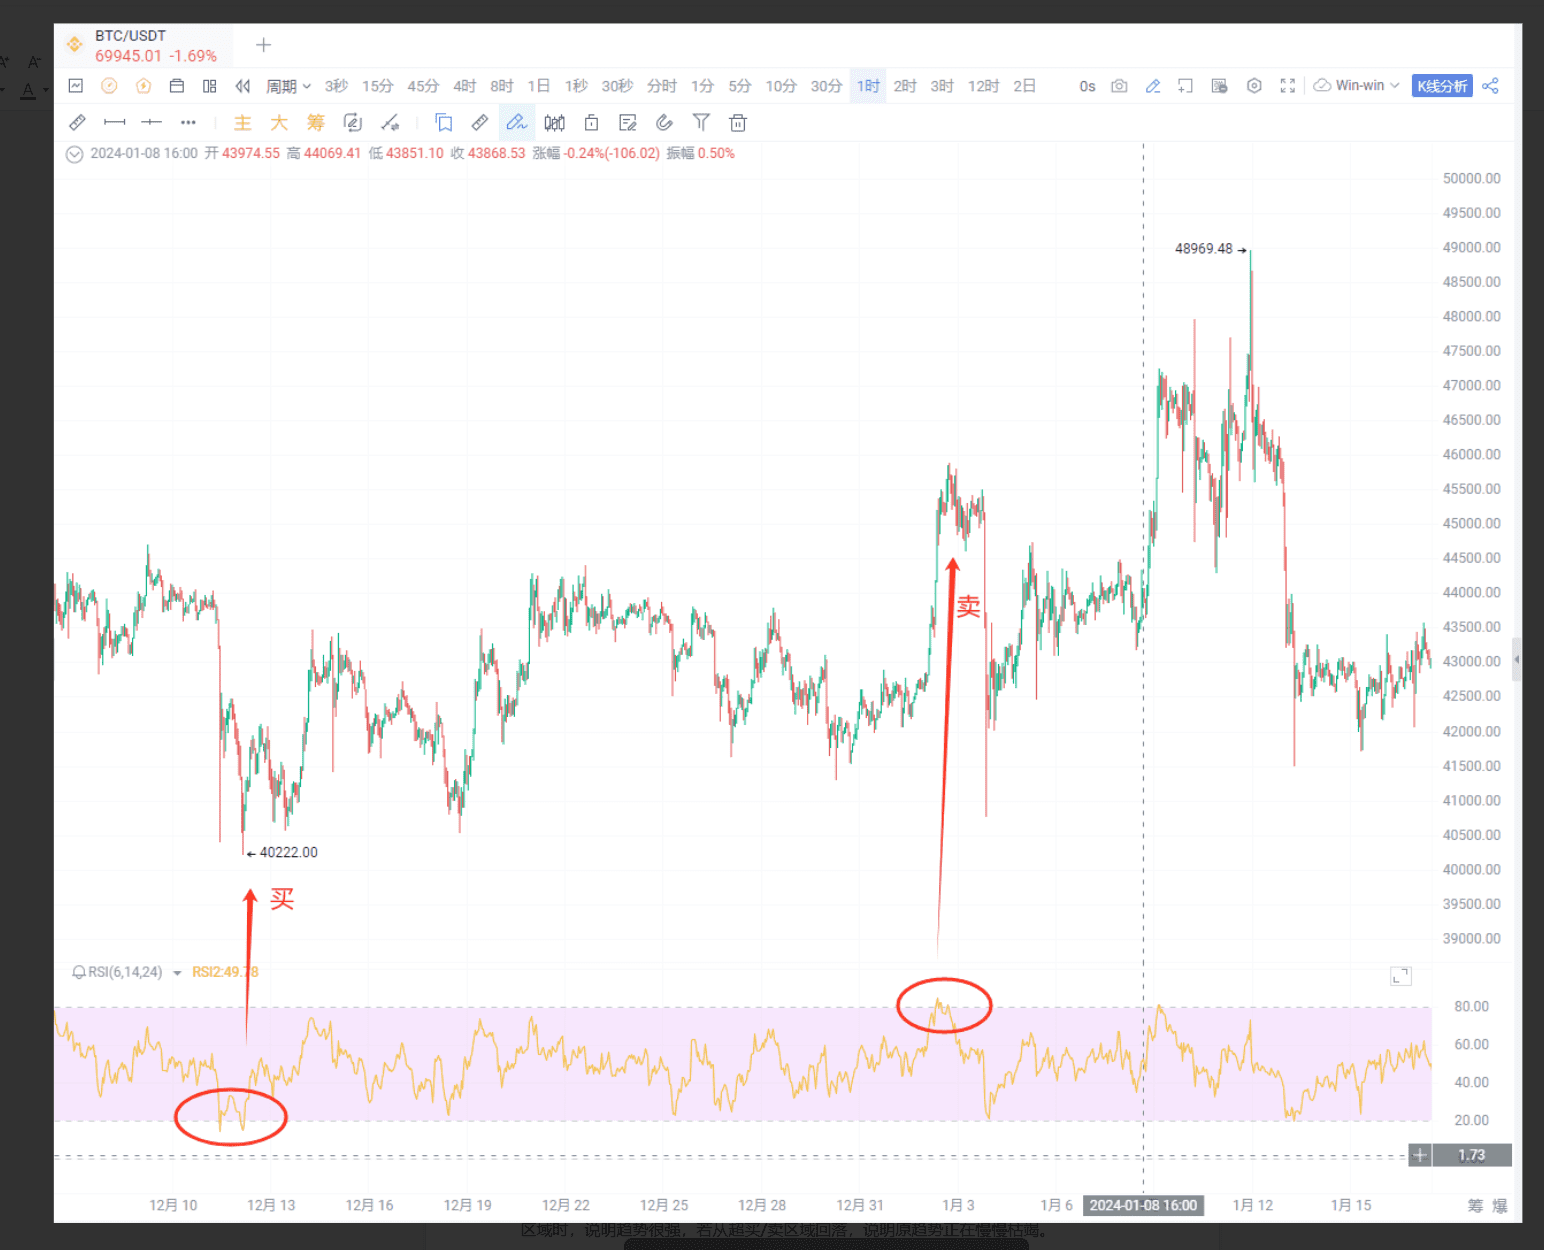
(2) 🔥 Classic Use 2 - Divergence Trading Method
Recommended parameters: 12 or 14
Using a mnemonic:
When the candlestick trend peaks higher and higher, while the corresponding RSI peaks lower and lower, it is a bearish divergence;
When the candlestick trend peaks lower and lower, while the corresponding RSI peaks higher and higher, it is a bullish divergence.
When the candlestick trend and RSI indicator show a divergence, a bearish divergence indicates a bearish view, while a bullish divergence indicates a bullish view.
As shown in the following image:
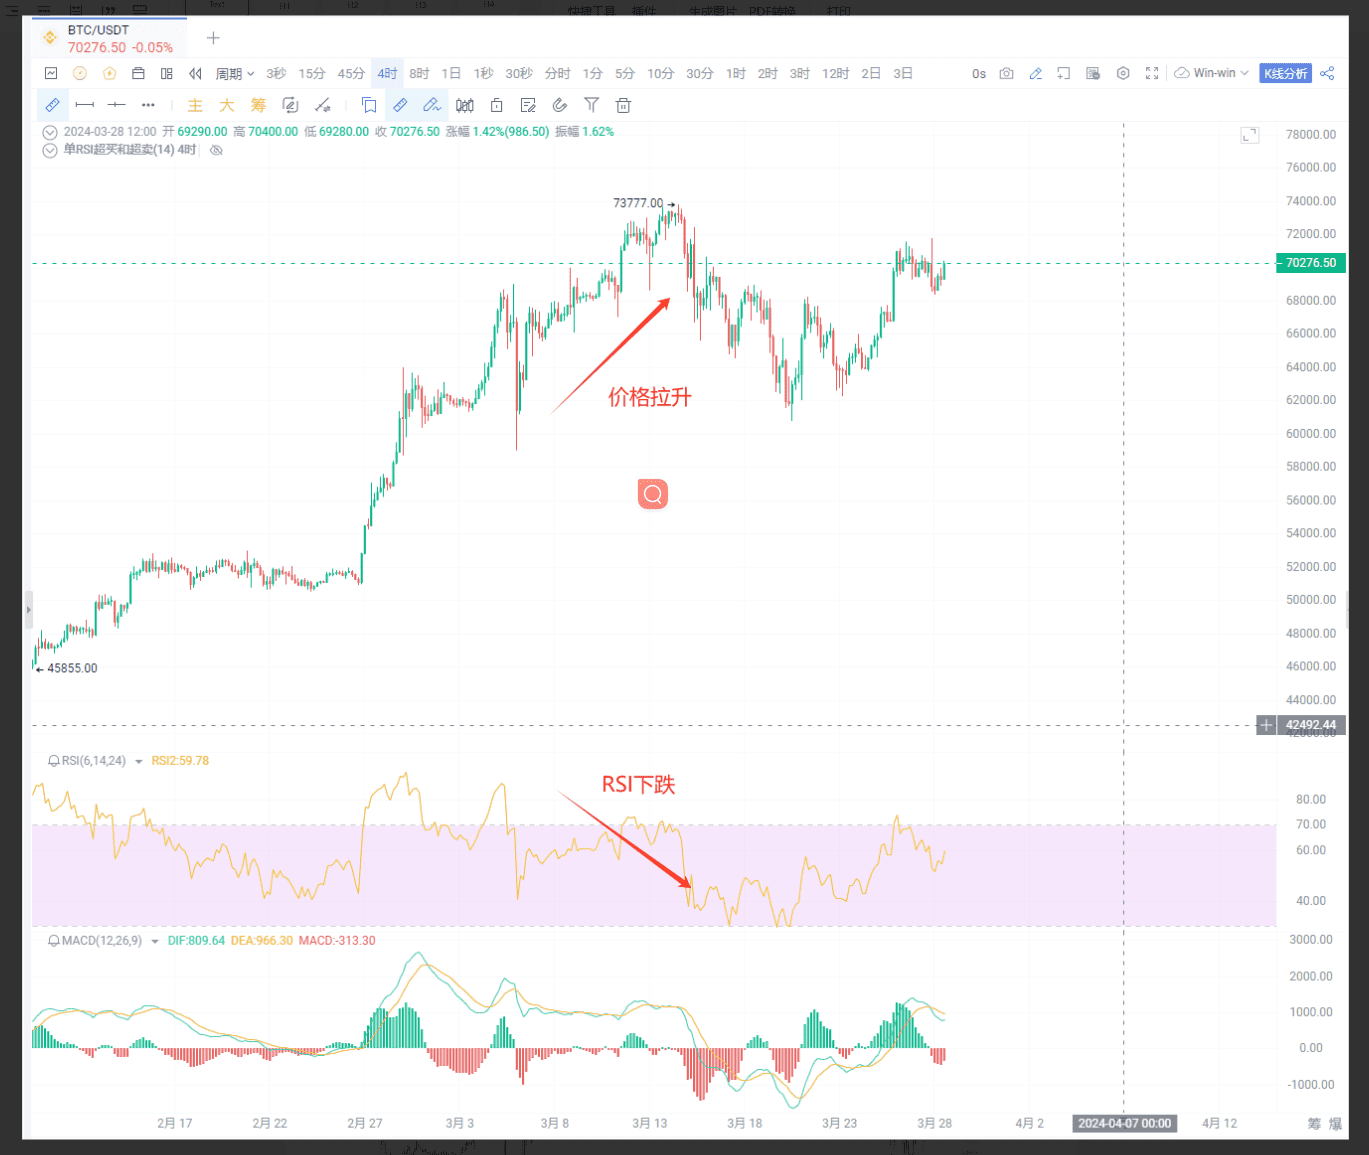
(3) 🔥 Classic Use 3 - Golden Cross/Death Cross Trading Method
Parameters set as: 6-14-24
Usage:
Buy signal: Short-term RSI crosses above long-term RSI, indicating a golden cross signal;
Sell signal: Short-term RSI crosses below long-term RSI, indicating a death cross signal.
The usage effect is shown in the following image:
RSI is set in the range of 20-80, which can be used as a reference.
🚫 Precautions for Using RSI
RSI indicator may become dull: Above 90 or below 10, the RSI indicator is prone to dullness, affecting the trader's judgment.
Ineffectiveness of RSI indicator: In the 40-60 range, the RSI indicator's judgment of the market's significance is not substantial.
RSI's overbought and oversold zone standards can be adjusted appropriately for different currency pairs.
Signal alerts support 11 major indicators, six major patterns, all currency pairs, customizable parameter alerts, support for indicator customization, and AI-written indicators. You can click the link below to learn more and experience it: https://aicoin.app/zh-CN/vip/signal
III. Little A Analysis - A Revolutionary Artificial Intelligence Tool
- Role of Little A Analysis
It can help us interpret candlestick charts. Little A Analysis uses machine learning algorithms to identify chart patterns and predict market trends, providing support for our trading decisions.
Based on AI analysis, Little A has outstanding advantages: compared to traditional analysis tools, Little A Analysis can process a large amount of data faster and more accurately, discovering patterns that human analysts may overlook.
Practical Application of Little A - How Little A Analysis Helps Traders Achieve Profit
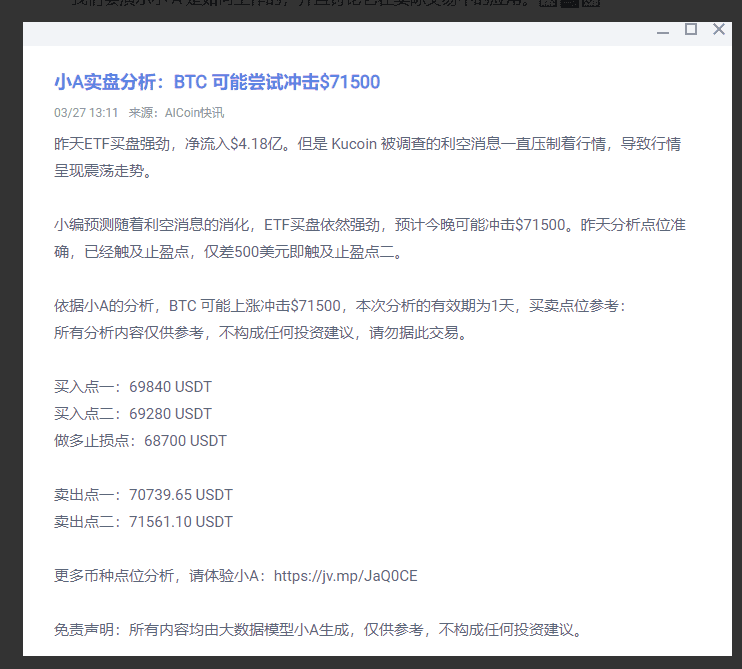
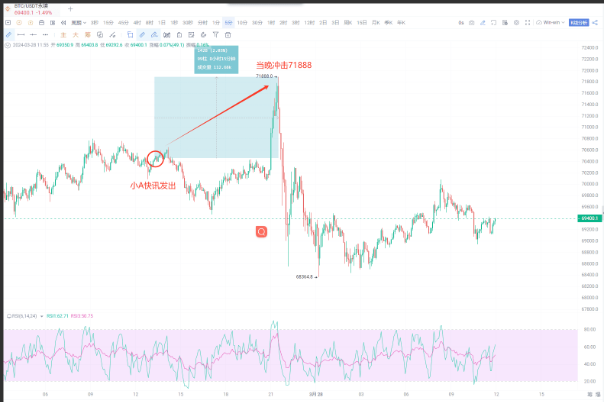
(1) Application 1 - Little A timely alerts on market trends: Yesterday, BTC surged to 71500
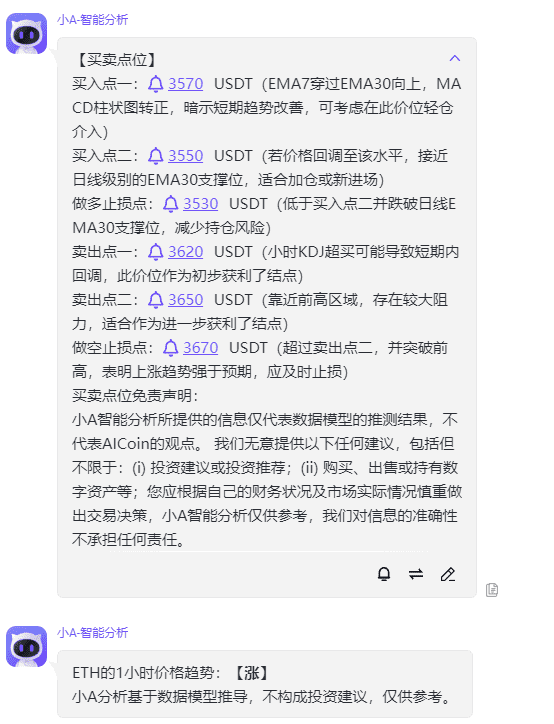
Little A Analysis for ETH
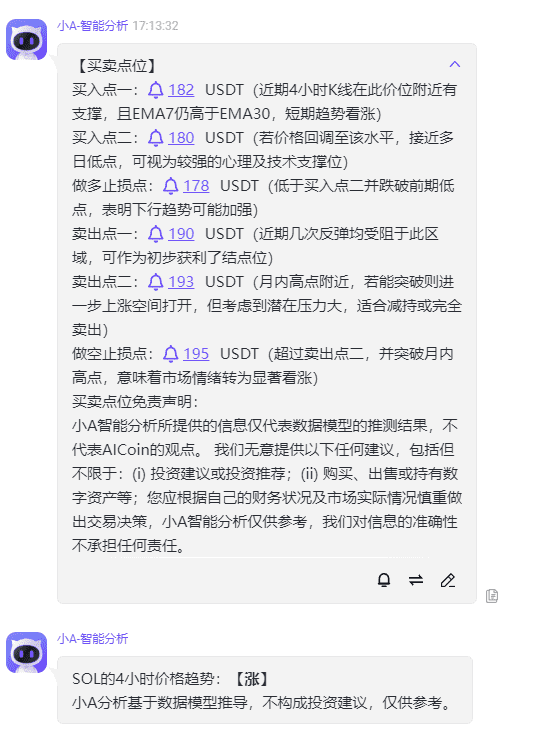
Little A Analysis for SOL
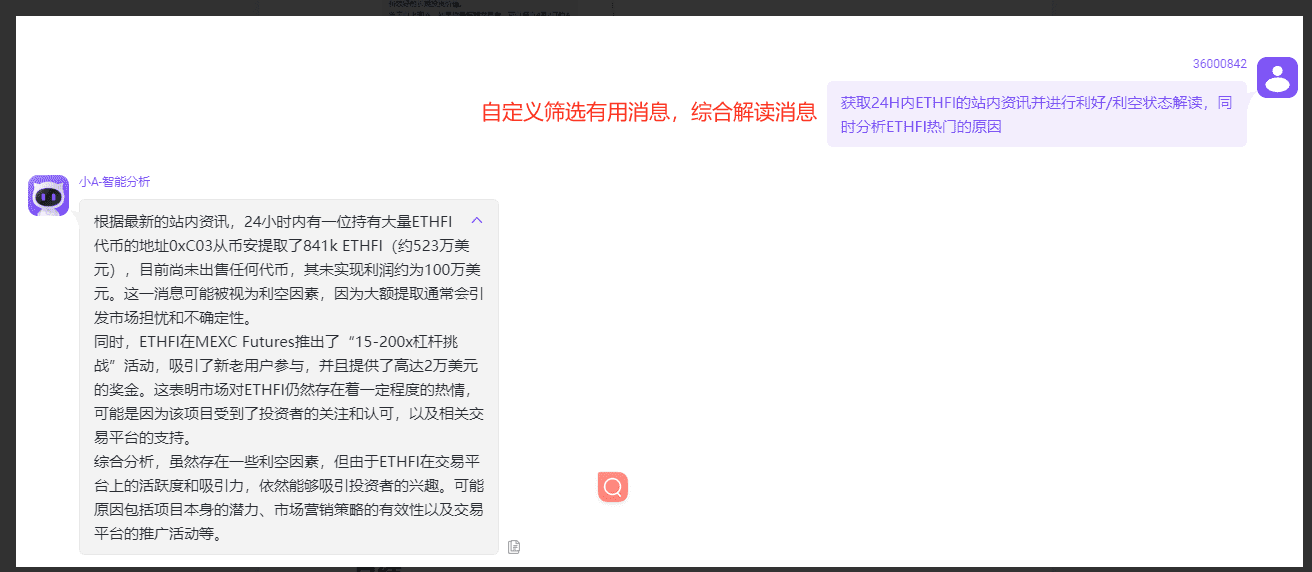
(2) Application 2 - Detailed explanation of trading opportunities, capturing all-in-one, quickly capturing trading data and the latest news for coins that meet trading strategies and favored coins.
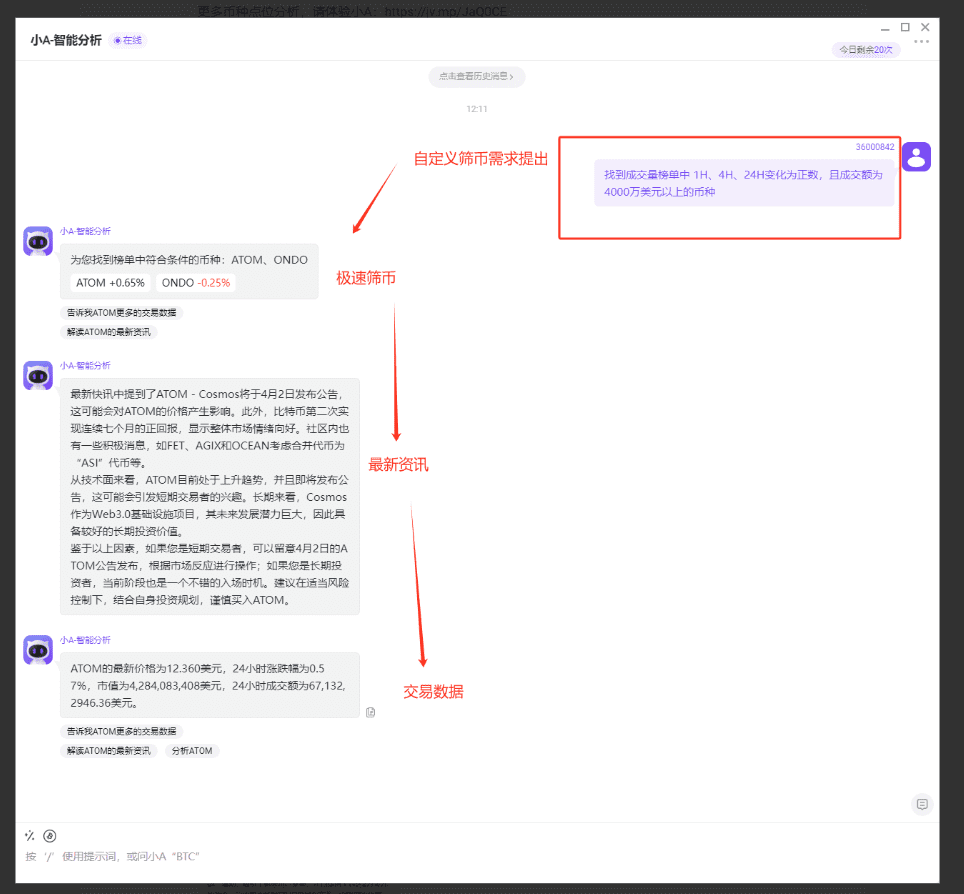
Little A's information interpretation is fast and provides objective evaluation and analysis of timely news for reference, supplementing information that is usually overlooked, for users to consider from multiple perspectives.
By subscribing to the PRO version of the candlestick chart, you can enjoy more analyses of coins by Little A, analyze positions at any time, and receive at least 8 position analyses per day. Novice users can easily grasp market trends, while experienced traders with their own trading systems can have custom indicators tailored by the editor to place orders automatically. Click the link below to experience: https://aicoin.app/zh-CN/vip/chartpro
IV. Q&A
What is RSI?
It is a relative strength index suitable for medium-term traders to observe market trends.
Which period is useful for RSI divergence?
You can refer to the 4-hour period.
What is Little A Analysis?
Little A Analysis uses machine learning algorithms to identify chart patterns, predict market trends, and provide support for our trading decisions. It is important to remember that no tool is 100% accurate. Therefore, the best practice is to use a combination of multiple indicators and always maintain risk management measures.
Recommended reading: Intelligent AI Helps You Analyze the Market, Excellent Intelligent Investment Butler
For more live content, please follow AICoin's "News/Information - Live Review" section, and feel free to download AICoin PC-end.
免责声明:本文章仅代表作者个人观点,不代表本平台的立场和观点。本文章仅供信息分享,不构成对任何人的任何投资建议。用户与作者之间的任何争议,与本平台无关。如网页中刊载的文章或图片涉及侵权,请提供相关的权利证明和身份证明发送邮件到support@aicoin.com,本平台相关工作人员将会进行核查。


