Original Author: 21Shares
Original Compilation: Peng SUN, Foresight News
TL;DR
The net inflow of the US Bitcoin spot ETF exceeds 10 billion US dollars, with a holding volume of over 400,000 units, surpassing the annual supply after the April halving (about 164,000 units). The US has a 7 trillion US dollar ETF market, four times that of Europe. As long as 1% of the funds flow in, the market value of Bitcoin will double. The supply of Bitcoin is decreasing, with exchange balances now at 2.3 million units, hitting a five-year low. The BTC holdings of long-term investors holding Bitcoin for over 155 days decreased from 14.9 million units to 14.29 million units, accounting for nearly 70% of the total supply; the BTC holdings of short-term holders increased from nearly 2.3 million units to 3.07 million units, a growth of over 33%. Bitcoin has reached a historical high, but whales holding over 1,000 BTC have not sold, as they believe that BTC still has significant growth potential. Compared to March and October 2021, whales sold Bitcoin at $60,000, after which BTC reached a historical high. From the MVRV Z value, in the past month, Bitcoin investors have been chasing the rise, but it still indicates that we may be in the early stages of a bull market. Currently, the average value of Unrealized Profit/Loss (NUPL) is 0.6, indicating that the market has not entered an extremely greedy stage, as the inflow of ETFs has preempted the expected market activity after the halving. If we act cautiously, then Bitcoin is likely to consolidate in the coming weeks. Bitcoin is no longer just a store of value; Ordinals, BRC-20 tokens, BTC L2, etc., will drive more demand for Bitcoin and expand its use cases.
In April 2024, Bitcoin will undergo its fourth halving. Acting cautiously, the price performance of Bitcoin has been excellent in the 12 months following each halving. However, this halving seems to be different from the past. At this moment, Foresight News will compile the essence of 21Shares' Bitcoin halving report, delving into the impact of the 2024 Bitcoin halving on the Bitcoin market, mining, and the entire ecosystem.
What is the impact of Bitcoin's four-year halving cycle?
Why halve every four years?
Although we do not know why Satoshi Nakamoto set a four-year halving cycle, this cycle coincides with major events such as the US presidential election, bringing uncertainty to the market. As the US fiscal policy has a significant impact on the global economy, Bitcoin halving can be seen as intentionally providing stability to the traditional financial system during political transitions.
Of course, although these four years do not completely align, it may be a psychological benchmark, such as traditional economic cycles, elections, or major sports events.
How does halving affect Bitcoin's price?
The impact of Bitcoin halving is diminishing, with each halving bringing less growth. Bitcoin surged by about 5,500% in the period following the first halving, about 1,250% in the period following the second halving, and about 700% in the current period.
In other words, Bitcoin's stable growth over the years indicates that the market is becoming more mature. Explosive growth often accompanies speculation and gambling, while a more sustained growth rate indicates enhanced stability and broader applications, similar to traditional assets like gold.
However, this cycle has a significant difference, which is the external demand brought by ETF inflows, leading Bitcoin to break through its historical high before the halving, which is likely to bring a new round of growth different from the past. Of course, this may also be due to supply shocks, which we will further explain in the following text.
How does halving affect miners?
The impact of Bitcoin halving on miners includes several aspects, such as a reduction in block rewards, changes in profitability, and operating costs, all of which depend on the Bitcoin price at the time.
For example, although block rewards may decrease, the corresponding Bitcoin price will rise. For instance, mining companies like Marathon and Core Scientific may choose to refinance to avoid shutting down mining machines.
Of course, miners are not in dire straits. If miners exit the network, the mining difficulty will decrease, reducing electricity expenses, making Bitcoin mining more cost-effective. At this time, miners will rejoin the network, increasing the hash rate. Conversely, some miners may sell Bitcoin, and we will further explore this issue by combining other alternative indicators that help estimate their selling pressure.
What will miners do before halving?
The deposit of miners to exchanges is an important indicator. Typically, miners sell BTC to cover operating costs such as electricity and hardware expenses. However, in this halving cycle, the amount of BTC sold by miners has decreased compared to the previous cycle.
Throughout February 2024, miners deposited an average of 127 BTC to exchanges, nearly 70% less than the 417.4 BTC deposited from February to March 2020. However, it is important to note that miners must pay their operating costs in US dollars, and the rise in Bitcoin price after the approval of ETFs is also a reason for the decrease in BTC selling.
Halving effect: Bitcoin's four-year cycle compass
Historically, Bitcoin has performed very well in the 12 months following halving. On average, it takes 172 days for Bitcoin to surpass the previous ATH value after halving, and 308 days to reach a new cycle peak after surpassing it.
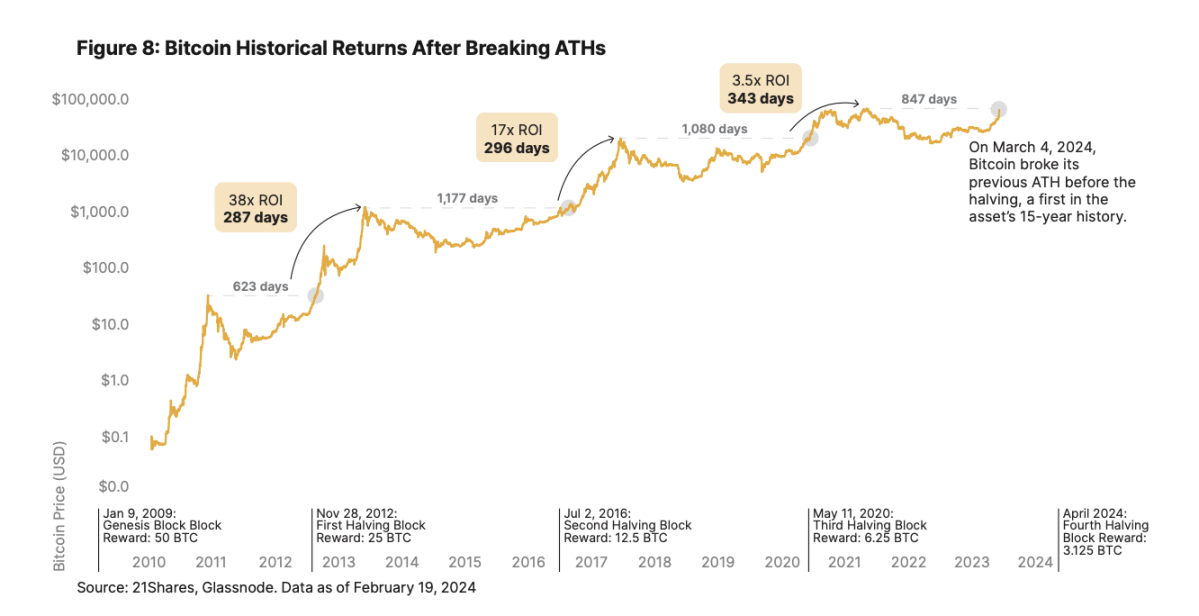
However, as Bitcoin's current trading price is near its ATH, it seems that this cycle may have a different performance, as in the past, Bitcoin's average trading price in the weeks before halving was 40%-50% higher than the previous high. In addition, Bitcoin also saw the strongest monthly bullish candle in February.
What's different about this halving cycle?
This time, Bitcoin's halving seems to be different from the past, with more and more institutions adopting Bitcoin and its use cases expanding. Let's explore the current supply and demand situation of Bitcoin, which can help us better analyze the differences.
Demand side: ETF buying pressure
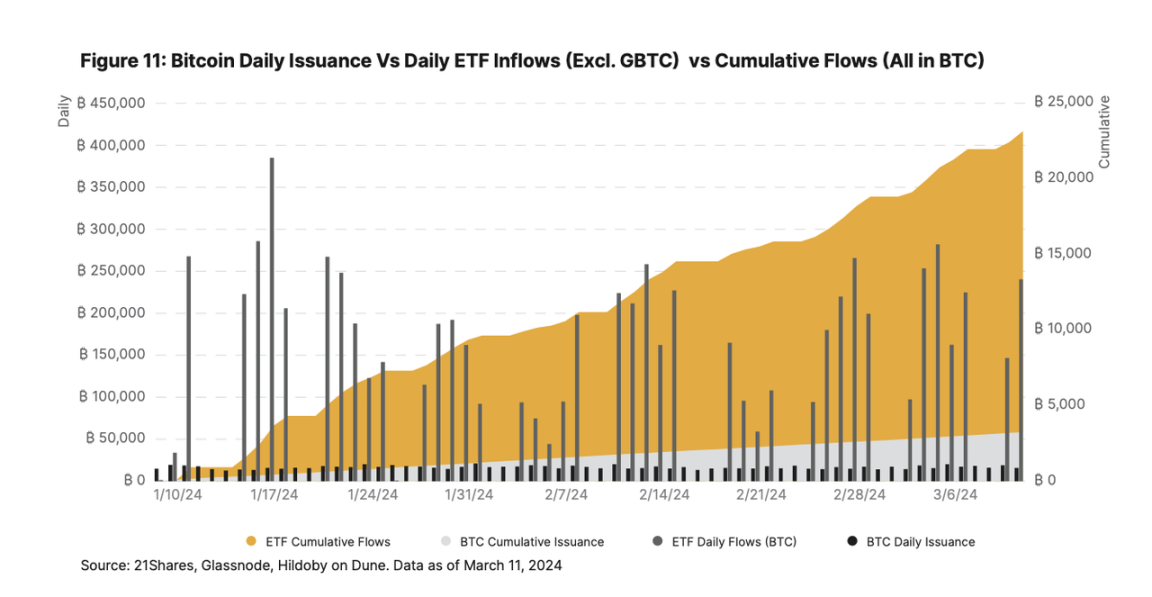
With Bitcoin's continuous growth in recent weeks, the interest of the US spot Bitcoin ETF has been increasing day by day, attracting over 10 billion US dollars in net inflows to date. In other words, the average inflow over 14 days is about 2,500 BTC (about 1.5 billion US dollars), which is three times the daily new BTC production (900 units), and will be close to 5.5 times (450 units) after halving.
As shown in the figure below, ETF holdings exceed 400,000 BTC, already surpassing the annual supply of Bitcoin after the April halving (about 164,000 units). In addition, according to the average value of high liquidity and liquid assets from Glassnode, plus the supply of short-term holders and exchange balances, the current demand covers about 4.5% of the available Bitcoin supply, totaling about 4.7 million BTC.
Furthermore, the US has a 7 trillion US dollar ETF market, four times that of Europe. Before the approval of ETFs, 77% of asset managers were unwilling to invest in Bitcoin. In the US, registered investment advisors manage about 114 trillion US dollars in assets and are required to wait 90 days after the launch of new products before investing. Therefore, as long as 1% of the funds are allocated to Bitcoin, it will trigger a large influx of funds, doubling the market value of Bitcoin and tightening the supply.
Currently, banks such as Wells Fargo and Merrill Lynch have provided spot Bitcoin ETFs to some wealth management clients, and Morgan Stanley is reportedly evaluating Bitcoin funds for its brokerage platform. Cetera is also one of the first wealth management institutions to formally launch Bitcoin ETF policies, marking the emergence of a new round of demand.
Investors holding Bitcoin for over 155 days are very committed to their belief in Bitcoin. The holdings of long-term Bitcoin holders soared to a historical high in December (14.9 million units), then fell to the current level of around 14.29 million units (nearly 70% of the total supply).
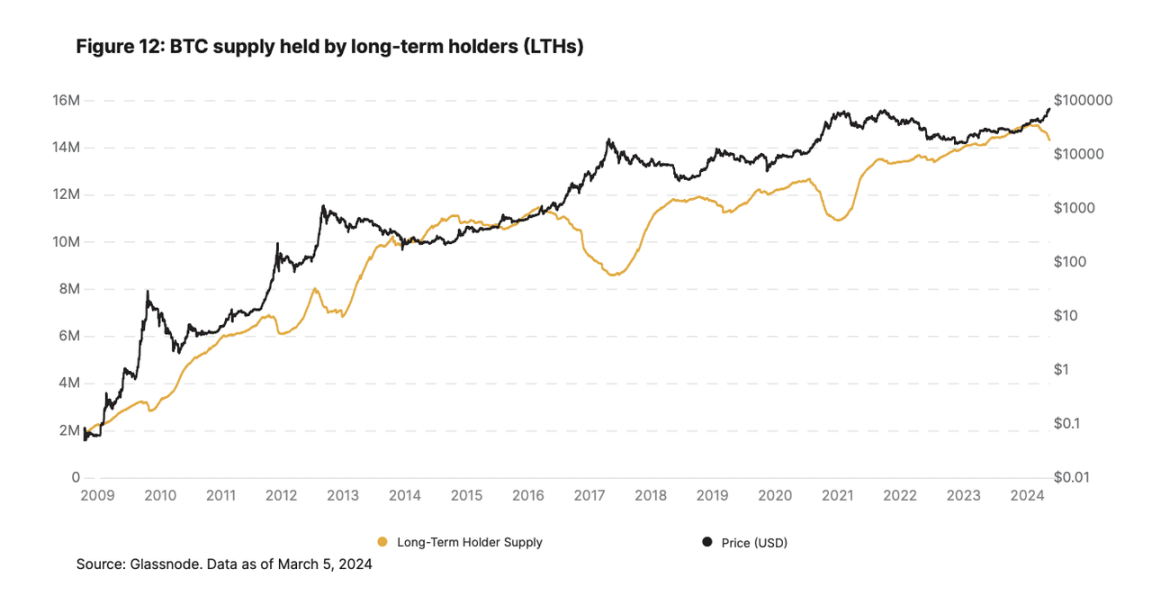
Similar to the situations in 2017/18 and 2020/21, long-term holders have gradually sold at high levels since the approval of the ETF.
However, despite the decrease in BTC holdings of long-term holders from 14.9 million units to 14.29 million units (a decrease of 4%), the BTC holdings of short-term holders surged from nearly 2.3 million units to 3.07 million units, an increase of over 33%. A balance has been formed between the two groups, which usually occurs in the early stages of a bull market after halving, but now it has appeared early due to the external demand from the ETF, leading to market forces approaching equilibrium.
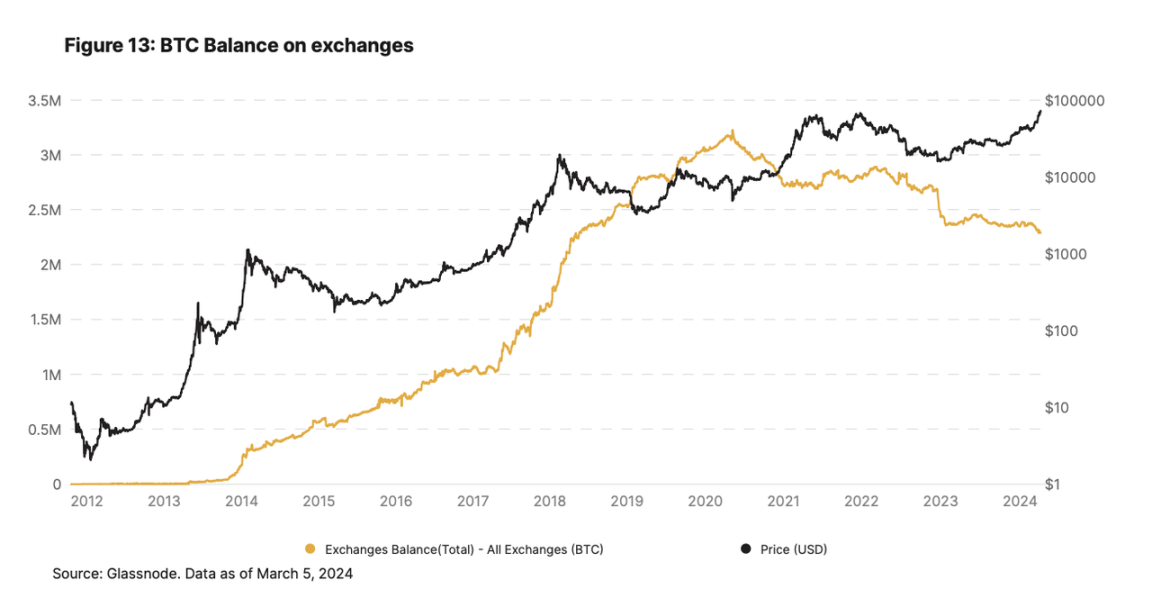
In this scenario, the exchange balance of BTC will hit a five-year low, reaching 2.3 million units, further indicating a sharp decrease in BTC supply.
If this trend continues, the supply side of Bitcoin will increasingly lack liquidity, laying the foundation for supply shortages and the potential outbreak of a parabolic bull market.
Changes on-chain before halving
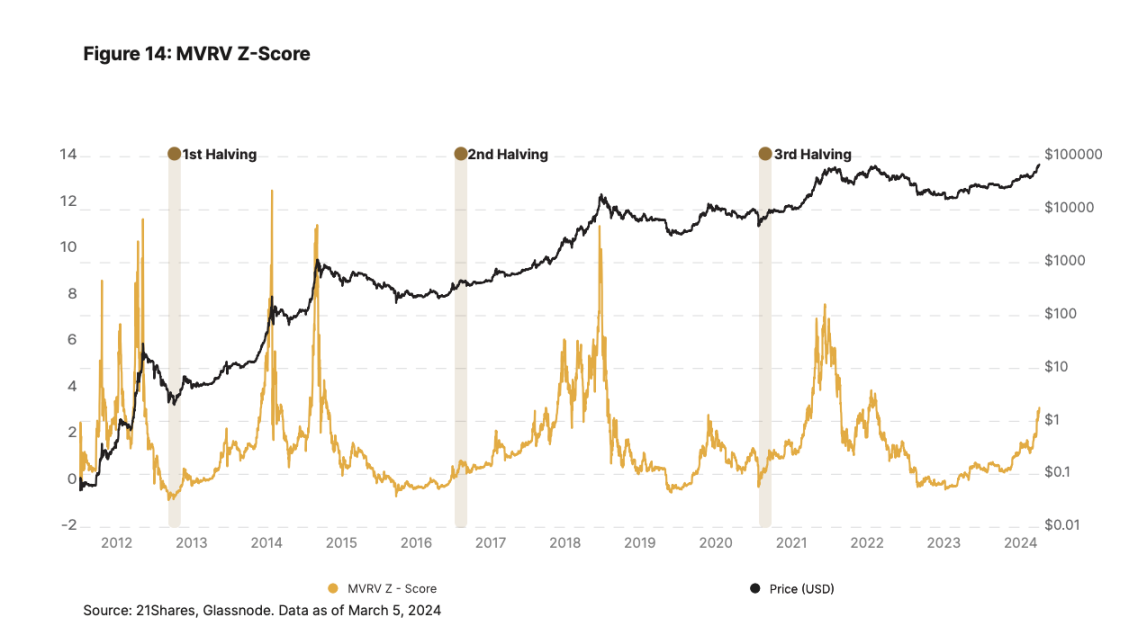
Market Value to Realized Value Ratio (MVRV - Z value)
The Market Value to Realized Value Ratio evaluates the valuation of Bitcoin by comparing its current market value with its realized value. The realized value is the total value of all BTC based on their last transaction price, essentially representing the average acquisition price of all circulating BTC. The Z value standardizes the MVRV indicator by measuring the standard deviation of the current MVRV compared to the historical average. If the market value is several times higher than its realized value, it indicates that BTC is considered overvalued, which has historically been a signal of a market top, and vice versa.
Bitcoin's current MVRV Z value is about 3, a sharp contrast to the value of about 6 in February 2021. However, compared to previous halvings, Bitcoin seems to show a slight deviation in this cycle. This is specifically reflected in the significant increase in the actual price of Bitcoin, with the average MVRV over the past 30 days at 2.4, compared to the average MVRV of 1.07 during the same period in the past three cycles. This indicates that investors may be chasing the rise recently, as the realized price reflects the last transaction price of each Bitcoin. Although MVRV is at a relatively high position compared to the historical average, it still suggests that we may be in the early stages of belief in the Bitcoin bull market; because the approval of the ETF may have preempted the expected market activity after the halving, and Bitcoin's price is no longer just driven by market sentiment and the narrative related to halving.
Unrealized Profit/Loss (NUPL)
We have observed a similar situation with the Unrealized Profit/Loss (NUPL), which evaluates the profitability of Bitcoin holders by comparing the current market value of their holdings with the original purchase price. This is a good market sentiment indicator, where 0 represents extreme fear and 1 represents extreme greed.
Currently, the average value of NUPL is 0.6, indicating that the greed level for Bitcoin has not yet peaked, in contrast to the average value of 0.7 during the period when Bitcoin rose to $60,000 from February to March 2021.
However, comparing Bitcoin's current average NUPL with the average NUPL in the previous three halvings (two months before), it can be seen that the bullish sentiment in the Bitcoin market is growing. The current average NUPL for Bitcoin is 0.6, while the average NUPL for the previous few cycles is 0.42. This further demonstrates our point that the inflow of the ETF is preempting the expected market activity after the halving, and if we act cautiously, then Bitcoin is likely to consolidate in the coming weeks.
From on-chain data, the performance of this cycle has been slightly different and may be leaning to the left in the cycle.
Alignment of halving with favorable market structure
Although 2024 is the "halving year" for Bitcoin, it aligns with other bullish factors for Bitcoin, creating a noteworthy mixed dynamic of supply and demand:
Improved macro environment: With the Federal Reserve maintaining interest rates stable in the past two meetings, according to the CME FedWatch tool, the market expects a 39% probability of at least one rate cut by June 2024 and a 51.9% probability of a rate cut by December 2024. Uncertainty about a rate cut will persist due to a series of conflicting data indicating ongoing inflation.
ETF buying pressure: The approval of the US spot Bitcoin ETF is very favorable for the market structure of Bitcoin, attracting over 10 billion US dollars in net inflows since its launch, and currently holding over 400,000 BTC, over 240% higher than the annualized issuance after halving.
Lack of BTC supply liquidity caused by long-term holders: As of March 15, 2024, the supply of Bitcoin held by long-term holders (investors who have not transferred their BTC for at least 155 days) has remained stable at around 14.29 million BTC, accounting for about 70% of the circulating supply of BTC.
Bitcoin has reached a historical high, but whales remain unmoved: Despite the remarkable rise in Bitcoin since the launch of the ETF, whales holding over 1,000 BTC have not sold during the market's strength. Even when Bitcoin reached $60,000 (in March and October 2021, whales sold Bitcoin at $60,000 and then BTC reached a historical high), investors still show confidence in Bitcoin, indicating that they believe the current uptrend still has significant growth potential. Although as of March 1, 99.6% of the circulating supply of Bitcoin is profitable, the sentiment remains bullish.
In conclusion, considering all factors, the largest cryptocurrency is overall bullish. Our conclusion is that this cycle may indeed be slightly different. While investors should be reminded that Bitcoin is still a relatively volatile asset and may experience pullbacks, it is favorable for entering a new bull market.
After the halving
We usually think that Bitcoin only has store of value left after halving, but Bitcoin still has new vitality.
From a fundamental perspective, we expect innovations such as Ordinals and BRC-20 tokens to drive more demand for Bitcoin and expand its use cases. This is crucial as it ensures that miners can rely on transaction income for survival, as block rewards will continue to decrease until 2140. Due to the limited block size of Bitcoin, when transaction demand increases, transaction fees will also increase.
In 2023, miners' transaction fee income increased from about 0.73% at the beginning of the year to over 30% in December 2023, with daily transaction fees sometimes exceeding $15 million. The increase in transaction fees may affect the price of small-scale transactions and drive more adoption of Bitcoin Layer2 solutions such as the Lightning Network and Stacks.
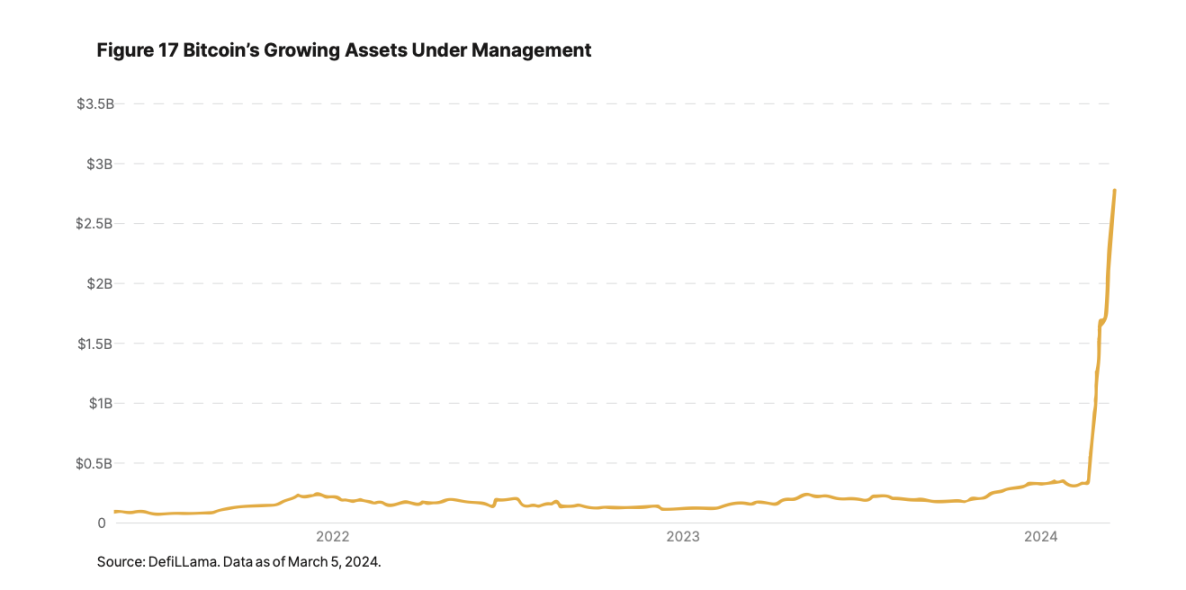
However, Bitcoin's scalability has also attracted market attention. Just like early Ethereum Layer2 solutions (Arbitrum, Optimism, Polygon, etc.), projects focused on Bitcoin scalability are also entering the Bitcoin space, introducing various scalability solutions based on Optimitic Rollups and zkRollups. Although their long-term development is unpredictable, they are favorable for unlocking more utility for Bitcoin, even achieving large-scale growth like Ethereum. It is worth noting that under the leadership of the two new Layer2 solutions, Bitcoin's TVL surged 7 times in March, reaching $2.7 billion, ranking among the top 6 networks. Finally, from December 2023 to February 2024, Bitcoin accounted for 33% of NFT trading volume, totaling $2.76 billion, second only to Ethereum's $3.99 billion, surpassing Solana's $1.2 billion, indicating the significant impact of Ordinals on the Bitcoin network.
免责声明:本文章仅代表作者个人观点,不代表本平台的立场和观点。本文章仅供信息分享,不构成对任何人的任何投资建议。用户与作者之间的任何争议,与本平台无关。如网页中刊载的文章或图片涉及侵权,请提供相关的权利证明和身份证明发送邮件到support@aicoin.com,本平台相关工作人员将会进行核查。


