On the previous trading day, the Ethereum spot market retraced to the support level around 3300 and rebounded. In the early morning, it rose to near 3416 before falling again and rebounding around 3335. In the early morning today, it rose to near 3573 before falling, and the current market is oscillating around 3430.
Yesterday, Changlu provided support at 3300 in the morning. If it breaks, it can continue to look for support near 3260. If it doesn't break, it's a good opportunity to enter long positions. In the evening, the point for shorting the rebound was also given. Friends who followed the operation gained from both long and short positions.
Ethereum market analysis: After retracing near the low point of 3050 and rebounding last week, it formed a long lower shadow candlestick, closing above the 5-day moving average support. From a technical indicator perspective, all technical indicators are still showing a downward trend. If the weekly market breaks below the 5-day moving average support, it is likely to continue to decline, possibly retesting the support near the 10-day moving average. On the daily chart, the market received support near the lower Bollinger Band and rebounded. Two days ago, a doji was formed, and yesterday a small bullish candlestick was formed. In the morning, the rebound was suppressed by the upper moving average. From a technical indicator perspective, there is still room for a rebound in the market. Whether it can hold above the 5-day moving average support near 3420 has become crucial. However, it is important to note the impact of the mid-April Bitcoin halving on the overall cryptocurrency market. Friends who short at high levels must set stop-loss orders to prevent unnecessary losses caused by market changes.
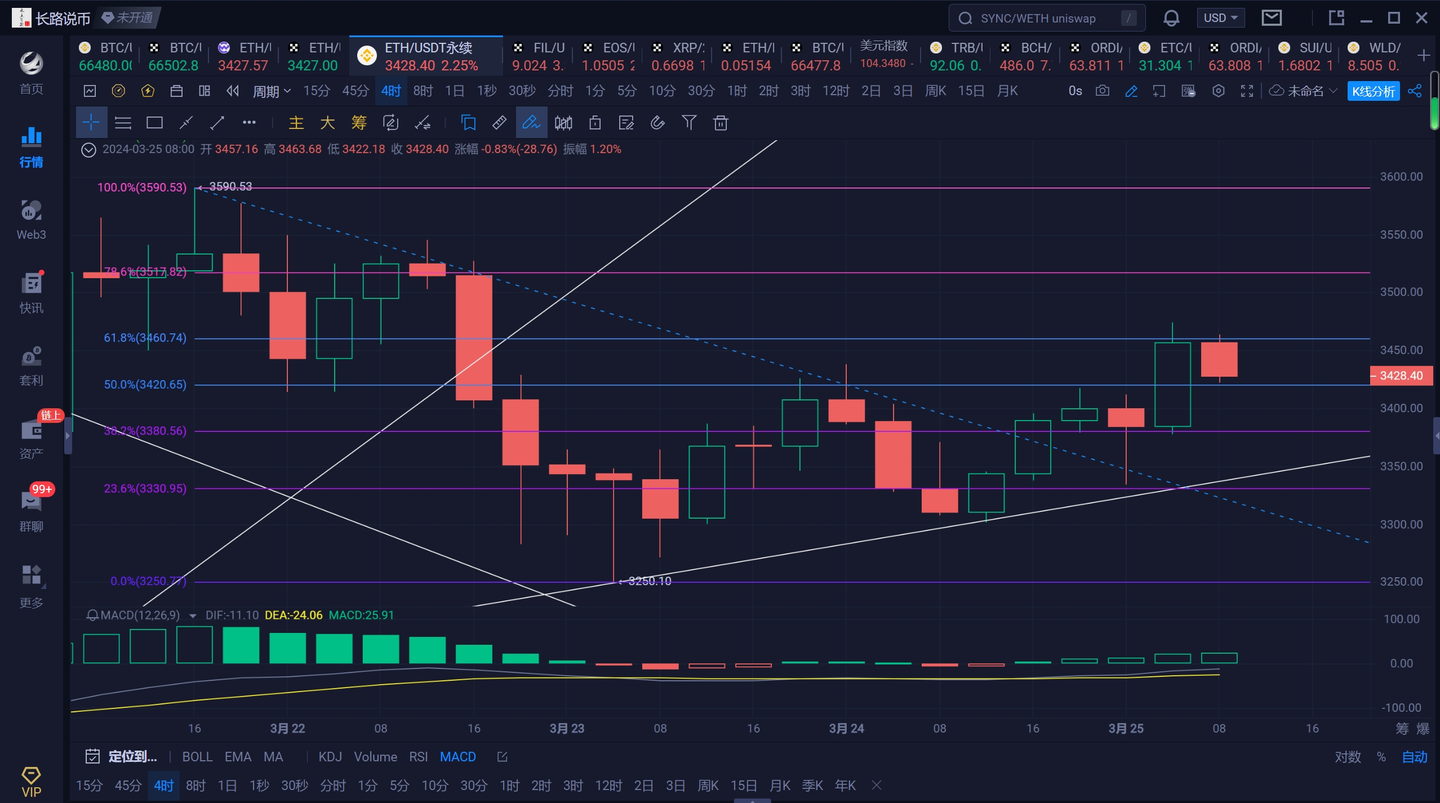
4-hour chart: The market received support and rebounded after retracing. It was suppressed by the Fibonacci retracement level of 0.618 near 3460. Support near 3420 at the 0.5 level should be noted. From various technical indicators, there is a downward trend, with the RSI value near the overbought zone at 90. Combined with the bearish engulfing pattern on the 1-hour chart, the overall market is expected to focus on oscillation and recovery. First, look for retracement. If the support at 3420 is broken, it may test the support near 3380. If not, consider entering long positions. Looking at the overall trend, after retracing near 3050, it may form a head and shoulders pattern. It is necessary to continue to observe whether the market rebound can break through the previous high near 3590. If it does, there is a chance to form a head and shoulders pattern.
Trading advice: Real-time strategies are provided.
For more strategies, follow Changlu's Weibo @长路财经
Reminder: Strategies are for reference only. Set stop-loss and take-profit targets, and consider partial profit-taking and trailing stop-loss to protect profits and avoid giving back too much profit.
The cryptocurrency trading market is always in full swing. It is everyone's common wish to seize the opportunity and get a share. Please believe that "the only thing missing between you and financial freedom is a long road." With the guidance of Changlu, you will definitely achieve cryptocurrency wealth faster and more steadily.
免责声明:本文章仅代表作者个人观点,不代表本平台的立场和观点。本文章仅供信息分享,不构成对任何人的任何投资建议。用户与作者之间的任何争议,与本平台无关。如网页中刊载的文章或图片涉及侵权,请提供相关的权利证明和身份证明发送邮件到support@aicoin.com,本平台相关工作人员将会进行核查。


