News
On March 18th, according to SoSo Value monitoring, as SOL price broke through $200, the search popularity of the term "Solana" on Google Trends has reached 100, setting a historical high for the search trend of the term "Solana" in the past 5 years. The second highest was the search popularity in early September 2021, which was 84.
On March 18th, according to Alternative data, the cryptocurrency fear and greed index today is 77 (yesterday was 79), indicating that the market is still in a state of extreme greed.
Note: The fear index threshold is 0-100, including indicators such as volatility (25%), market trading volume (25%), social media popularity (15%), market surveys (15%), Bitcoin's proportion in the entire market (10%), and Google hot word analysis (10%).
On March 18th, Musk posted a picture of a cap dog on social media early this morning to celebrate St. Patrick's Day. As a result, the related meme coin WIF rose by nearly 20%, now priced at $2.9845.
Note: St. Patrick's Day is on March 17th every year, commemorating the patron saint of Ireland, St. Patrick. Nowadays, St. Patrick's Day has gradually become a festival in some countries. The United States has been celebrating it since March 17, 1737. The traditional color of St. Patrick's Day is green.
Market Review
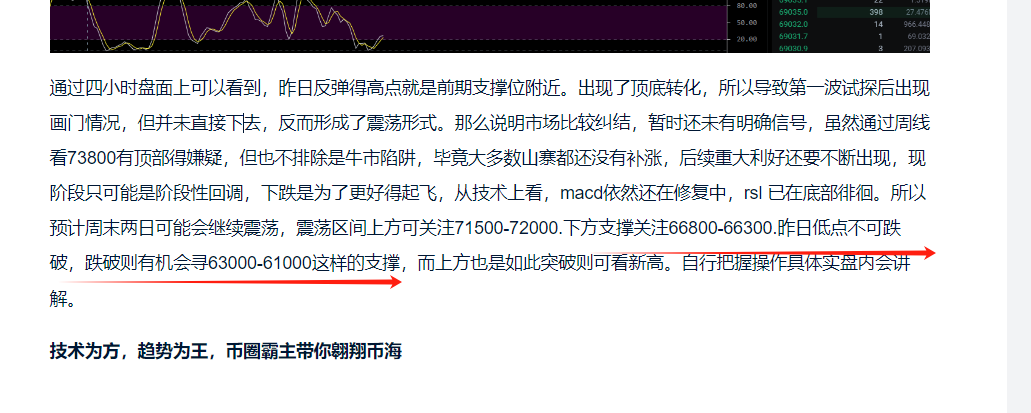
In yesterday's market, after breaking through the new low, the market only rebounded back to the 68000-69000 range, and the overall market is still in a continued oscillation. Each time it falls, there is a divergence on the 15-minute to 1-hour chart, leading to a rebound, but the strength is not very strong. So, how should we operate in the future?
Market Analysis
Macro analysis: Last week's industry focus was the partisan struggle in the United States over the Ethereum spot ETF. Due to the opposition of the Democratic Party, Bloomberg ETF analyst Eric Balchunas significantly reduced the likelihood of approval for the Ethereum ETF spot in May from 60-70% to 30%. The involvement of cryptocurrencies in political struggles is not news anymore. The partisan struggle over cryptocurrencies in the United States will continue. However, regardless of the struggle, if the SEC wants to reject the Ethereum ETF, it needs to explain to financial institutions and Wall Street why it cannot be approved. This is not an easy pressure to deal with. Unless the SEC can gain widespread political support, rejecting the Ethereum ETF should not be an option for a rational regulator.
Last Friday, major U.S. stock indices hit a low for over a week. The three major U.S. stock indices fell again on Friday, with the Nasdaq falling by nearly 1%, the S&P falling for two consecutive weeks, and the Dow falling for three consecutive weeks. Some analysts have linked the sharp drop to the CPI data. On March 12, the United States announced that the CPI in February rose by 3.2% year-on-year and 0.4% month-on-month, an increase of 0.1 percentage points from January, the largest increase since September last year. However, as we have expressed before, a single-month change cannot change the overall trend. It is too early to suspect that the Fed will adjust its interest rate cut plan based on the February CPI. In addition, it is worth noting that a report from JPMorgan Chase believes that the outflow of gold ETFs is not related to the net inflow of Bitcoin spot ETFs. JPMorgan Chase's research shows that the outflow of gold ETF funds is being used to purchase physical gold bars.
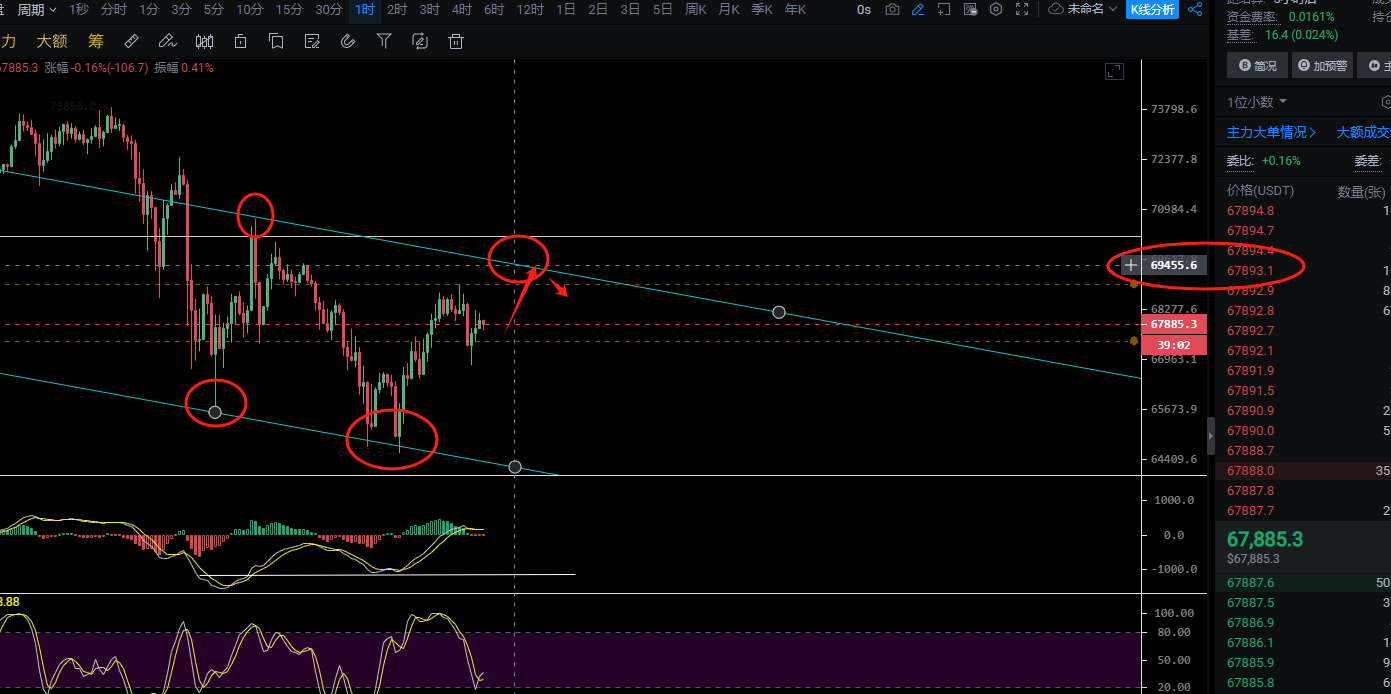
From the market, it can be seen that the market is currently in a channel of oscillating downward. In the morning, it surged and then fell back to near the 66800 support, returning to the 68000 level, still having the momentum to rise. At the same time, the indicators show that the RSL has reached the bottom and turned upward. Therefore, it is recommended to go long in the 67800-67400 range in the short term, which is the current price. The upper resistance is at 69500-70300, and a breakthrough can lead to 71500. 71500 is a watershed.
As for the downside, pay attention to whether the new low will be broken. If it is broken, there is a chance to go to 61000-59000.
The overall market continues to oscillate, with little to say. Just go long at the support and be cautious. This is just an adjustment. After rising for about a month, it is normal to adjust for a month. Whether the bottom has appeared at the moment is still uncertain. Pay attention to whether these three conditions are met: 1. The oscillating downward channel is broken. 2. No new lows are being created. 3. The recent high is broken. In addition, it can be clearly stated that in a bull market, do not miss the opportunity to buy in. And choice is greater than effort. For example, with Sol this time. Currently, Sol is hot while others are not. After a period of time, it will be the opposite. Learn to lay the groundwork in advance. If blindly chasing hotspots, unless you do it early, the risk is high, and the cost-effectiveness is not high. Specific real-time trading will be explained on your own.
Technology is the method, and the trend is the king. The dominant force in the currency circle will guide you through the currency sea.
Be cautious when entering the market, as trading carries risks.

免责声明:本文章仅代表作者个人观点,不代表本平台的立场和观点。本文章仅供信息分享,不构成对任何人的任何投资建议。用户与作者之间的任何争议,与本平台无关。如网页中刊载的文章或图片涉及侵权,请提供相关的权利证明和身份证明发送邮件到support@aicoin.com,本平台相关工作人员将会进行核查。