On the evening of March 12th, AICoin researchers conducted a live graphic and text sharing session on AICoin PC-end Group Chat Live, revealing the "Automatic Trading Script for MACD Divergence Signals." Here is a summary of the live content.
I. AICoin Tool Sharing
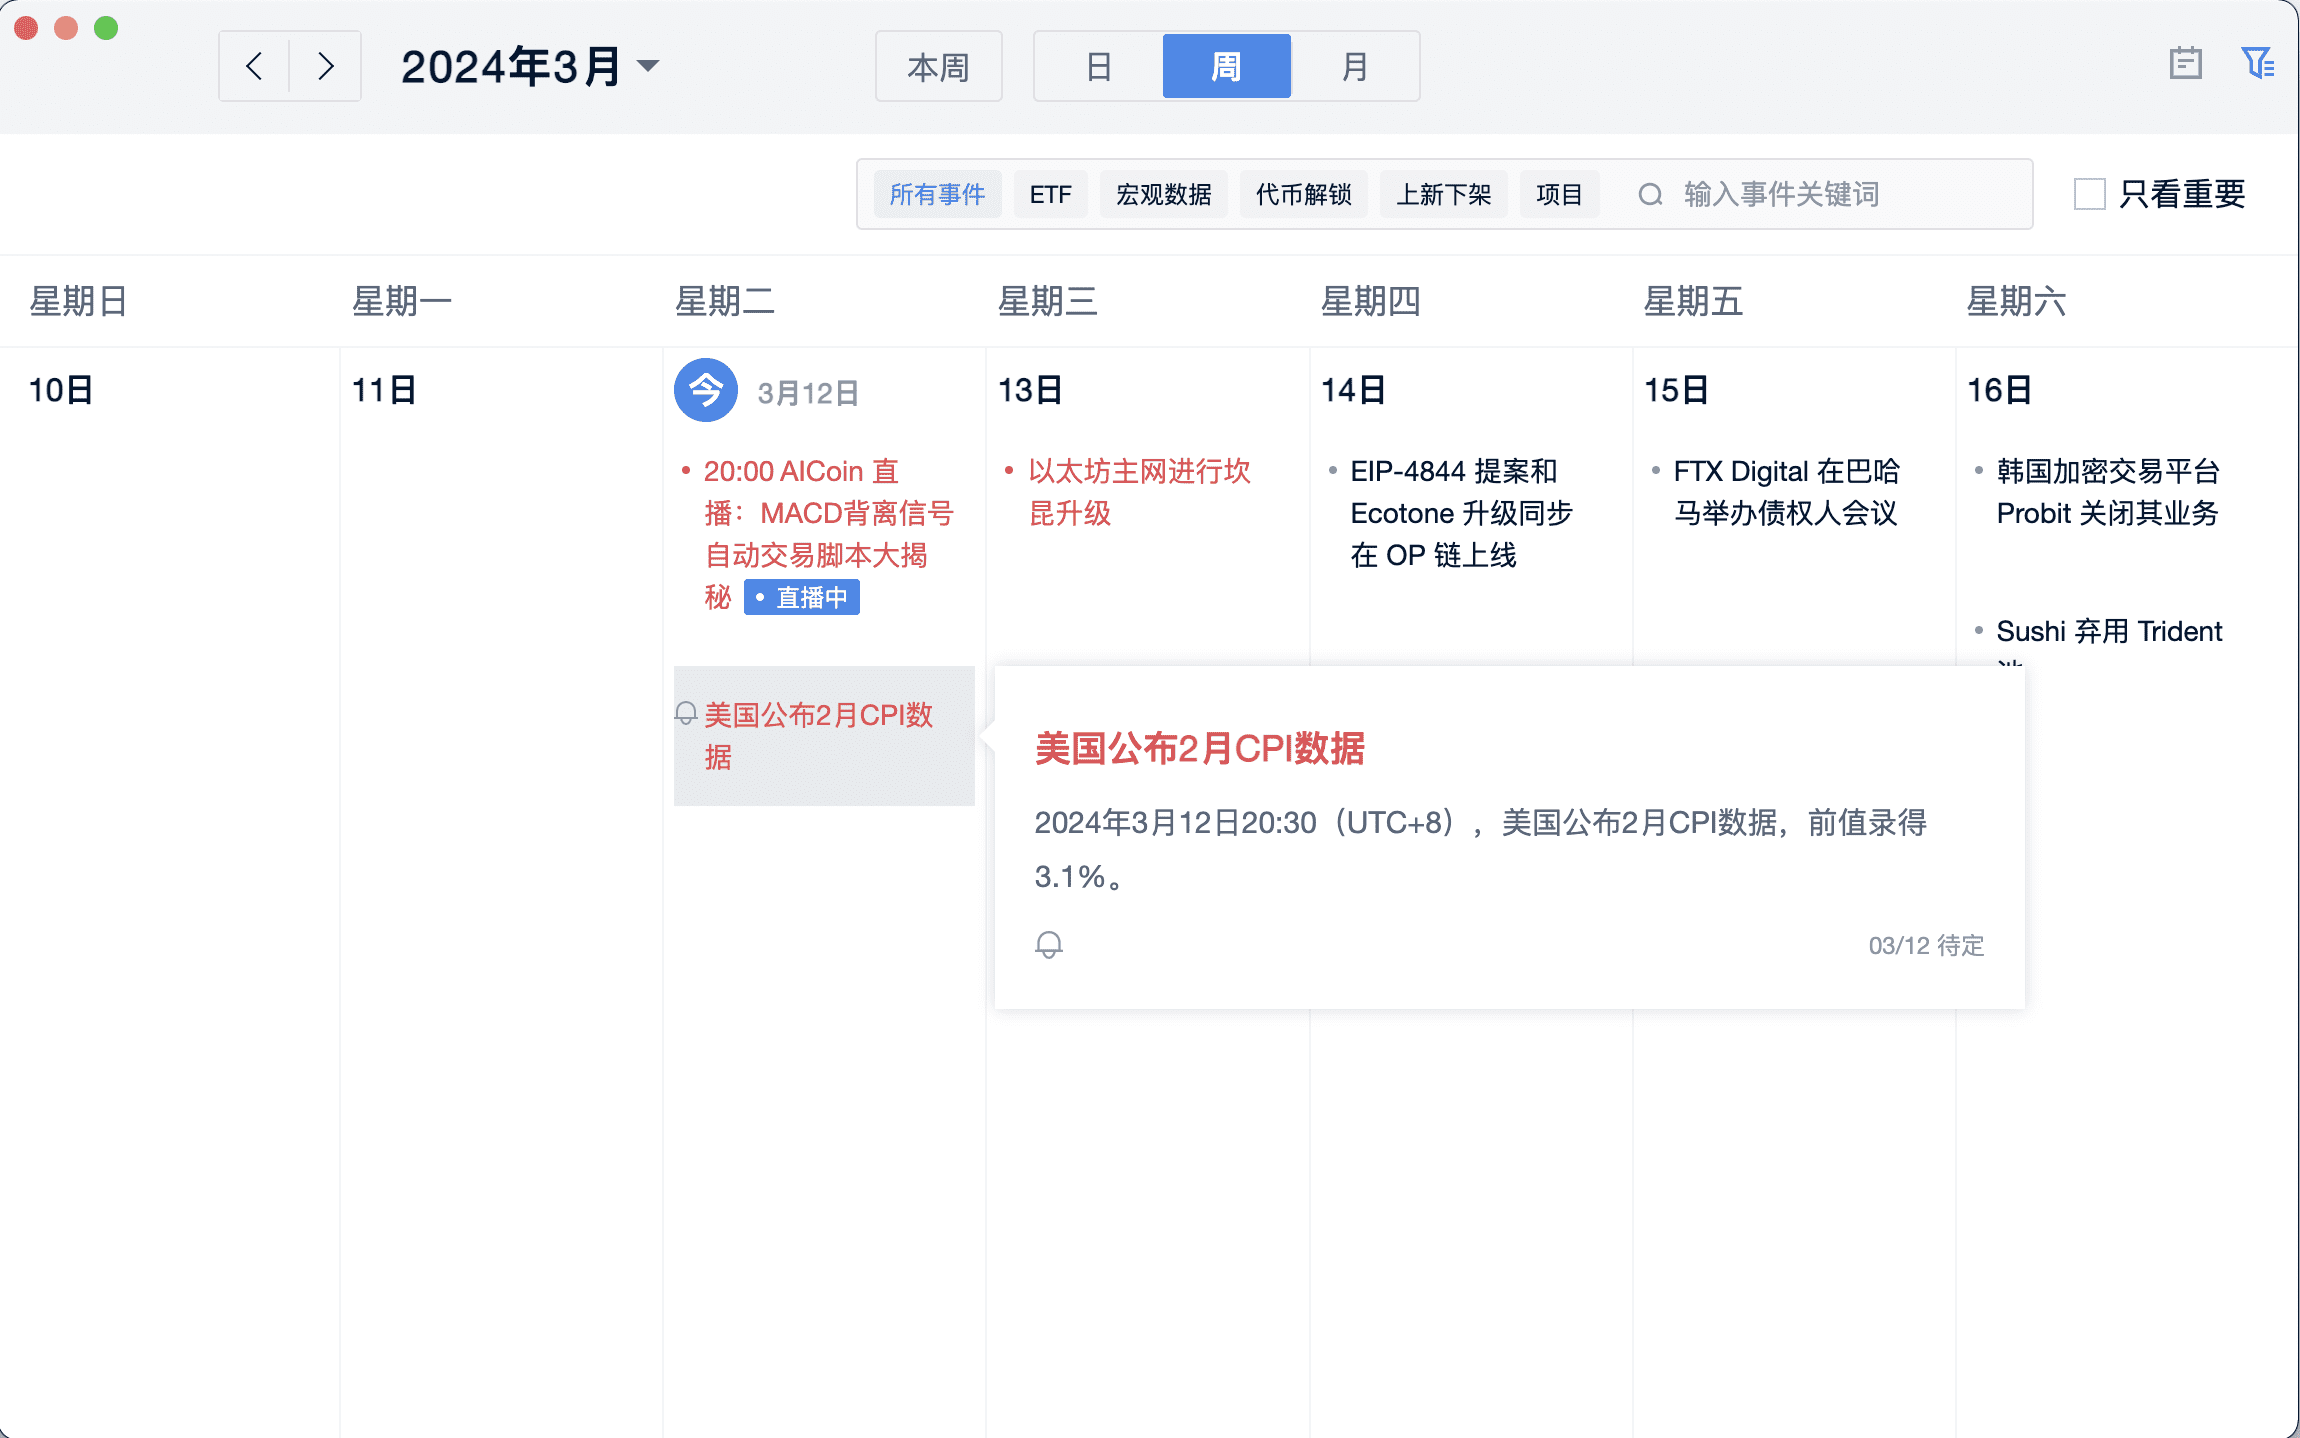
Flash News - View the calendar of major events, such as the release time of CPI.
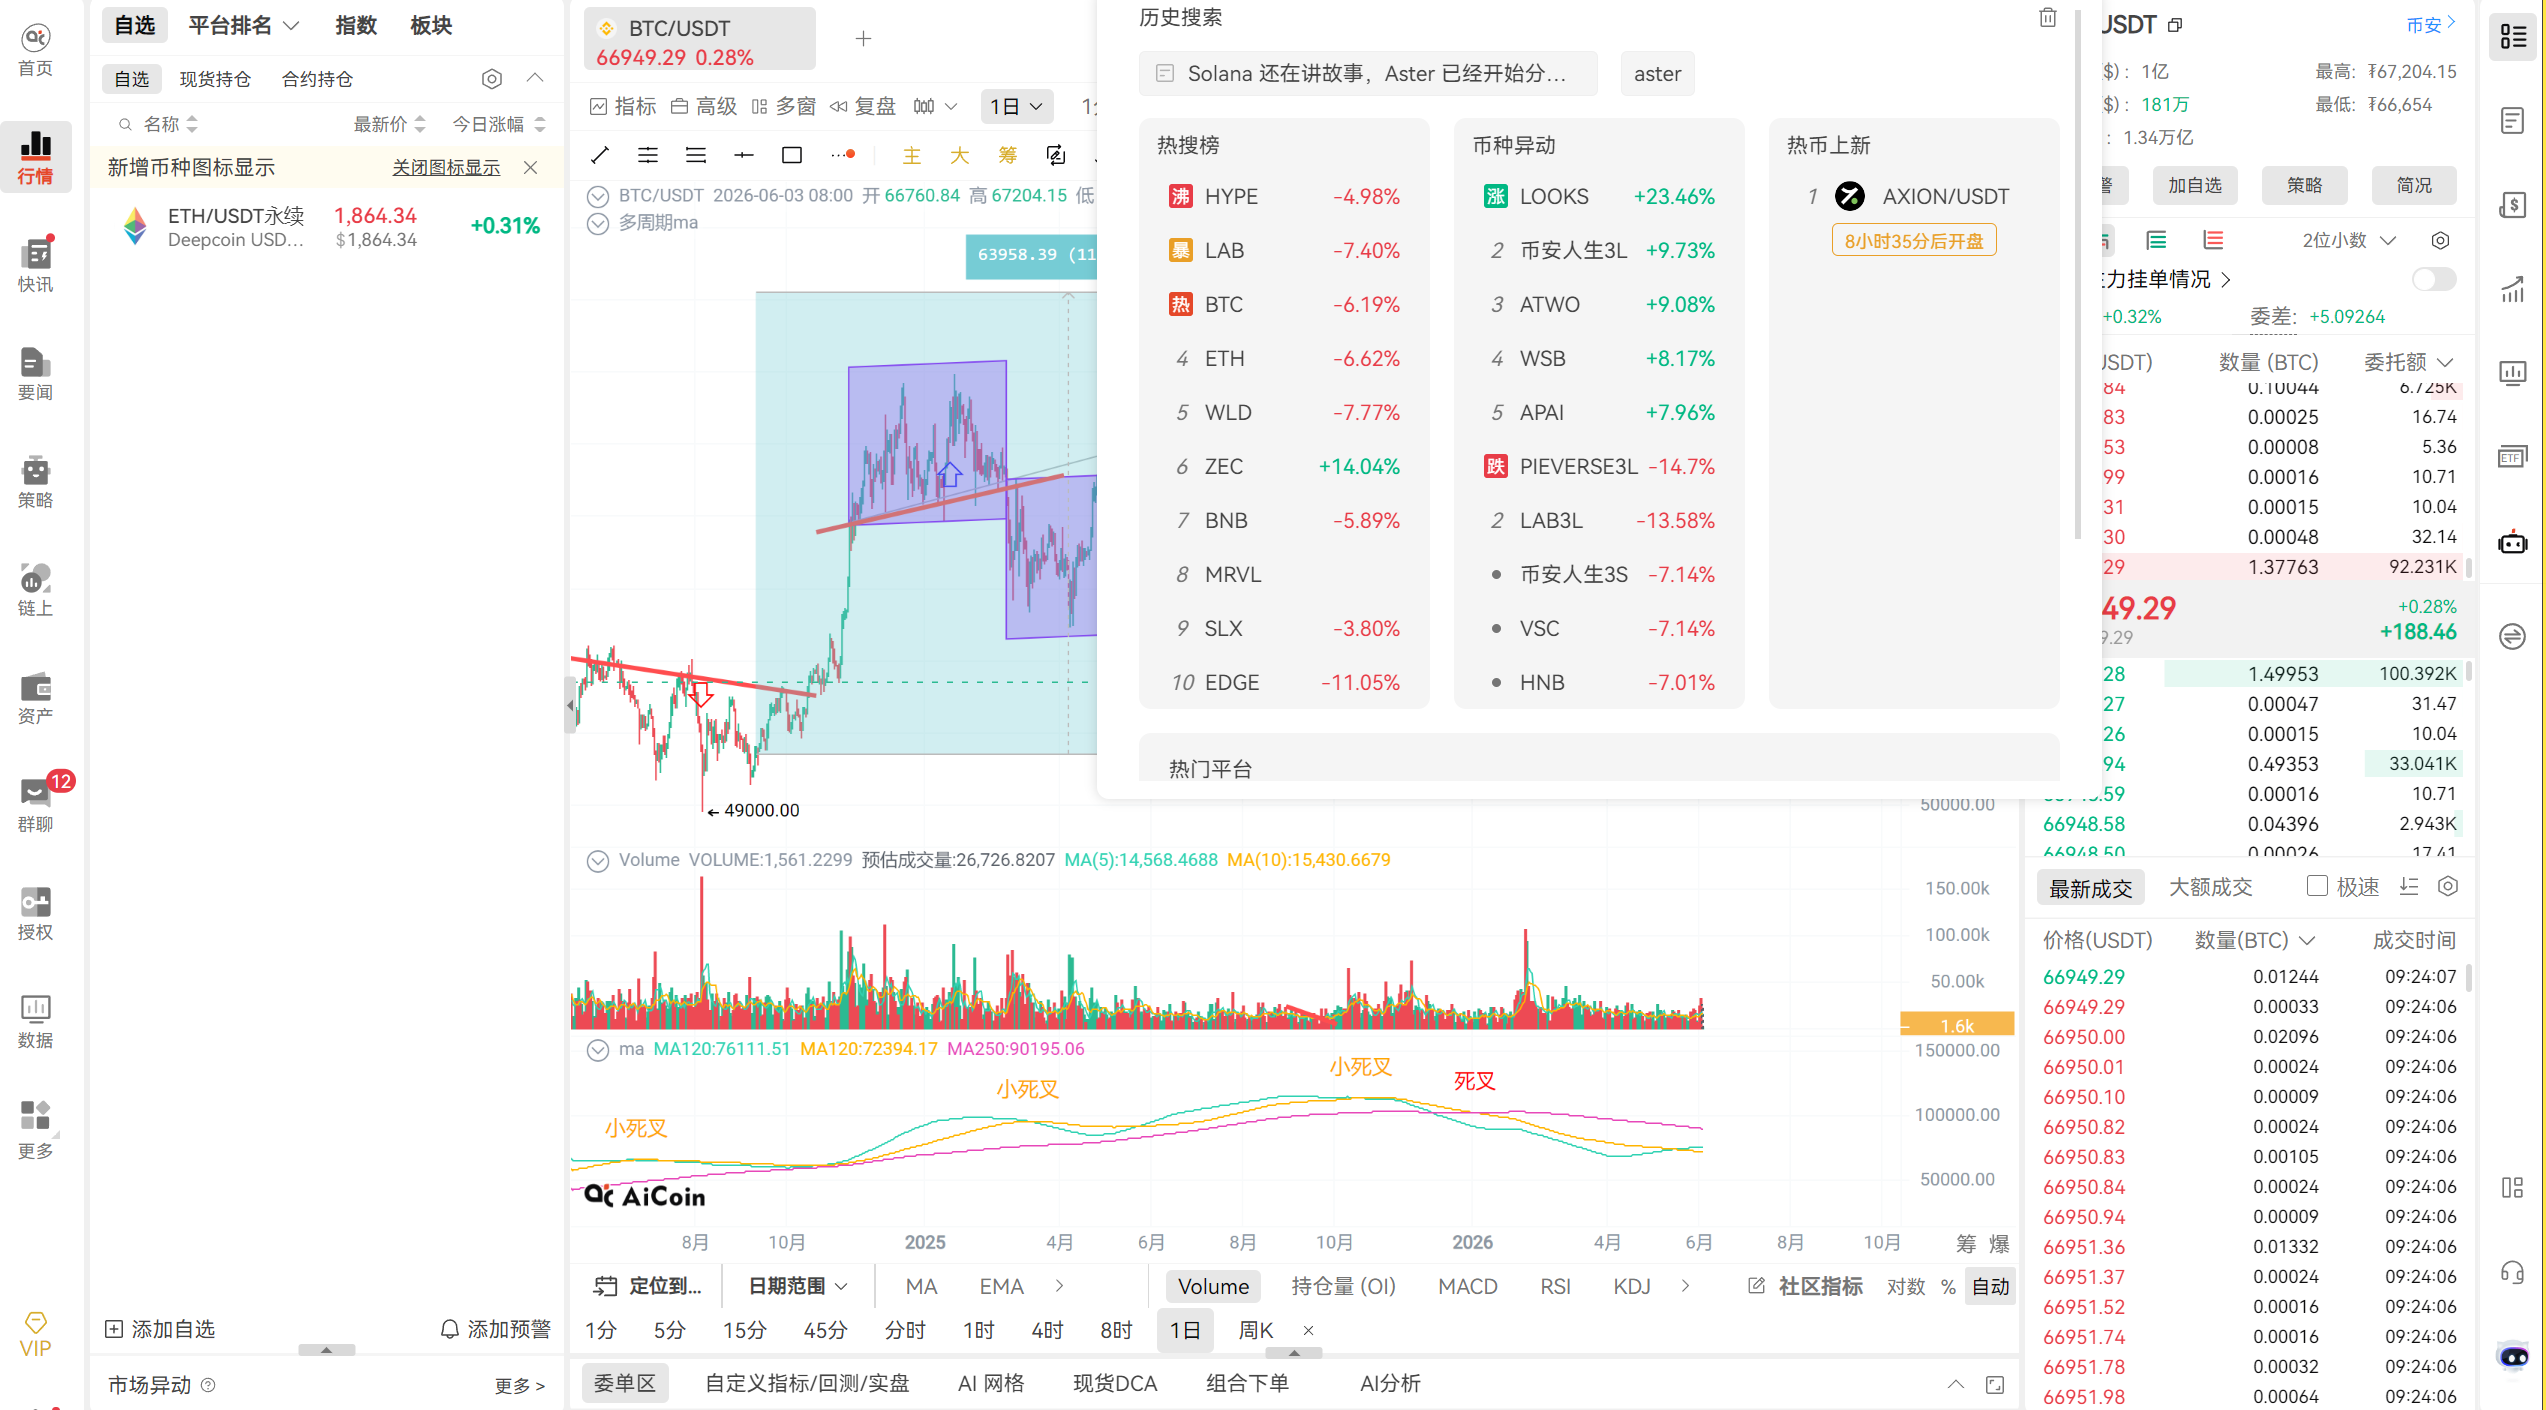
You can use the unique intelligent analysis of PRO version K-line to analyze the market of the currency: 1-hour BTC.
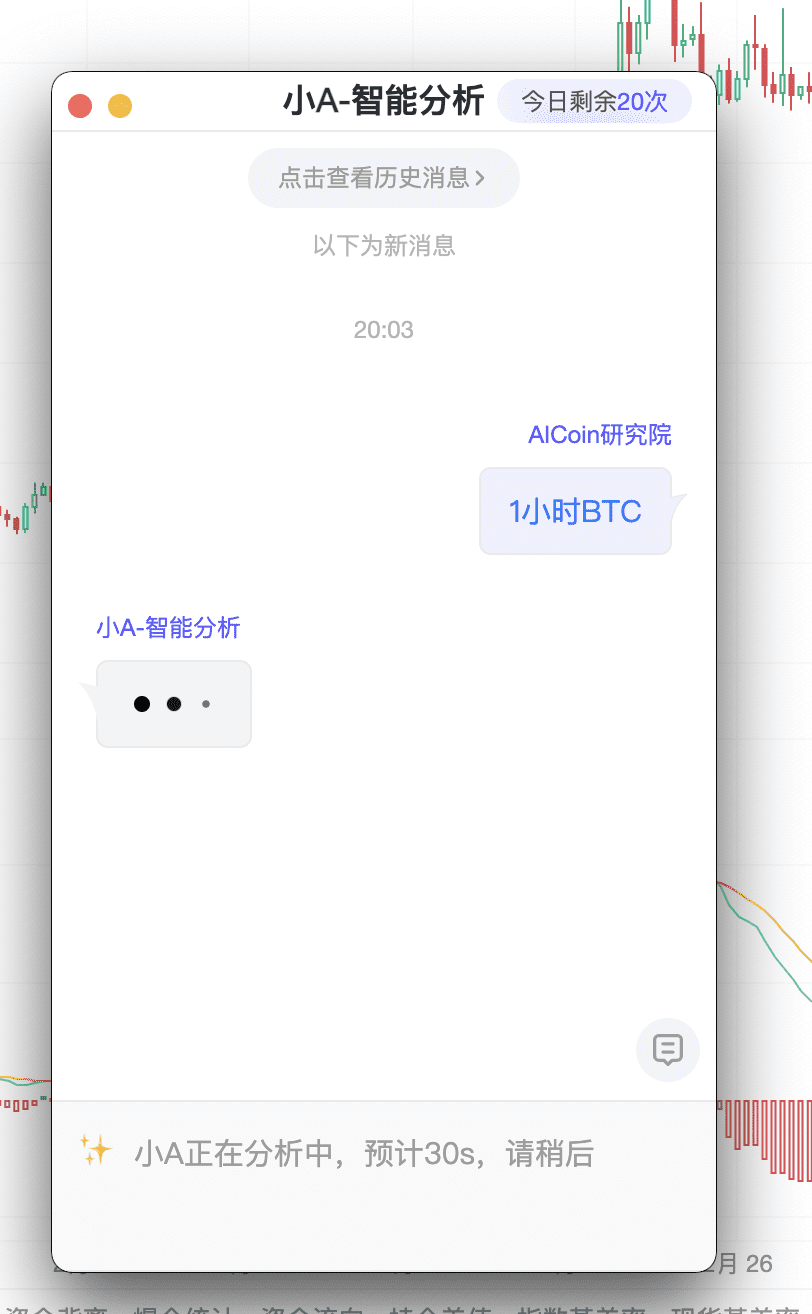
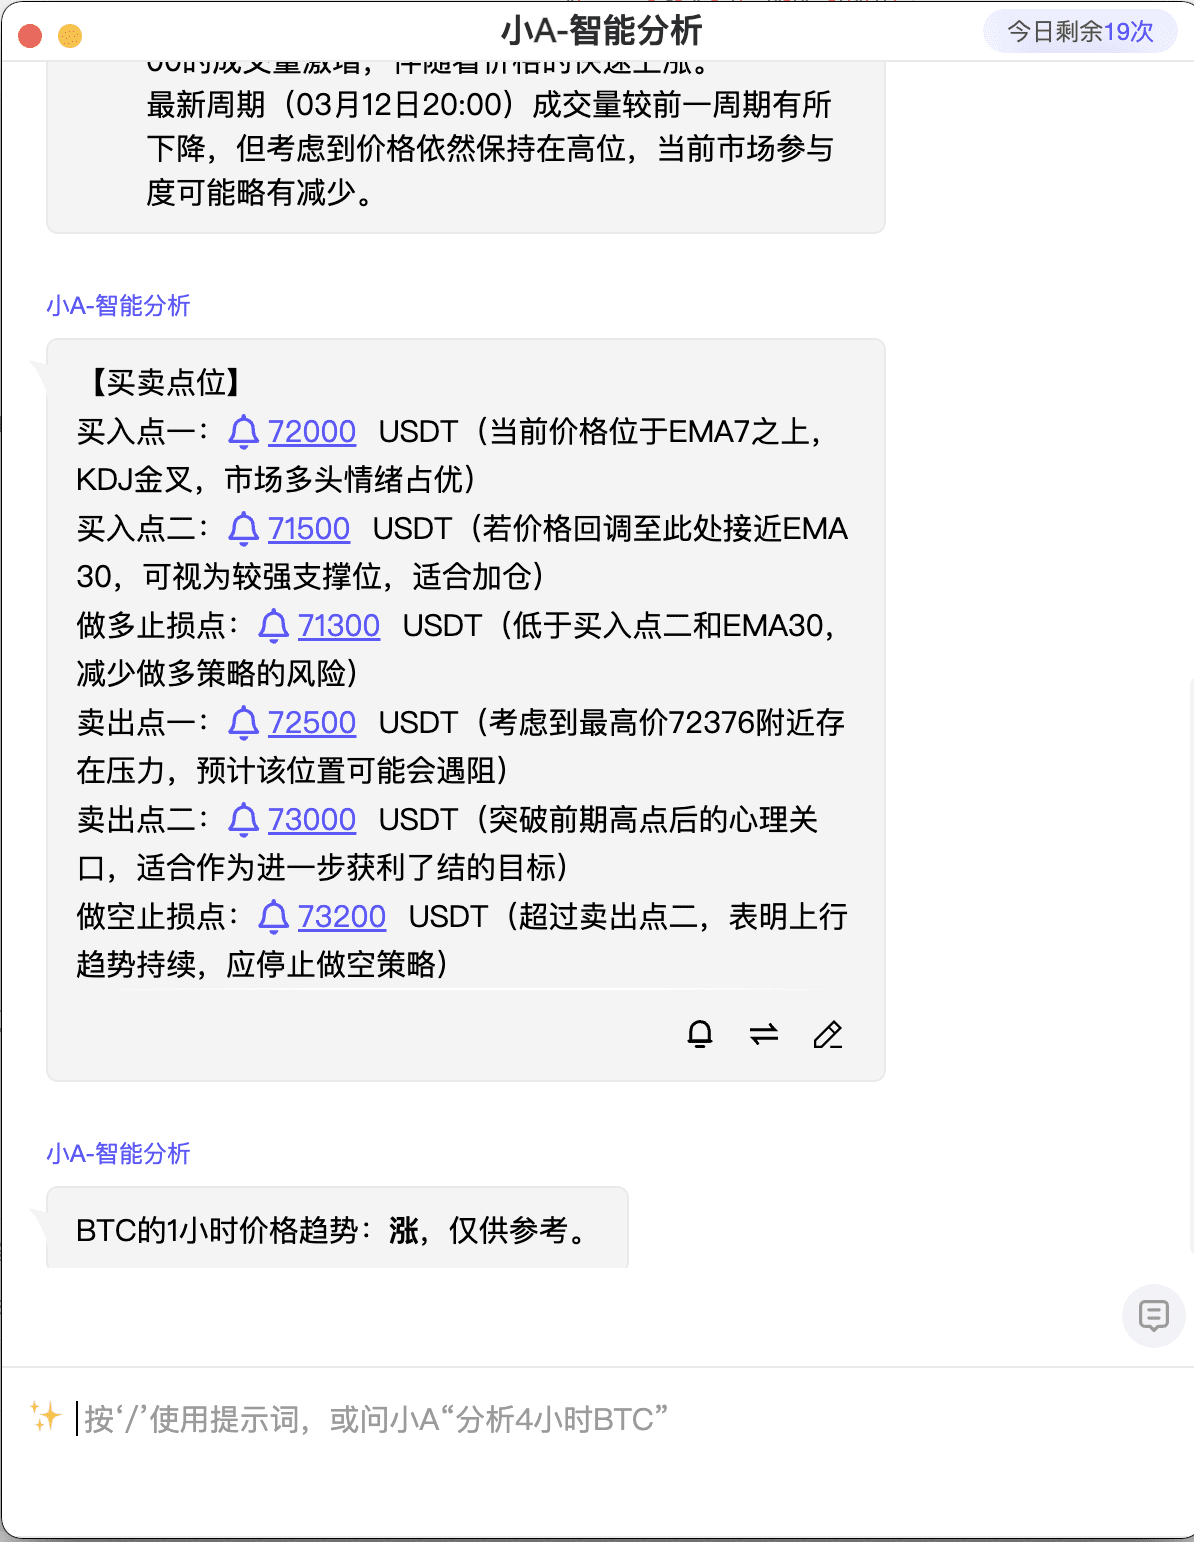
Xiao A is the industry's first intelligent analysis robot for currencies and K-line charts launched by AICoin. Xiao A can help you in 3 minutes to: (1) analyze the trend of the currency; (2) analyze the trend of the K-line chart; (3) analyze the price trend combined with indicators; (4) provide advice on buying and selling points; (5) predict the rise and fall of the currency price. Experience the intelligent analysis of Xiao A by opening the PRO version K-line: https://aicoin.app/zh-CN/vip
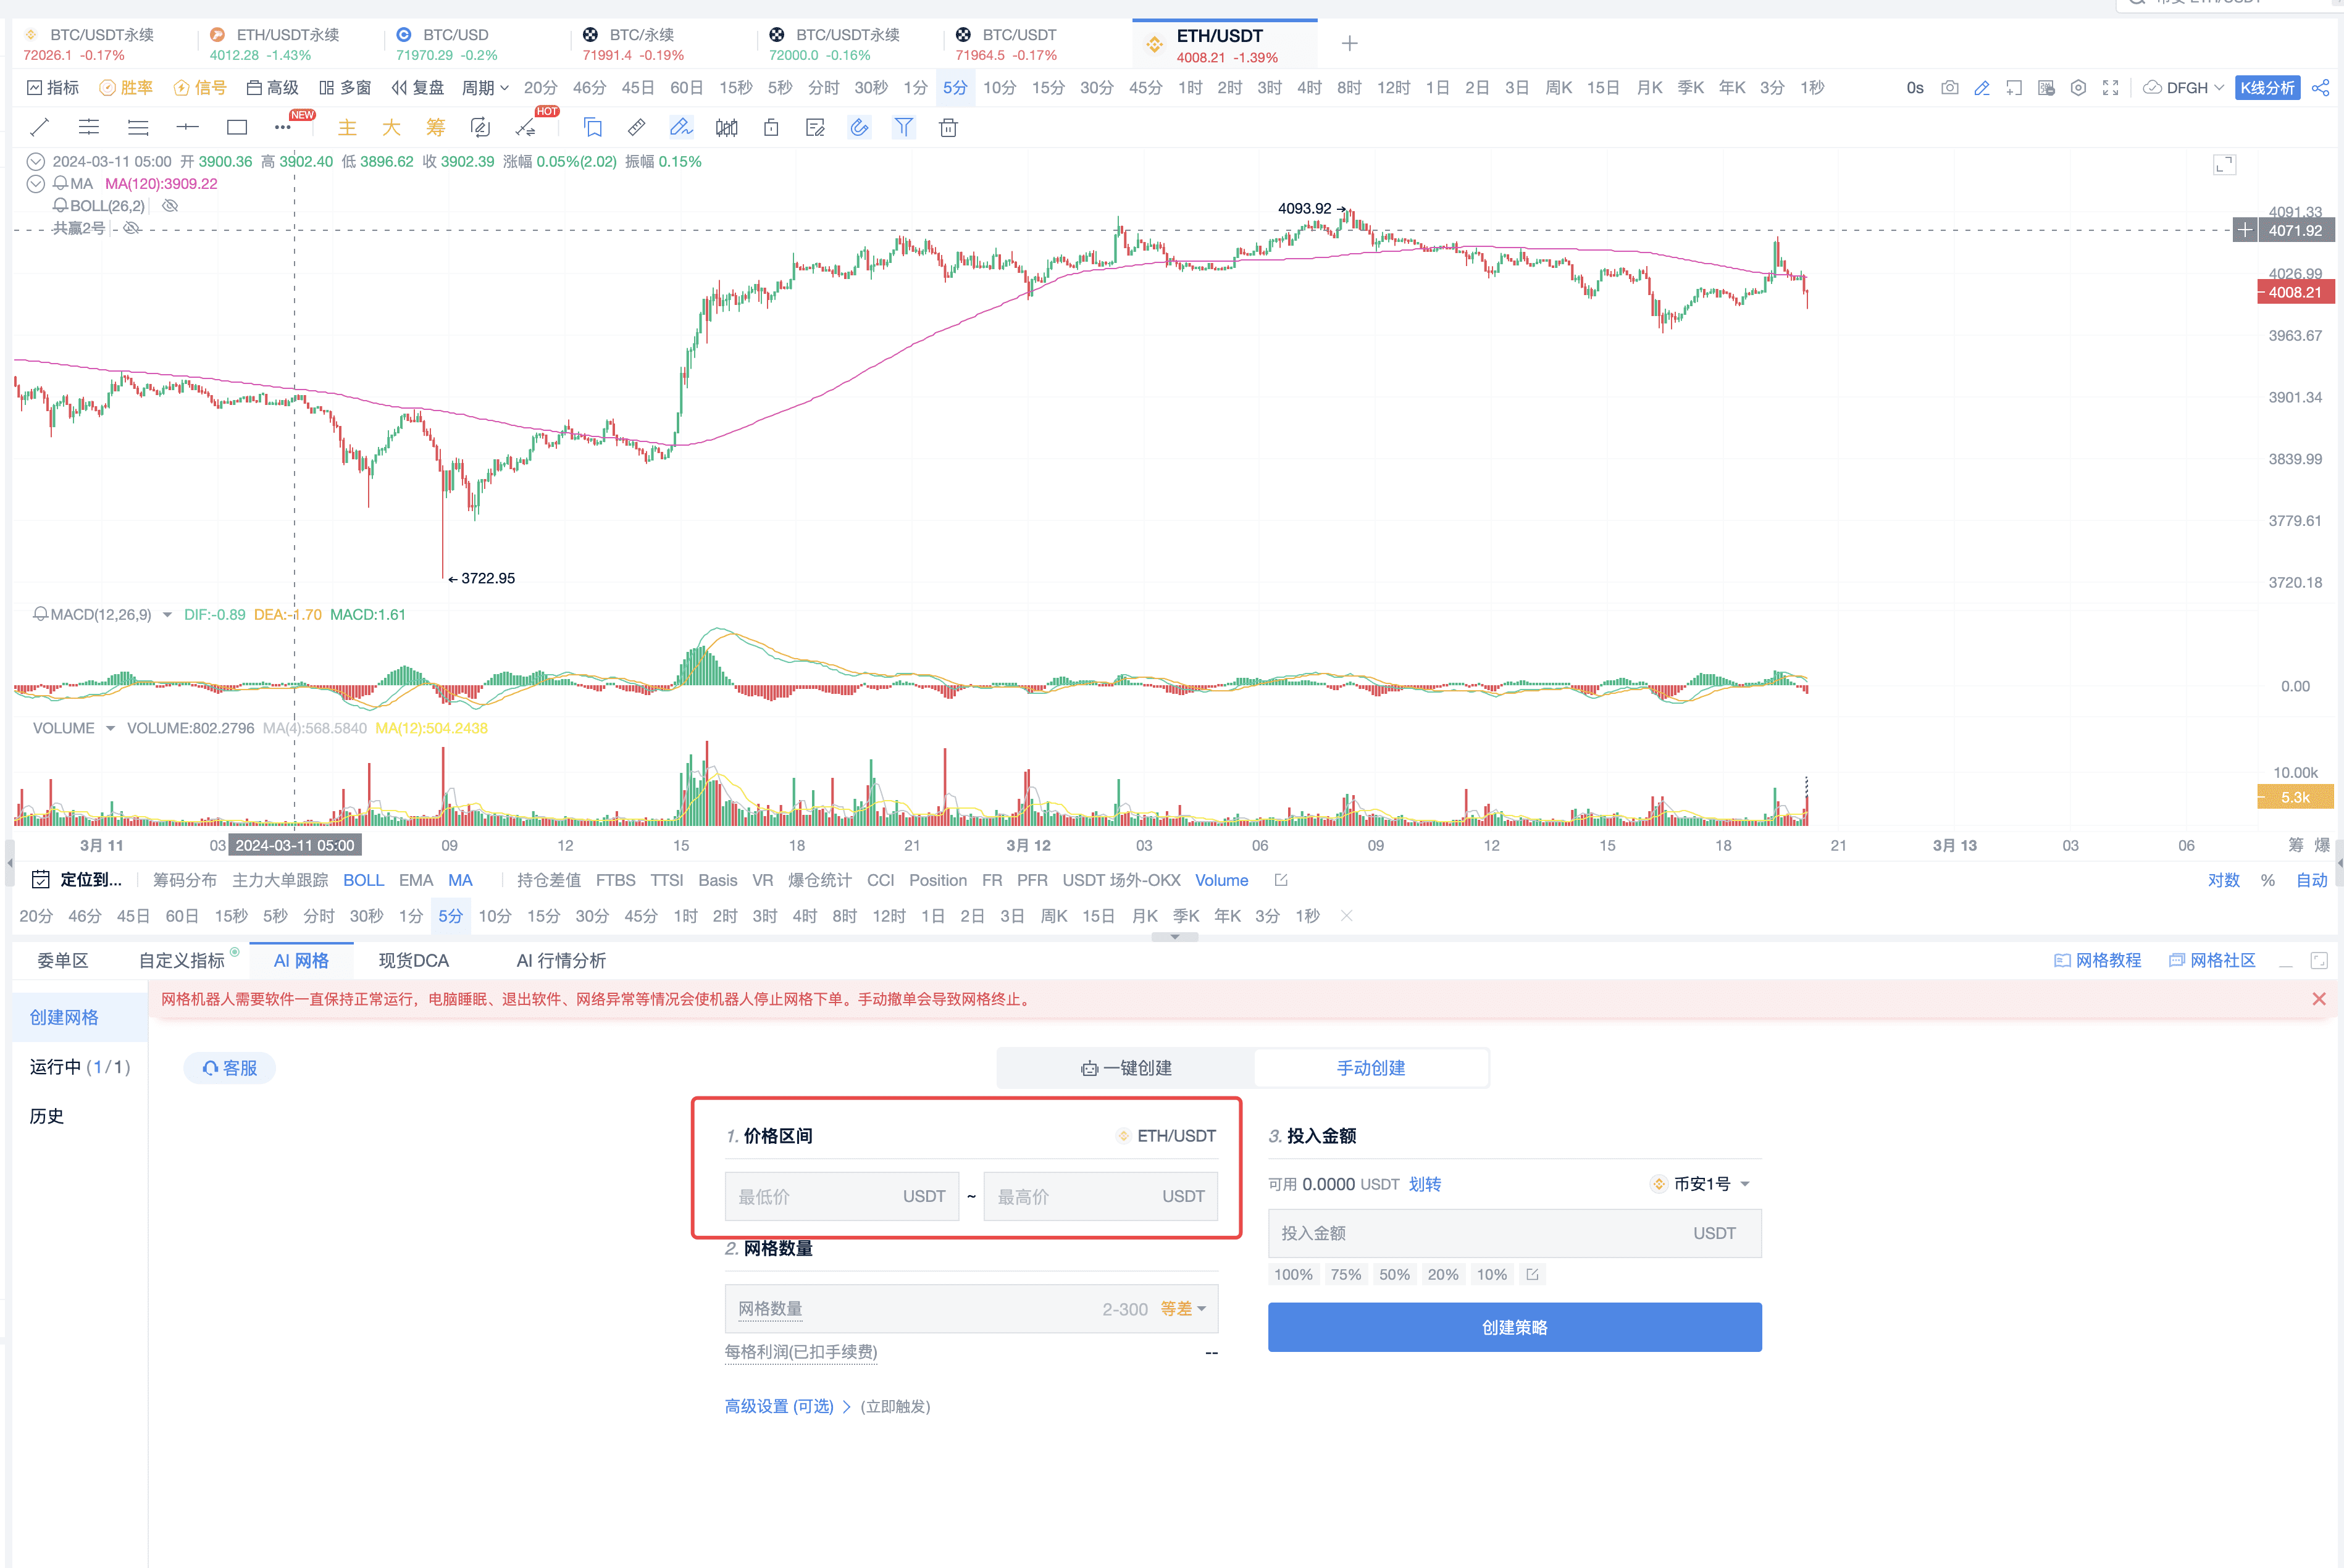
AI Grid Trading
Research Institute trading test results
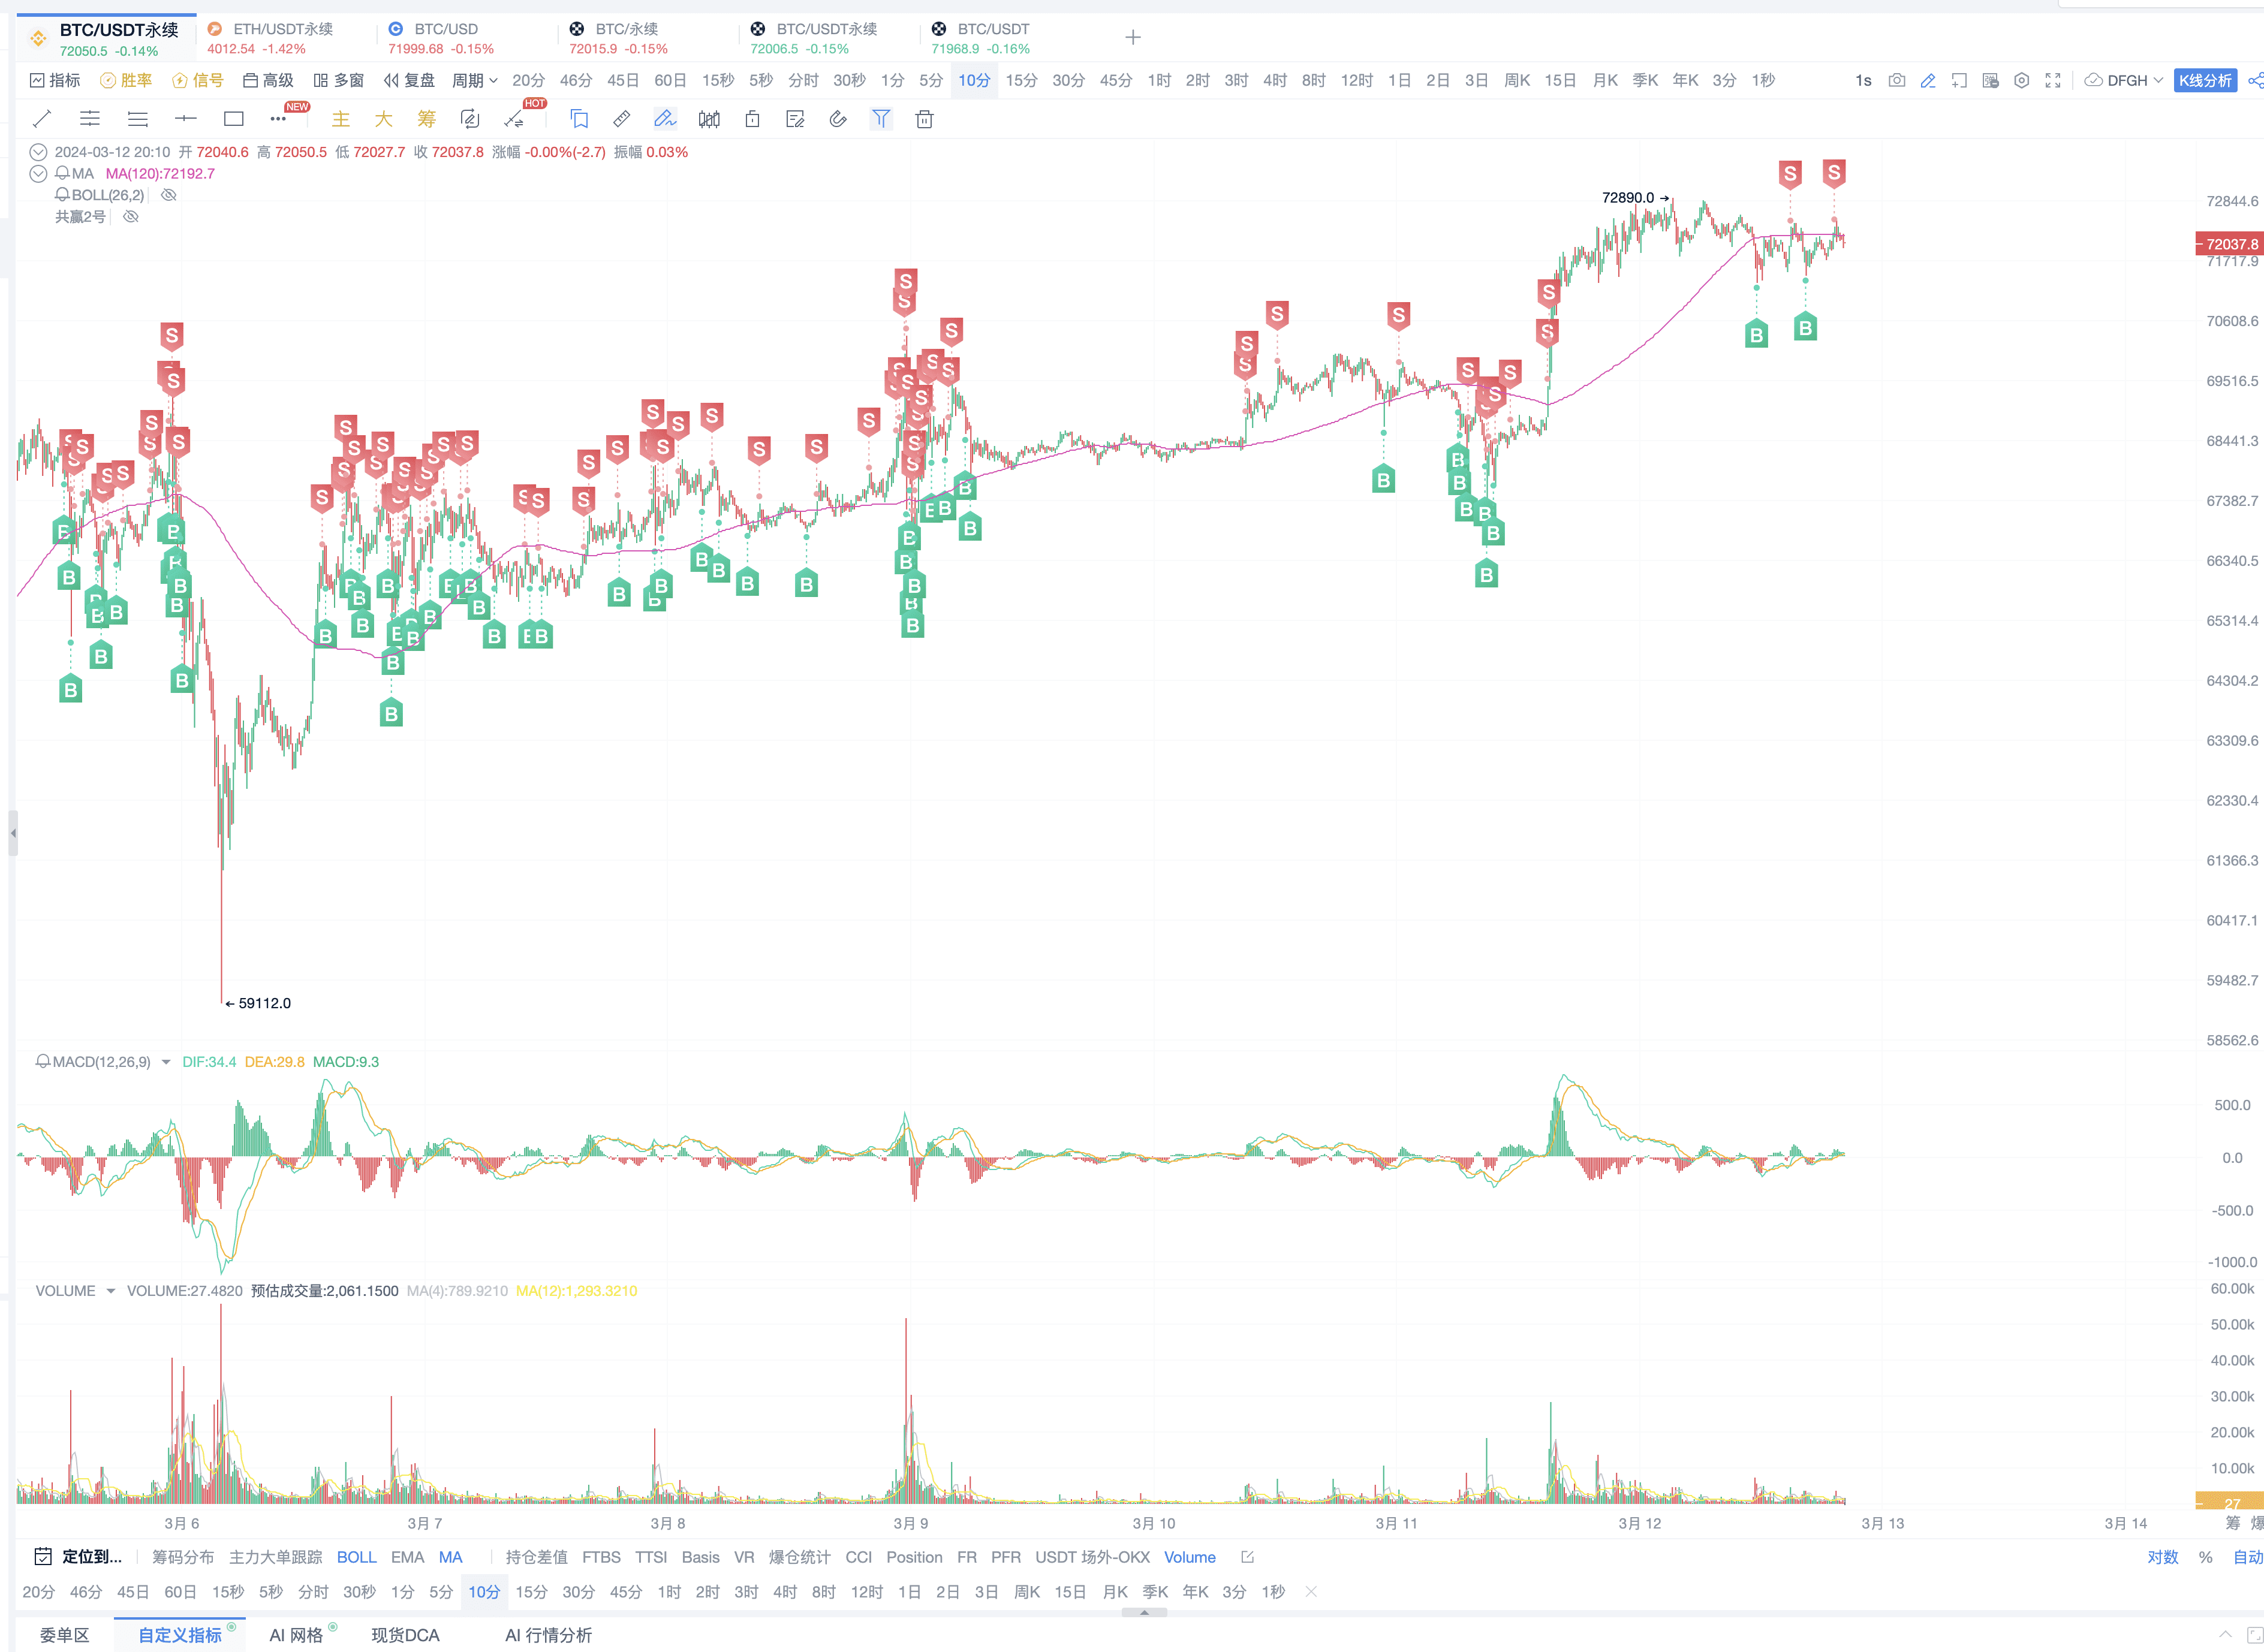
AI grid tool: Basically, buy at the low point and sell at the high point.
AI grid tool, the setting of upper and lower limits can refer to:
Xiao A's intelligent analysis of price fluctuations;
Use the grid tool to conduct grid trading within this price fluctuation range.
II. Sharing of MACD Divergence Signal Automatic Trading Script
Conclusion of MACD Top and Bottom Divergence
Conclusion: Top divergence indicates a bearish outlook; bottom divergence indicates a bullish outlook.
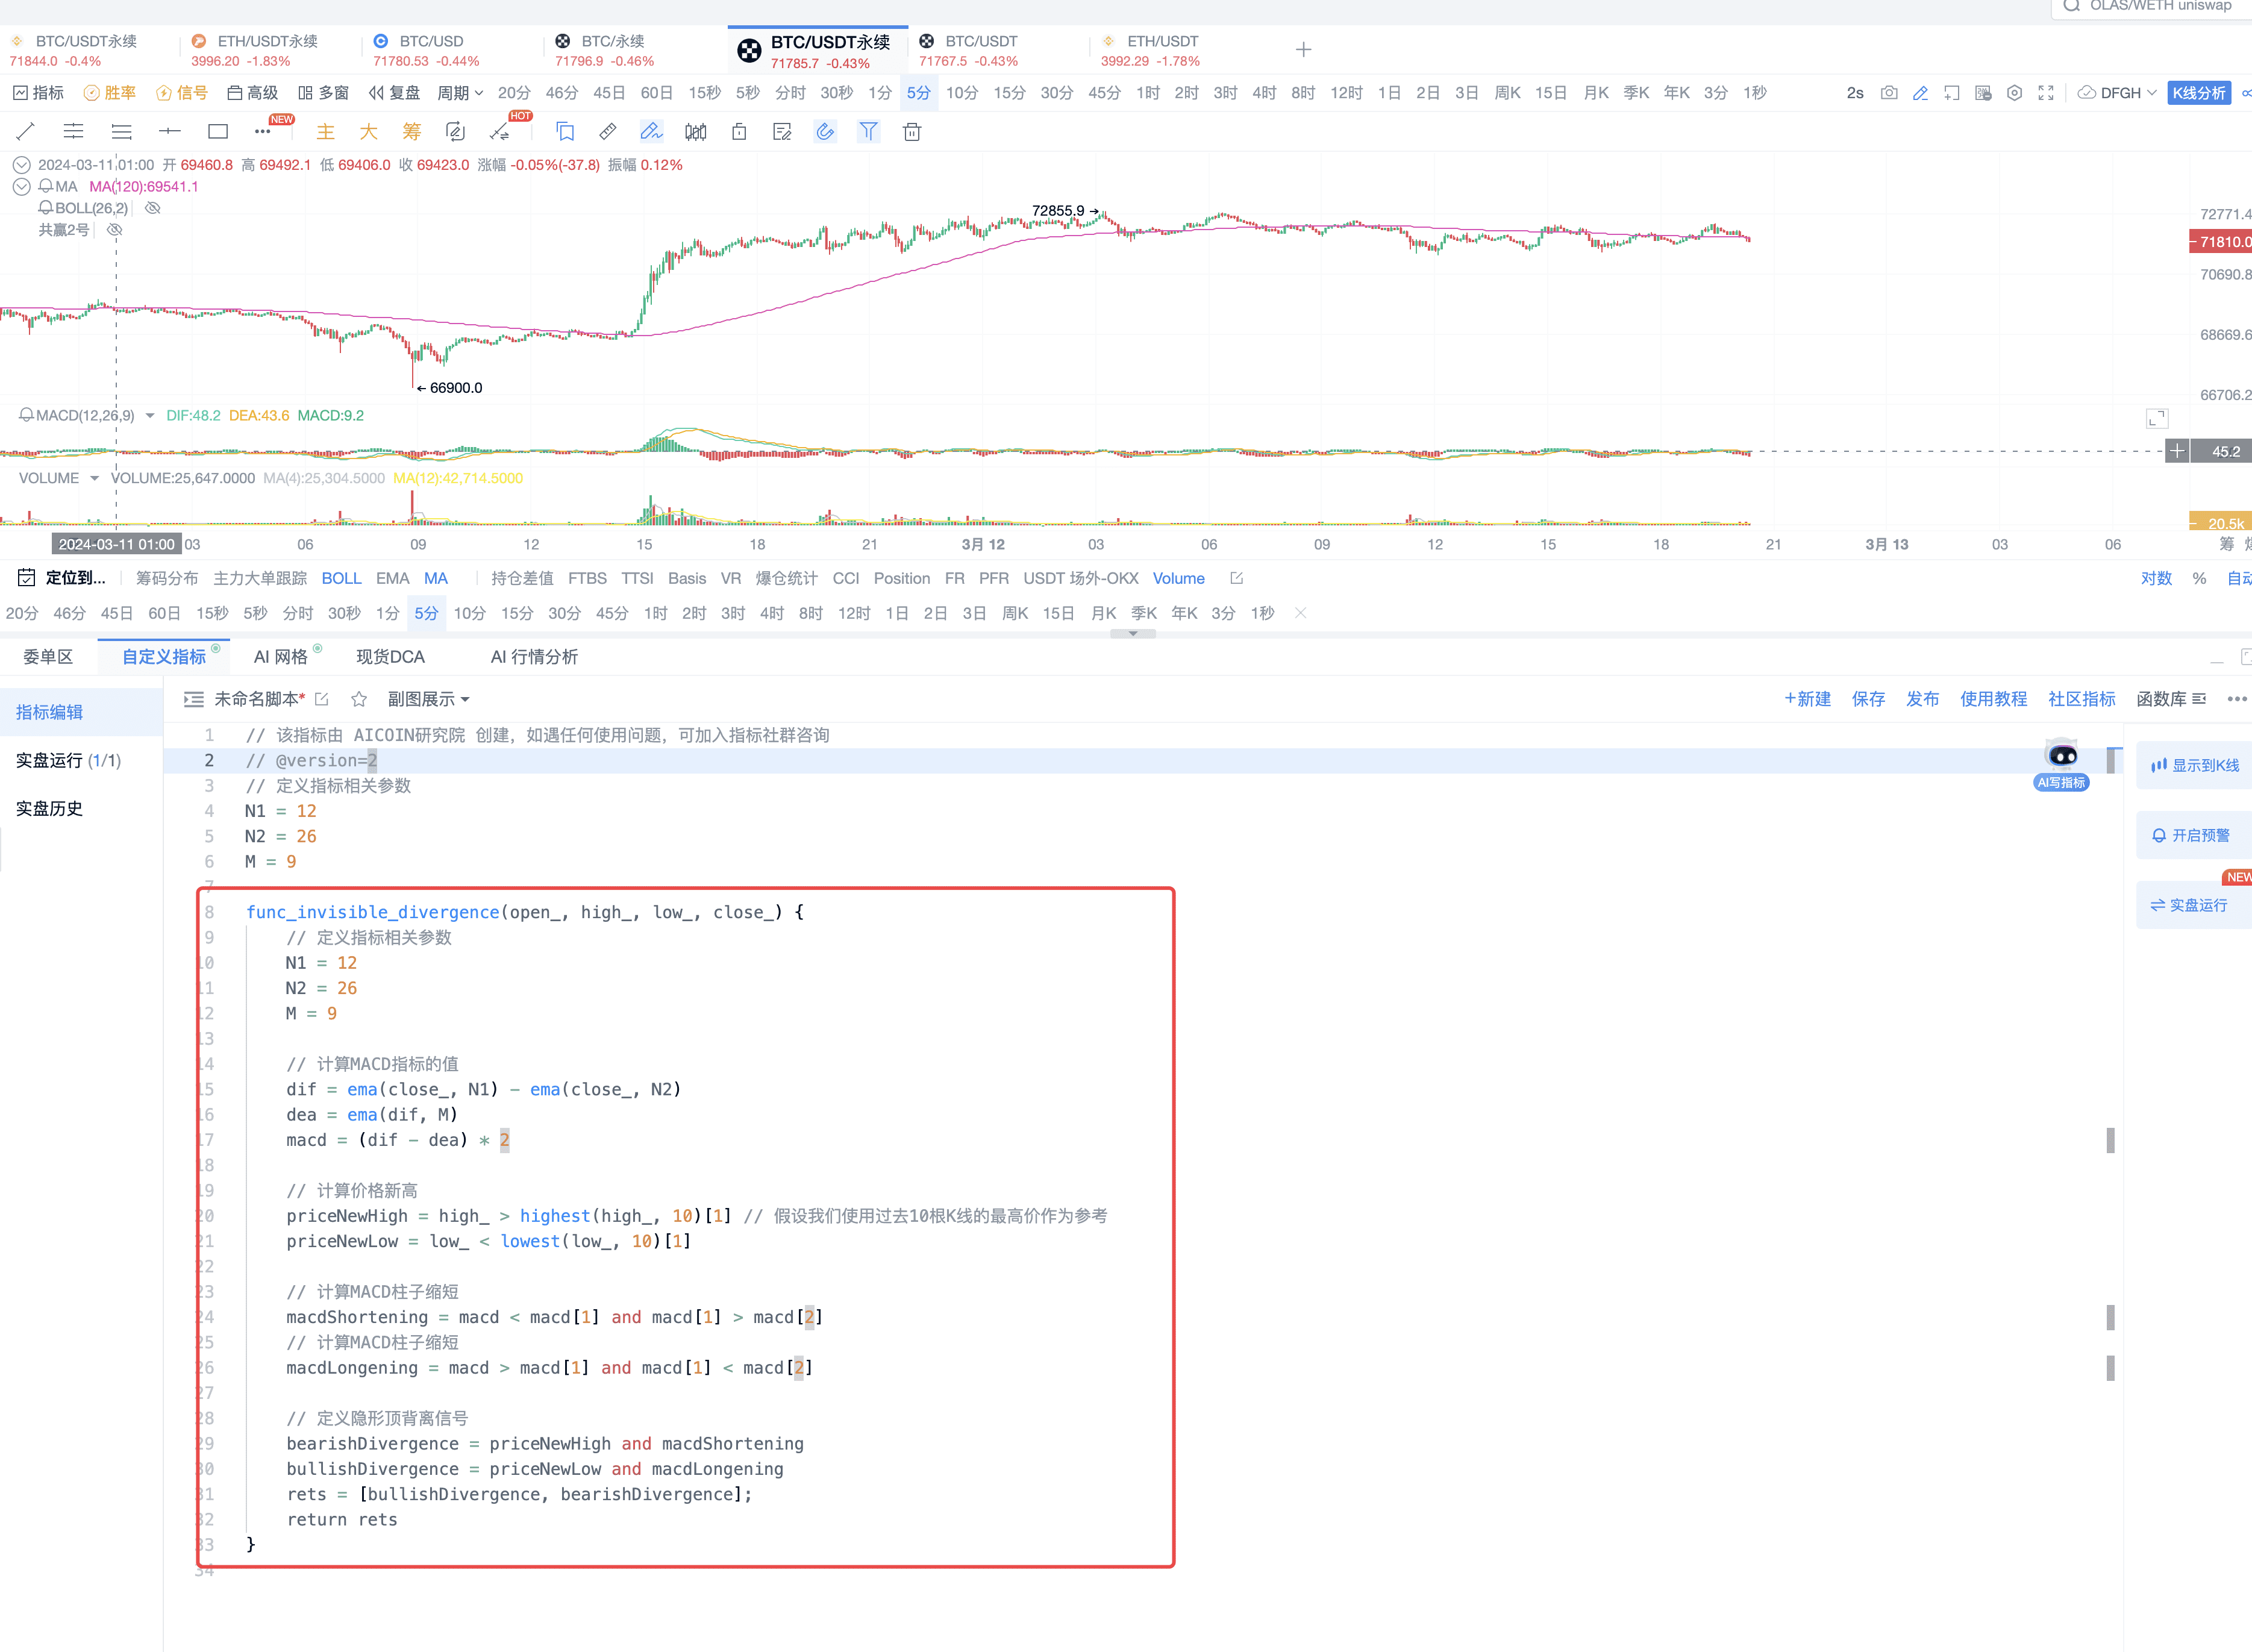
The most core algorithm of divergence, using this function, can achieve the divergence judgment of MACD.
   func_invisible_divergence(open_, high_, low_, close_) {
       // Define indicator-related parameters
       N1 = 12
       N2 = 26
       M = 9
       // Calculate the value of the MACD indicator
       dif = ema(close_, N1) - ema(close_, N2)
       dea = ema(dif, M)
       macd = (dif - dea) * 2
       // Calculate the new high of the price
       priceNewHigh = high_ > highest(high_, 10)[1] // Assuming we use the highest price of the past 10 candles as a reference
       priceNewLow = low_ < lowest(low_, 10)[1]
       // Calculate the shortening of the MACD column
       macdShortening = macd < macd[1] and macd[1] > macd[2]
       // Calculate the lengthening of the MACD column
       macdLongening = macd > macd[1] and macd[1] < macd[2]
       // Define hidden top divergence signals
       bearishDivergence = priceNewHigh and macdShortening
       bullishDivergence = priceNewLow and macdLongening
       rets = [bullishDivergence, bearishDivergence]
       return rets
   }
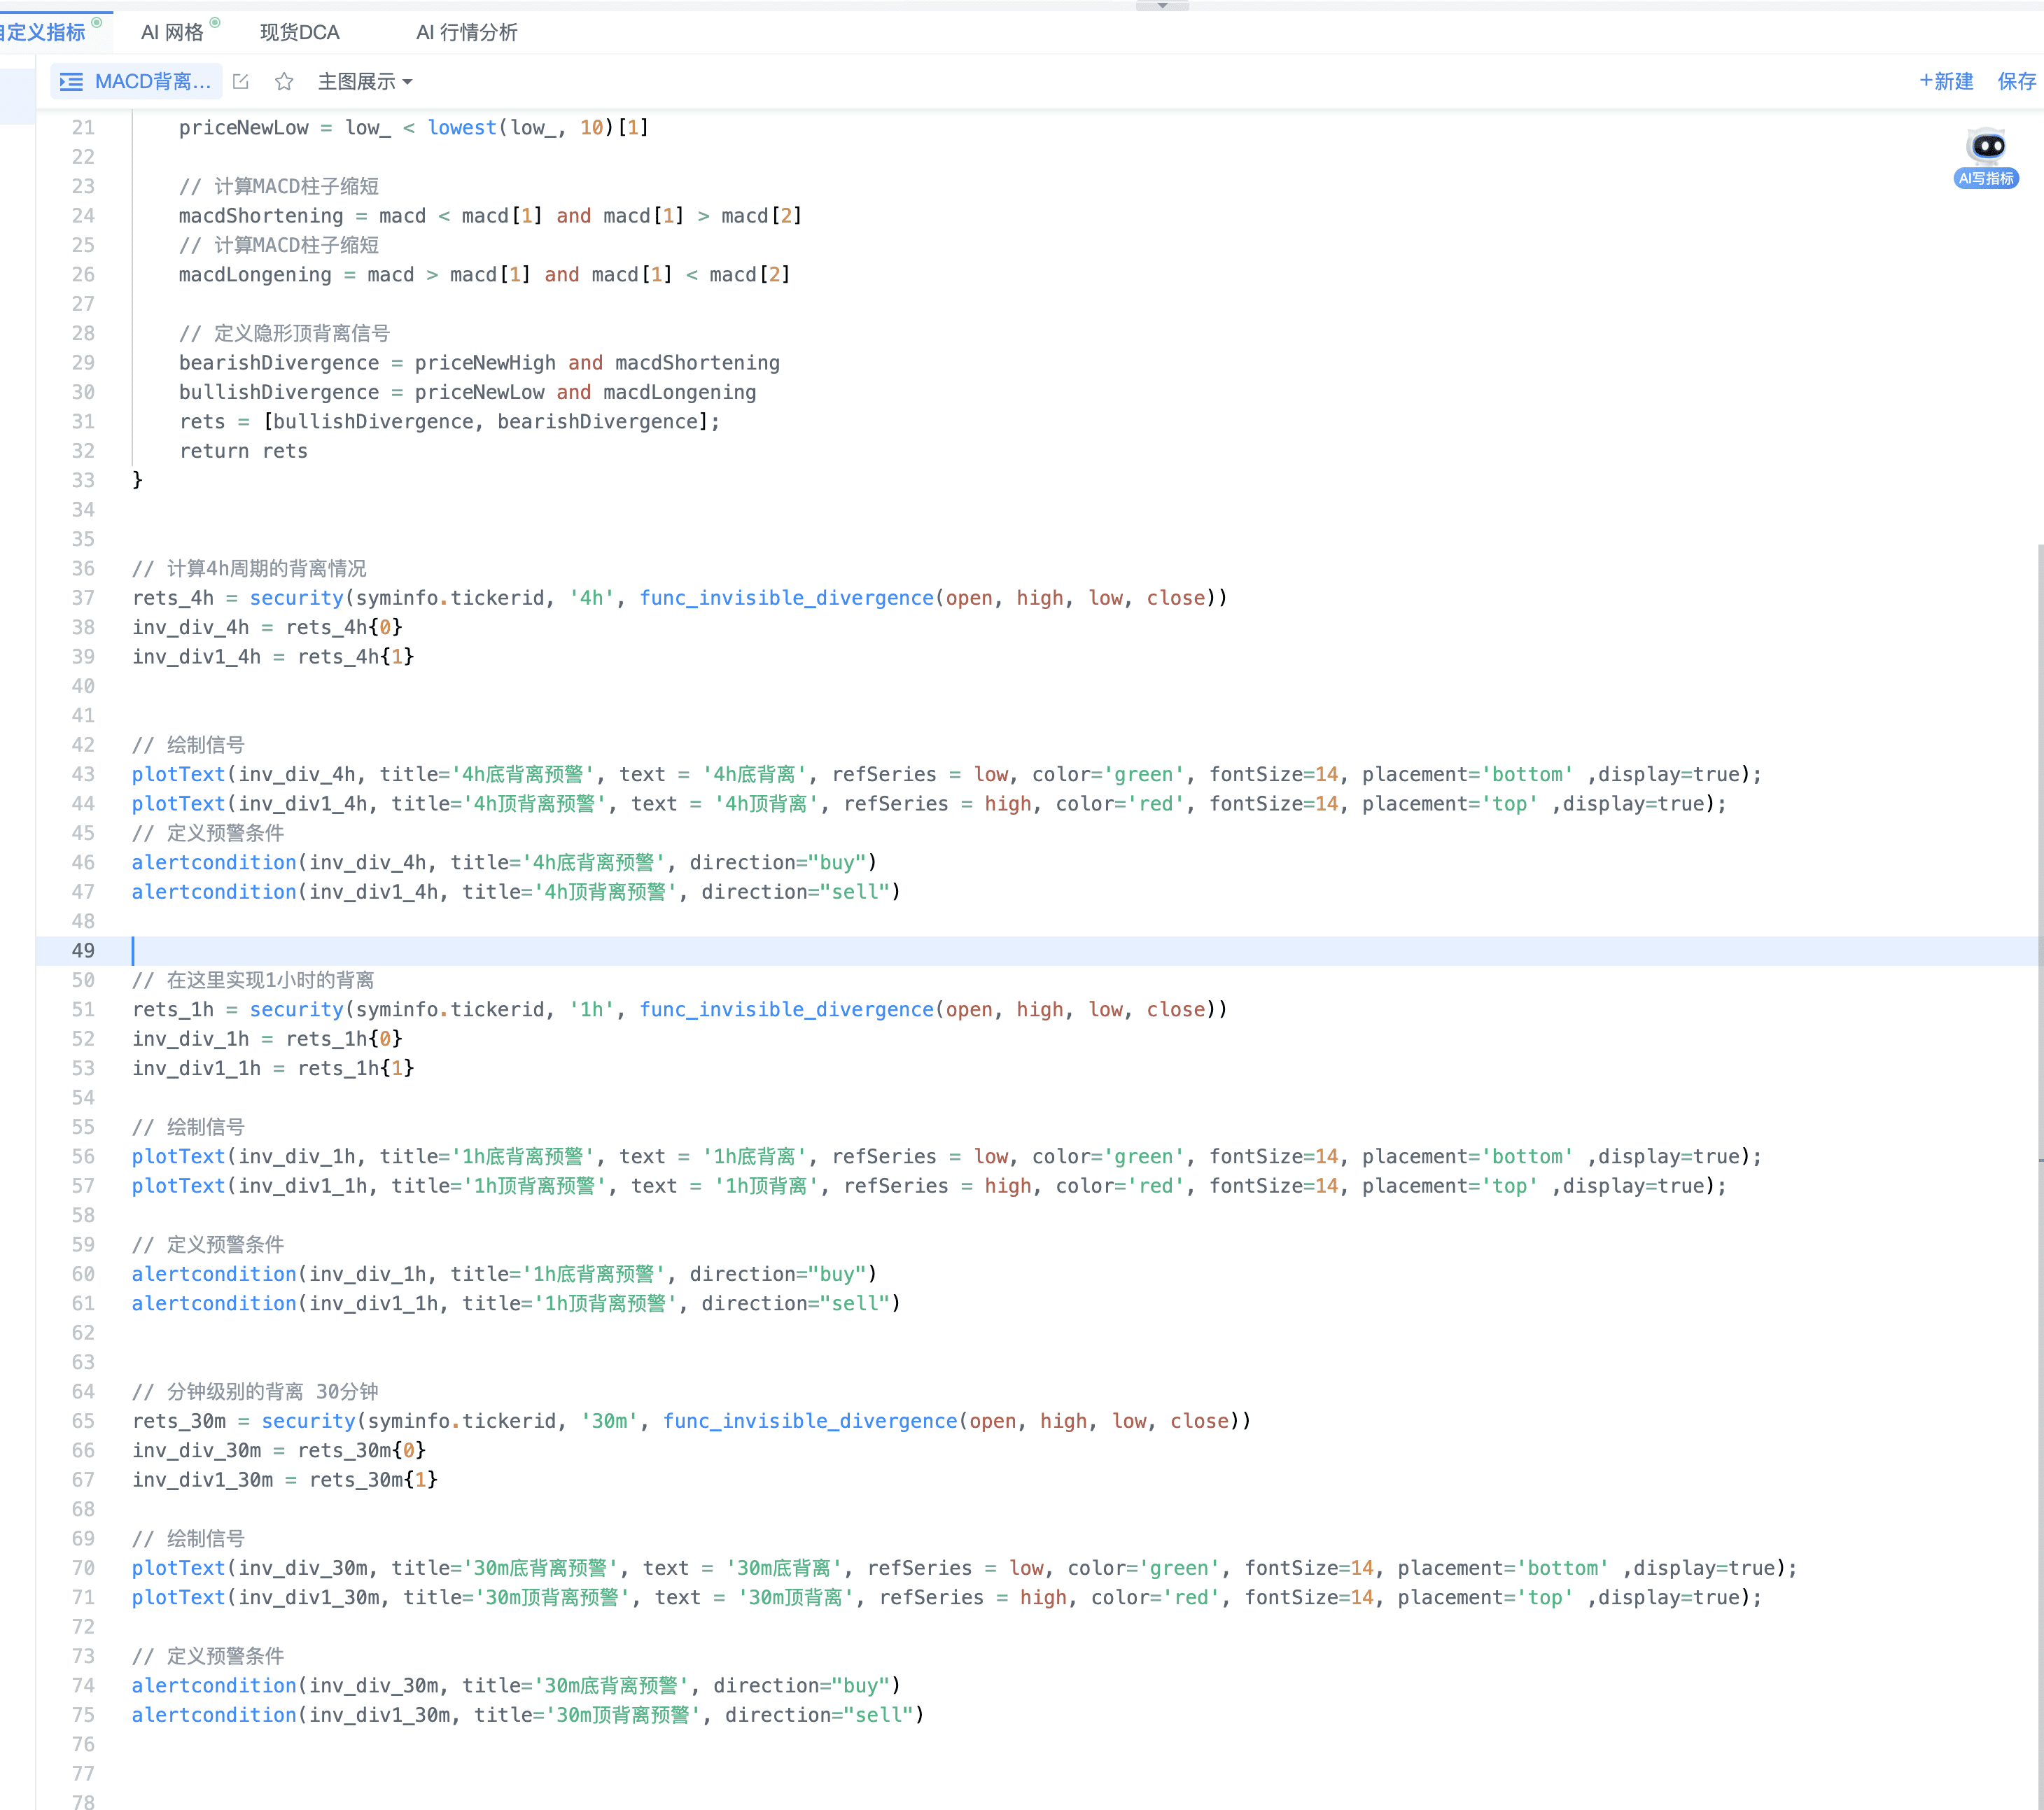
Specific settings of the indicator script for BTC 4-hour divergence
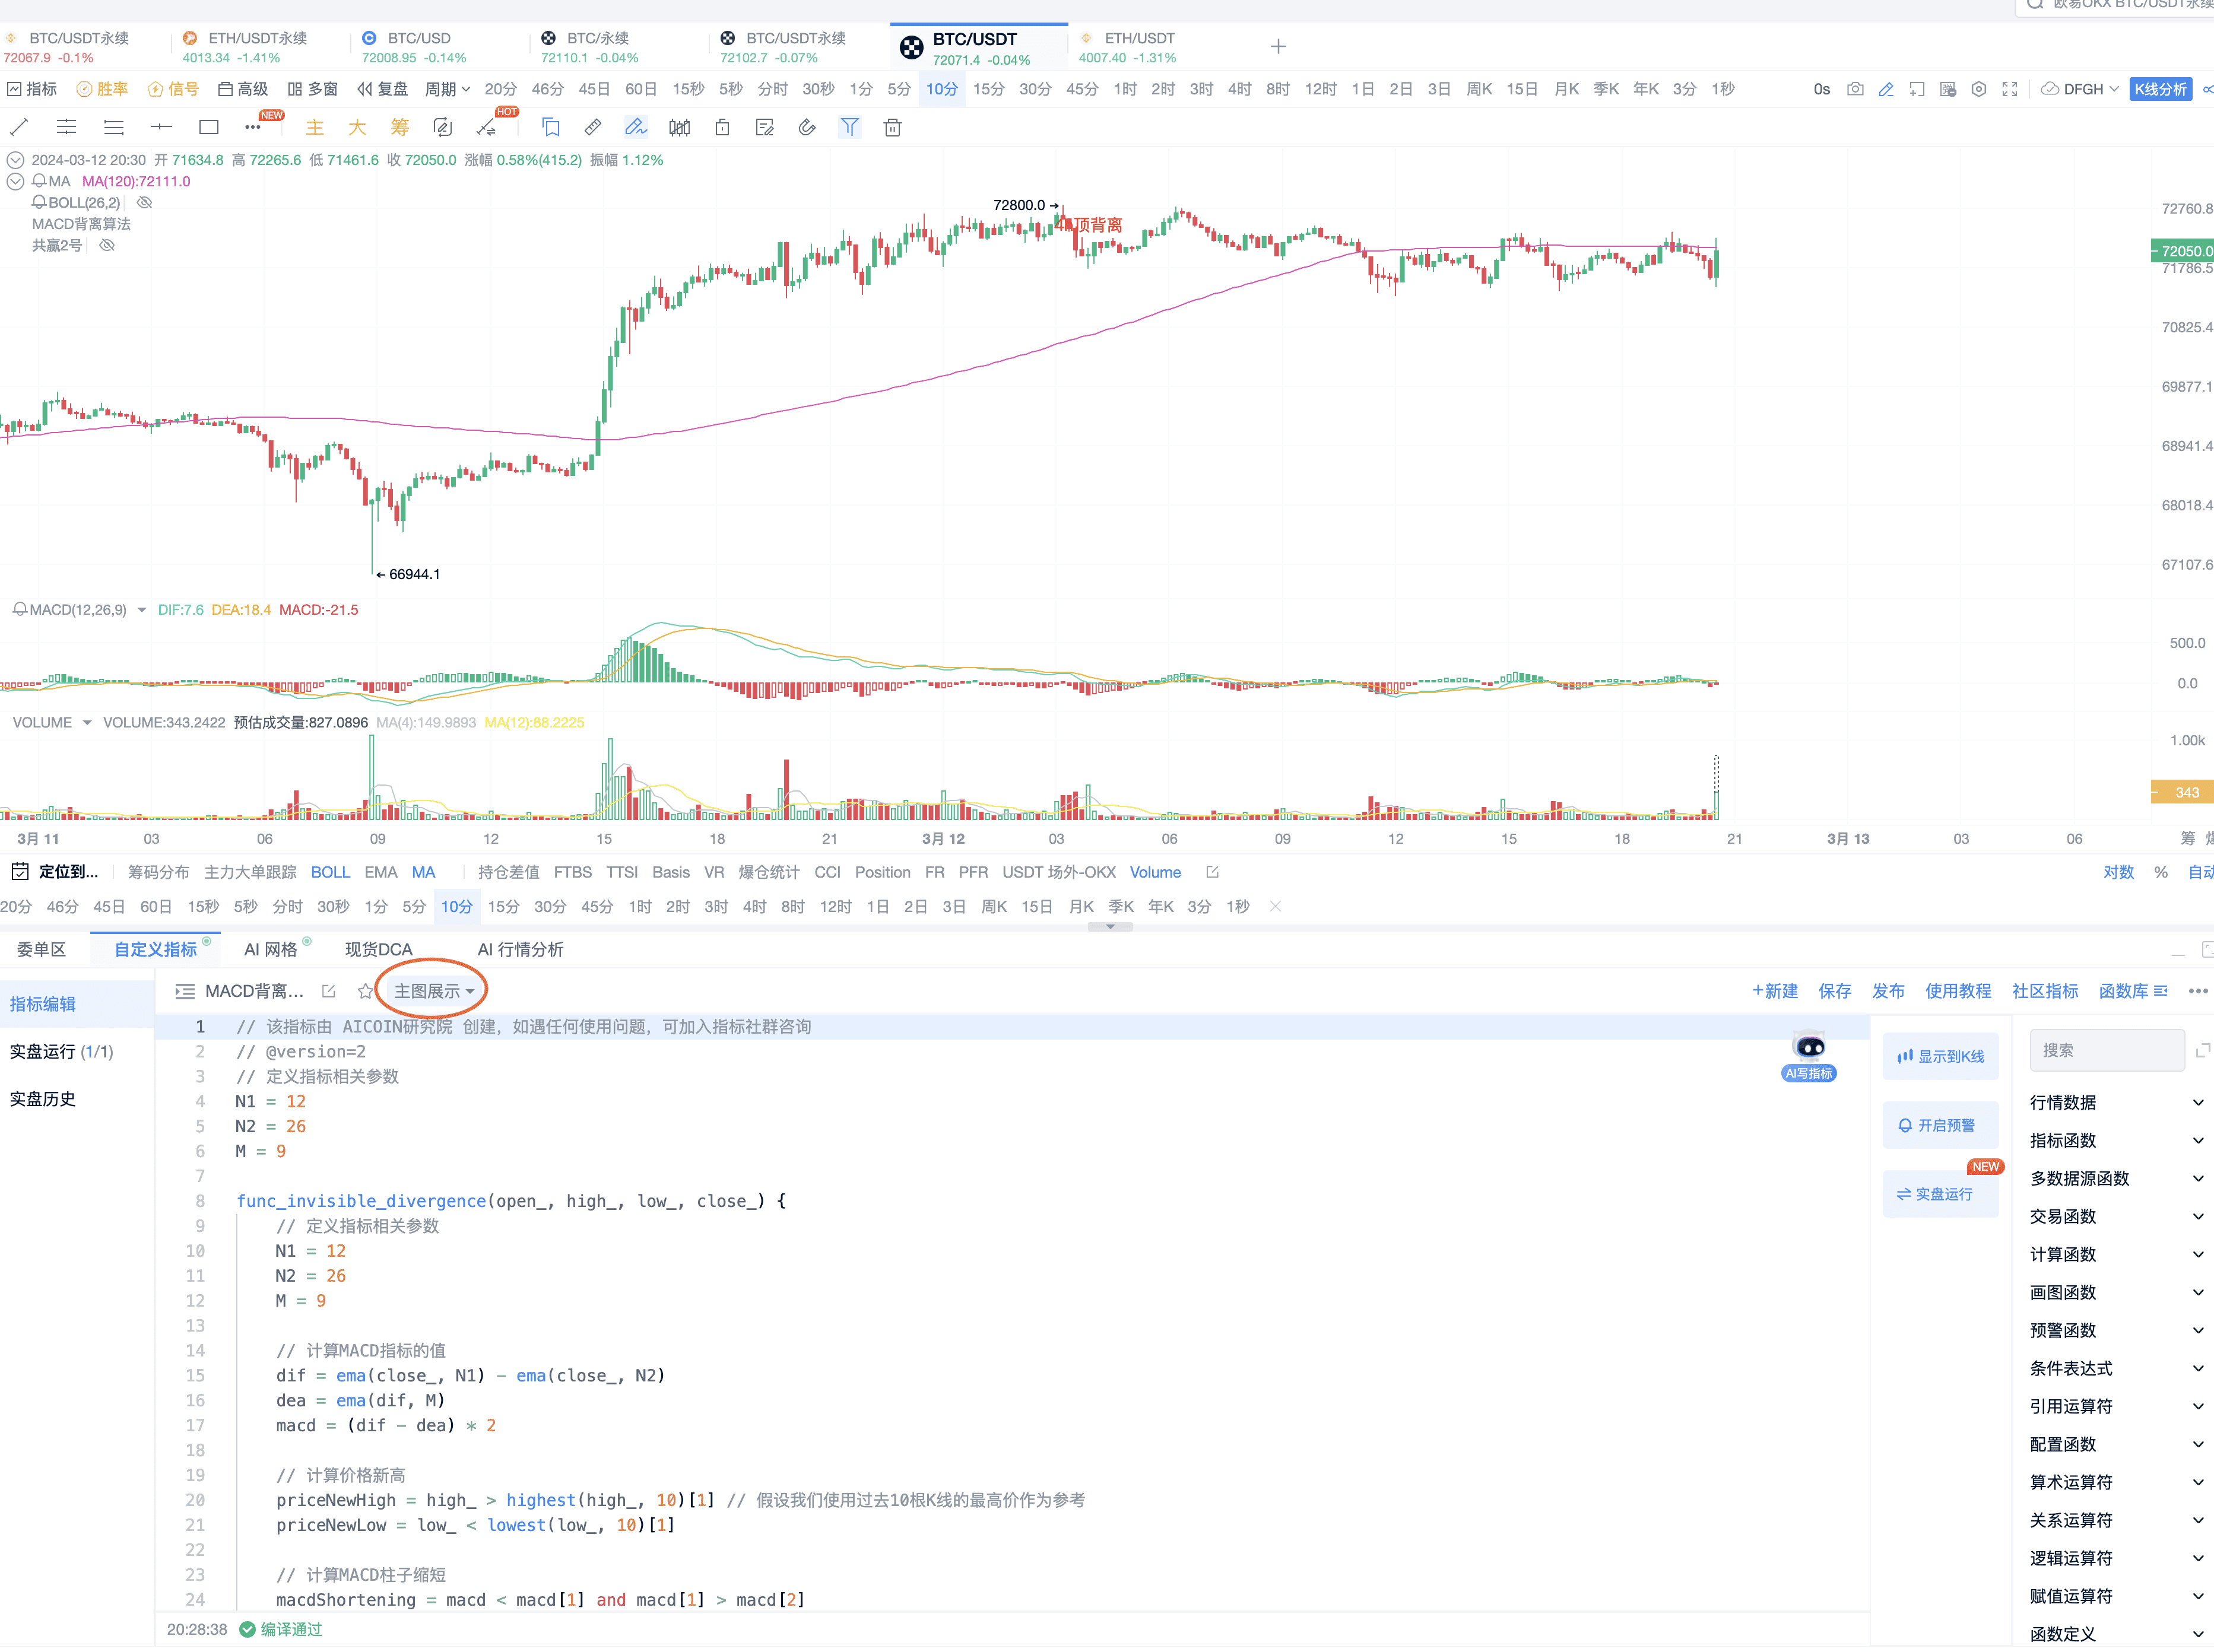
Step 1: Find the custom indicator
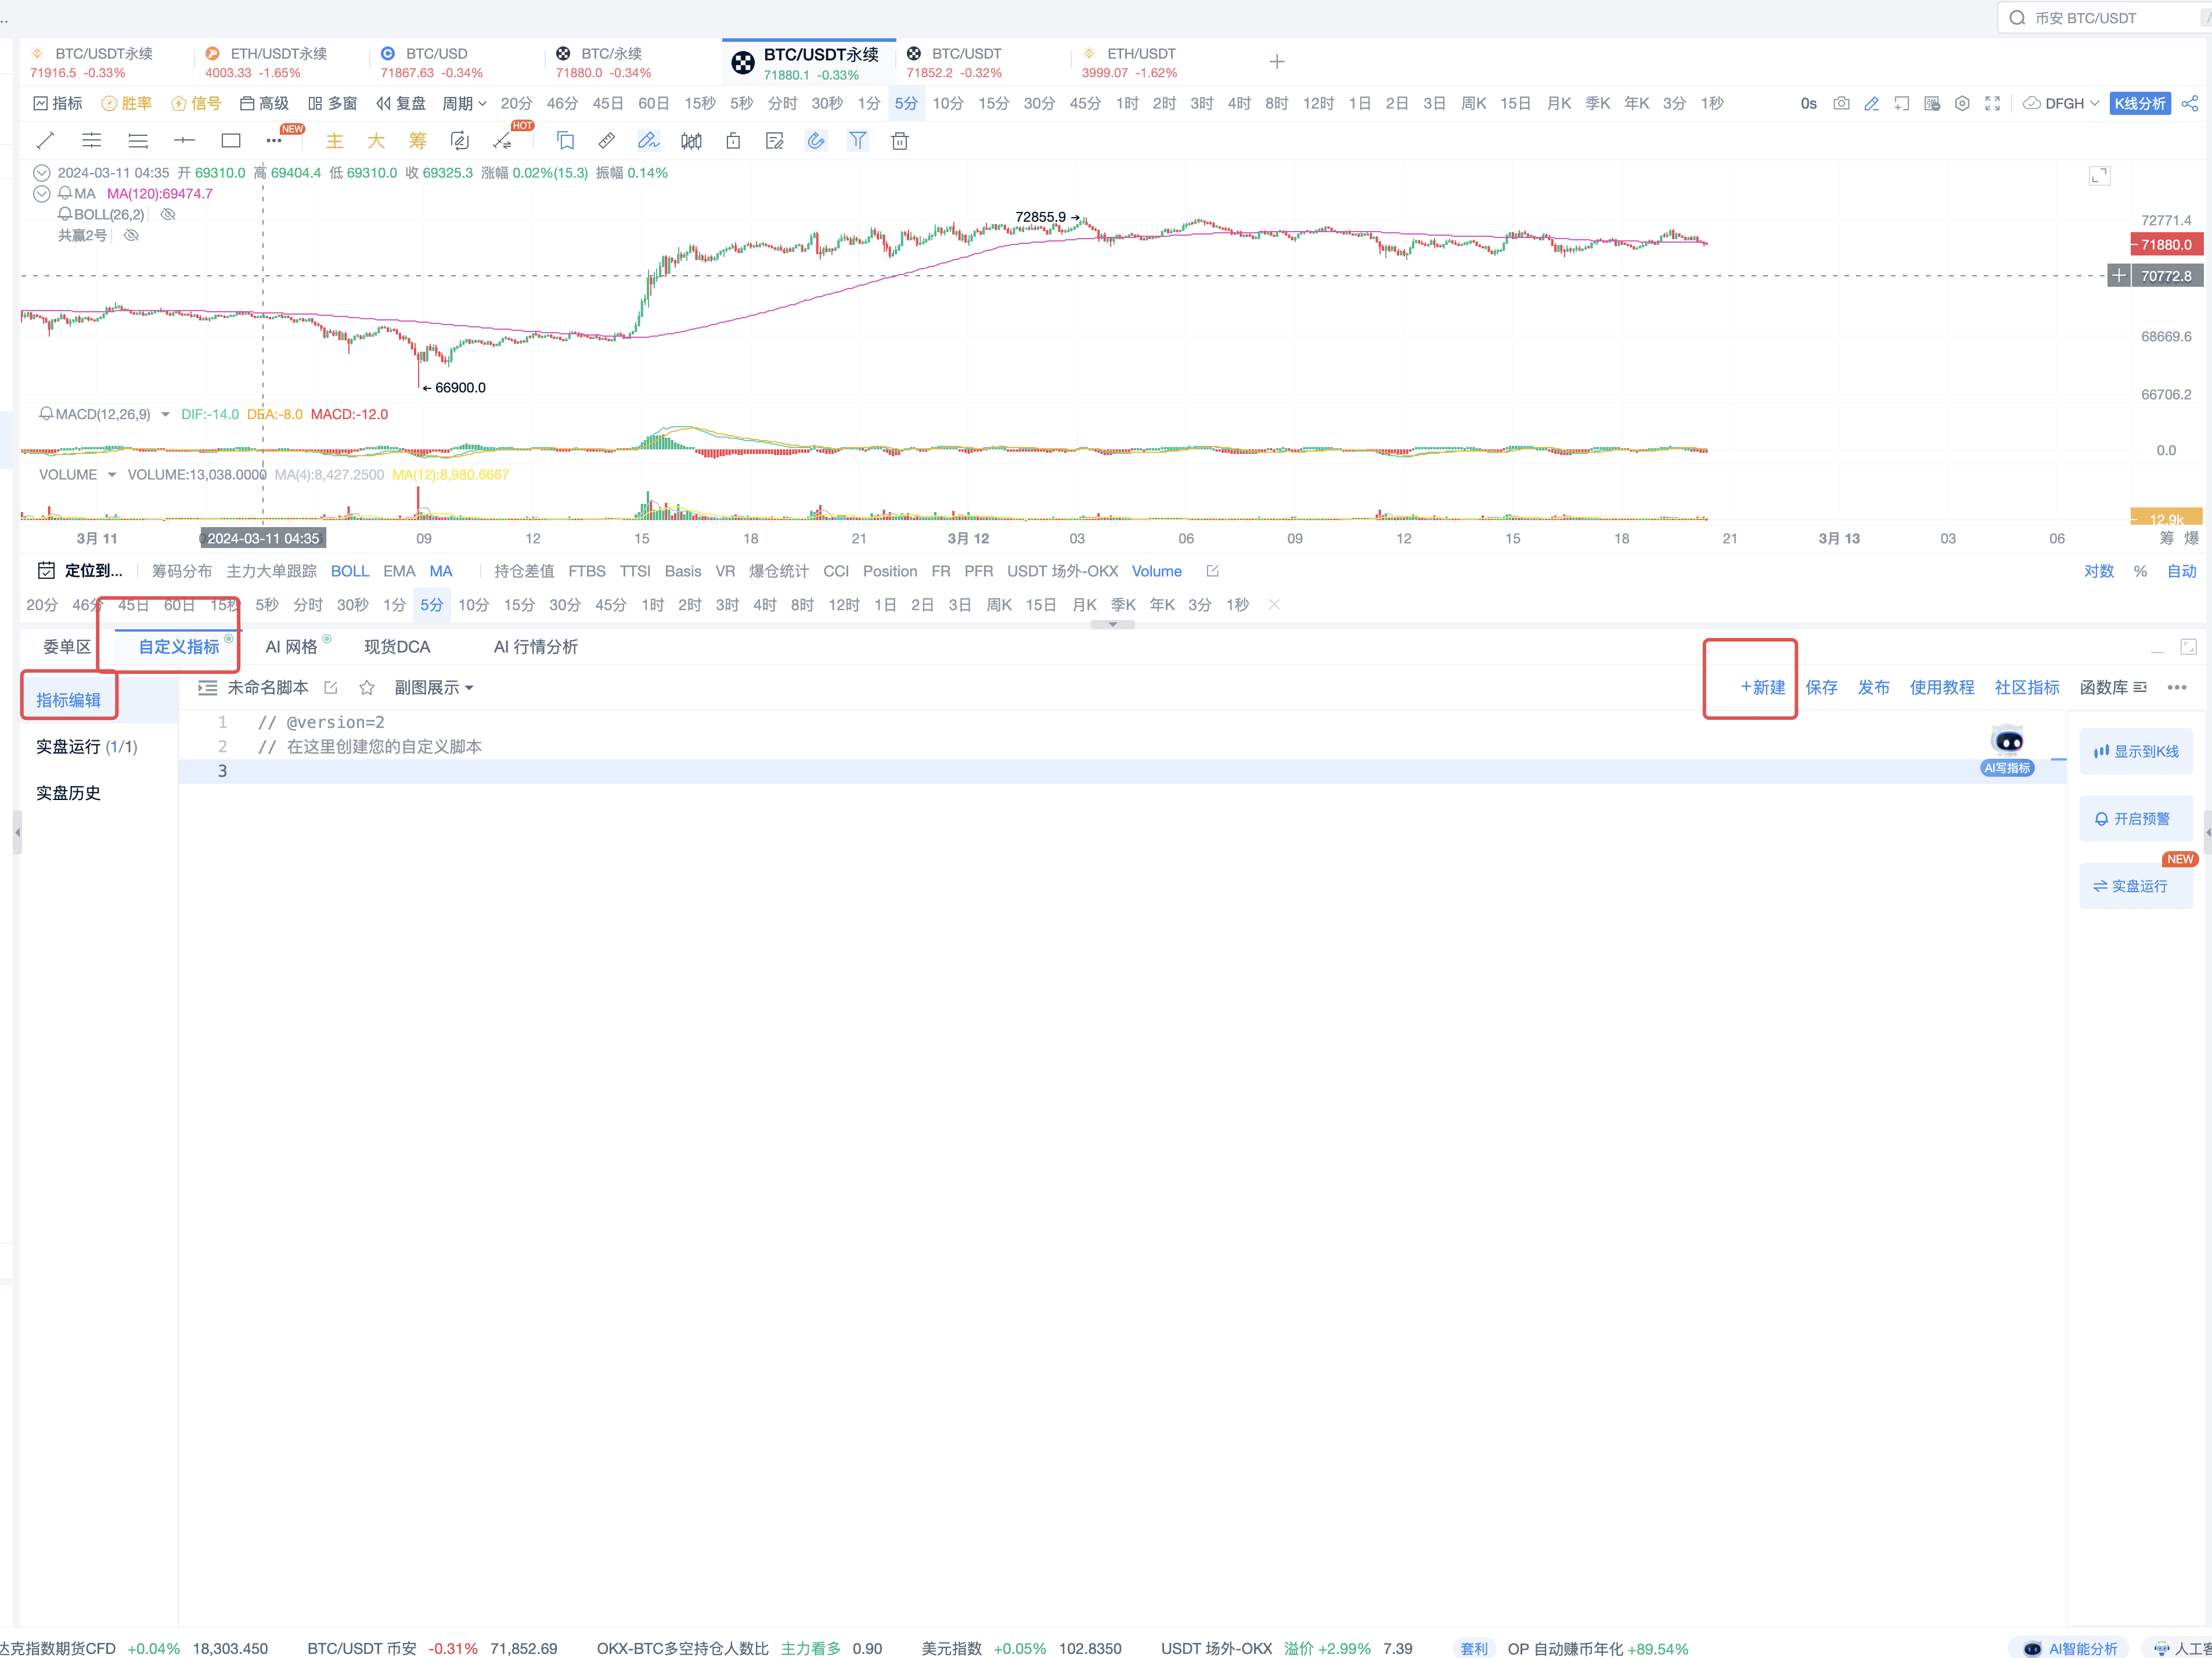
Start a new script and put the core divergence indicator implementation algorithm in it
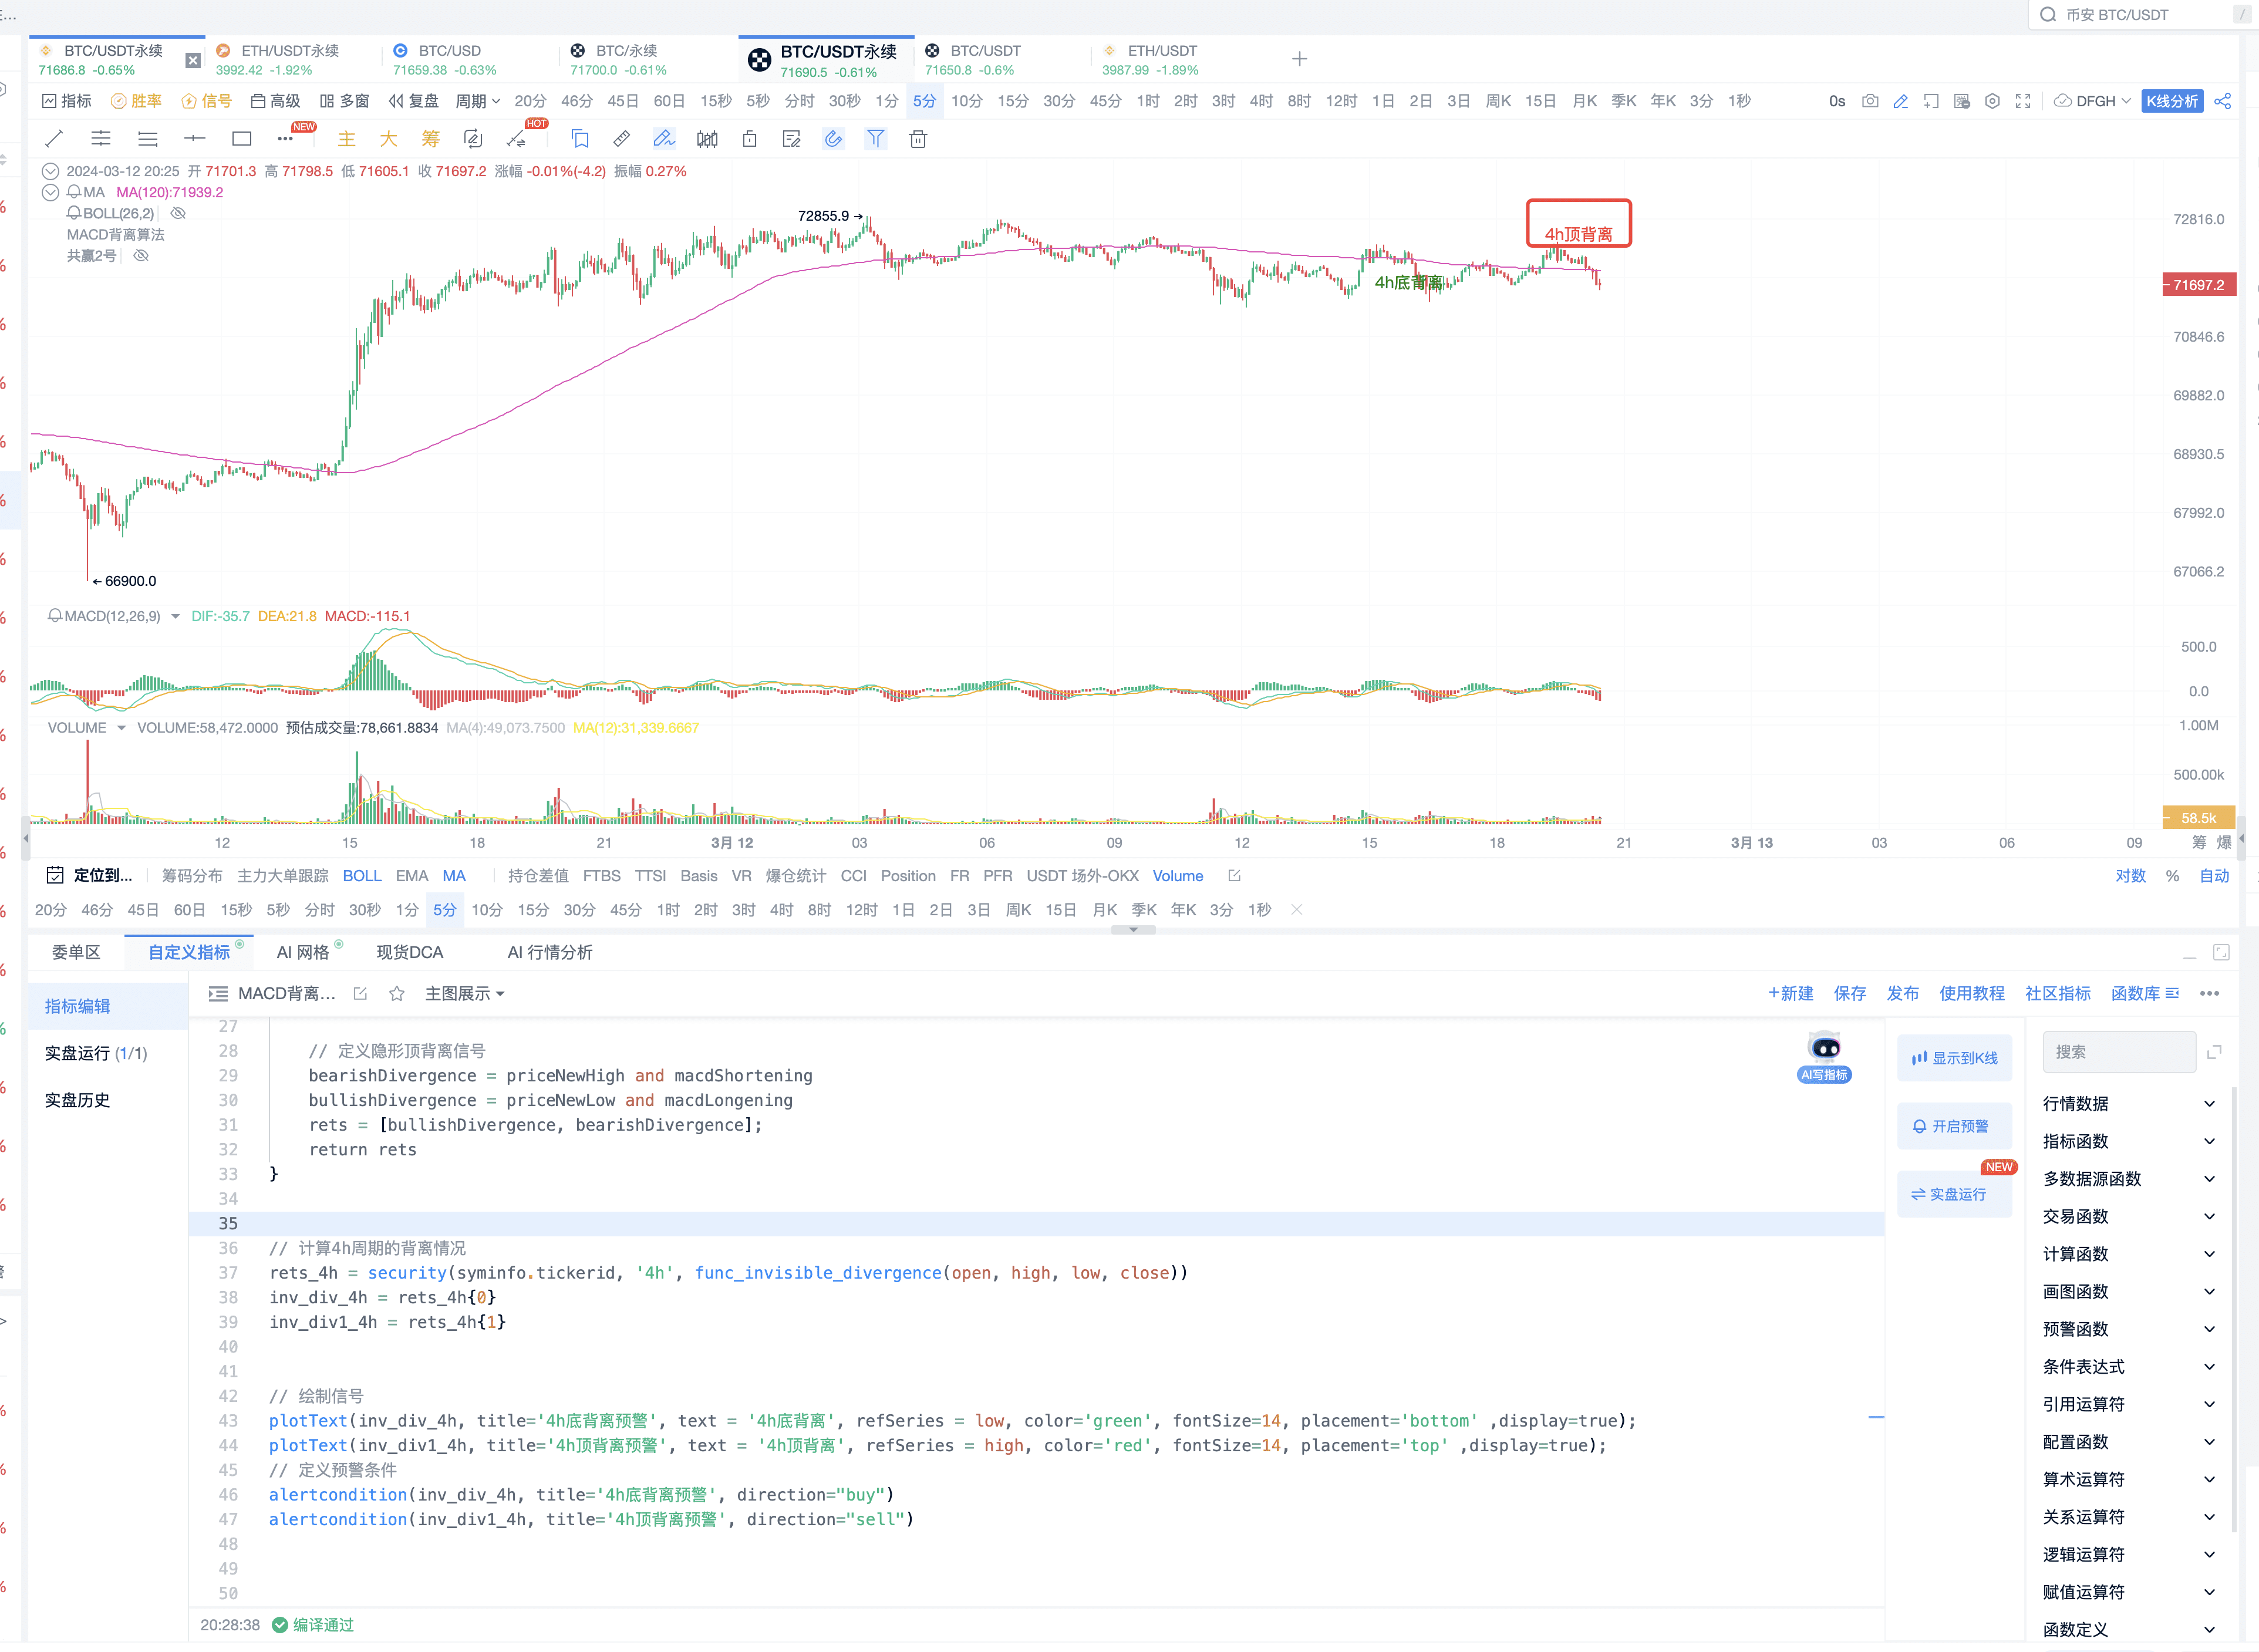
Step 2: The core code we use calls the 4-hour data
   // Calculate the divergence situation of the 4-hour period
   rets_4h = security(syminfo.tickerid, '4h', func_invisible_divergence(open, high, low, close))
   inv_div_4h = rets_4h{0}
   inv_div1_4h = rets_4h{1}
Step 3: We draw it on the main chart
   // Draw the signal
   plotText(inv_div_4h, title='4h Bottom Divergence Warning', text = '4h Bottom Divergence', refSeries = low, color='green', fontSize=14, placement='bottom' ,display=true);
   plotText(inv_div1_4h, title='4h Top Divergence Warning', text = '4h Top Divergence', refSeries = high, color='red', fontSize=14, placement='top' ,display=true);
Step 4: We set the alert conditions
   // Define alert conditions
   alertcondition(inv_div_4h, title='4h Bottom Divergence Warning', direction="buy")
   alertcondition(inv_div1_4h, title='4h Top Divergence Warning', direction="sell")
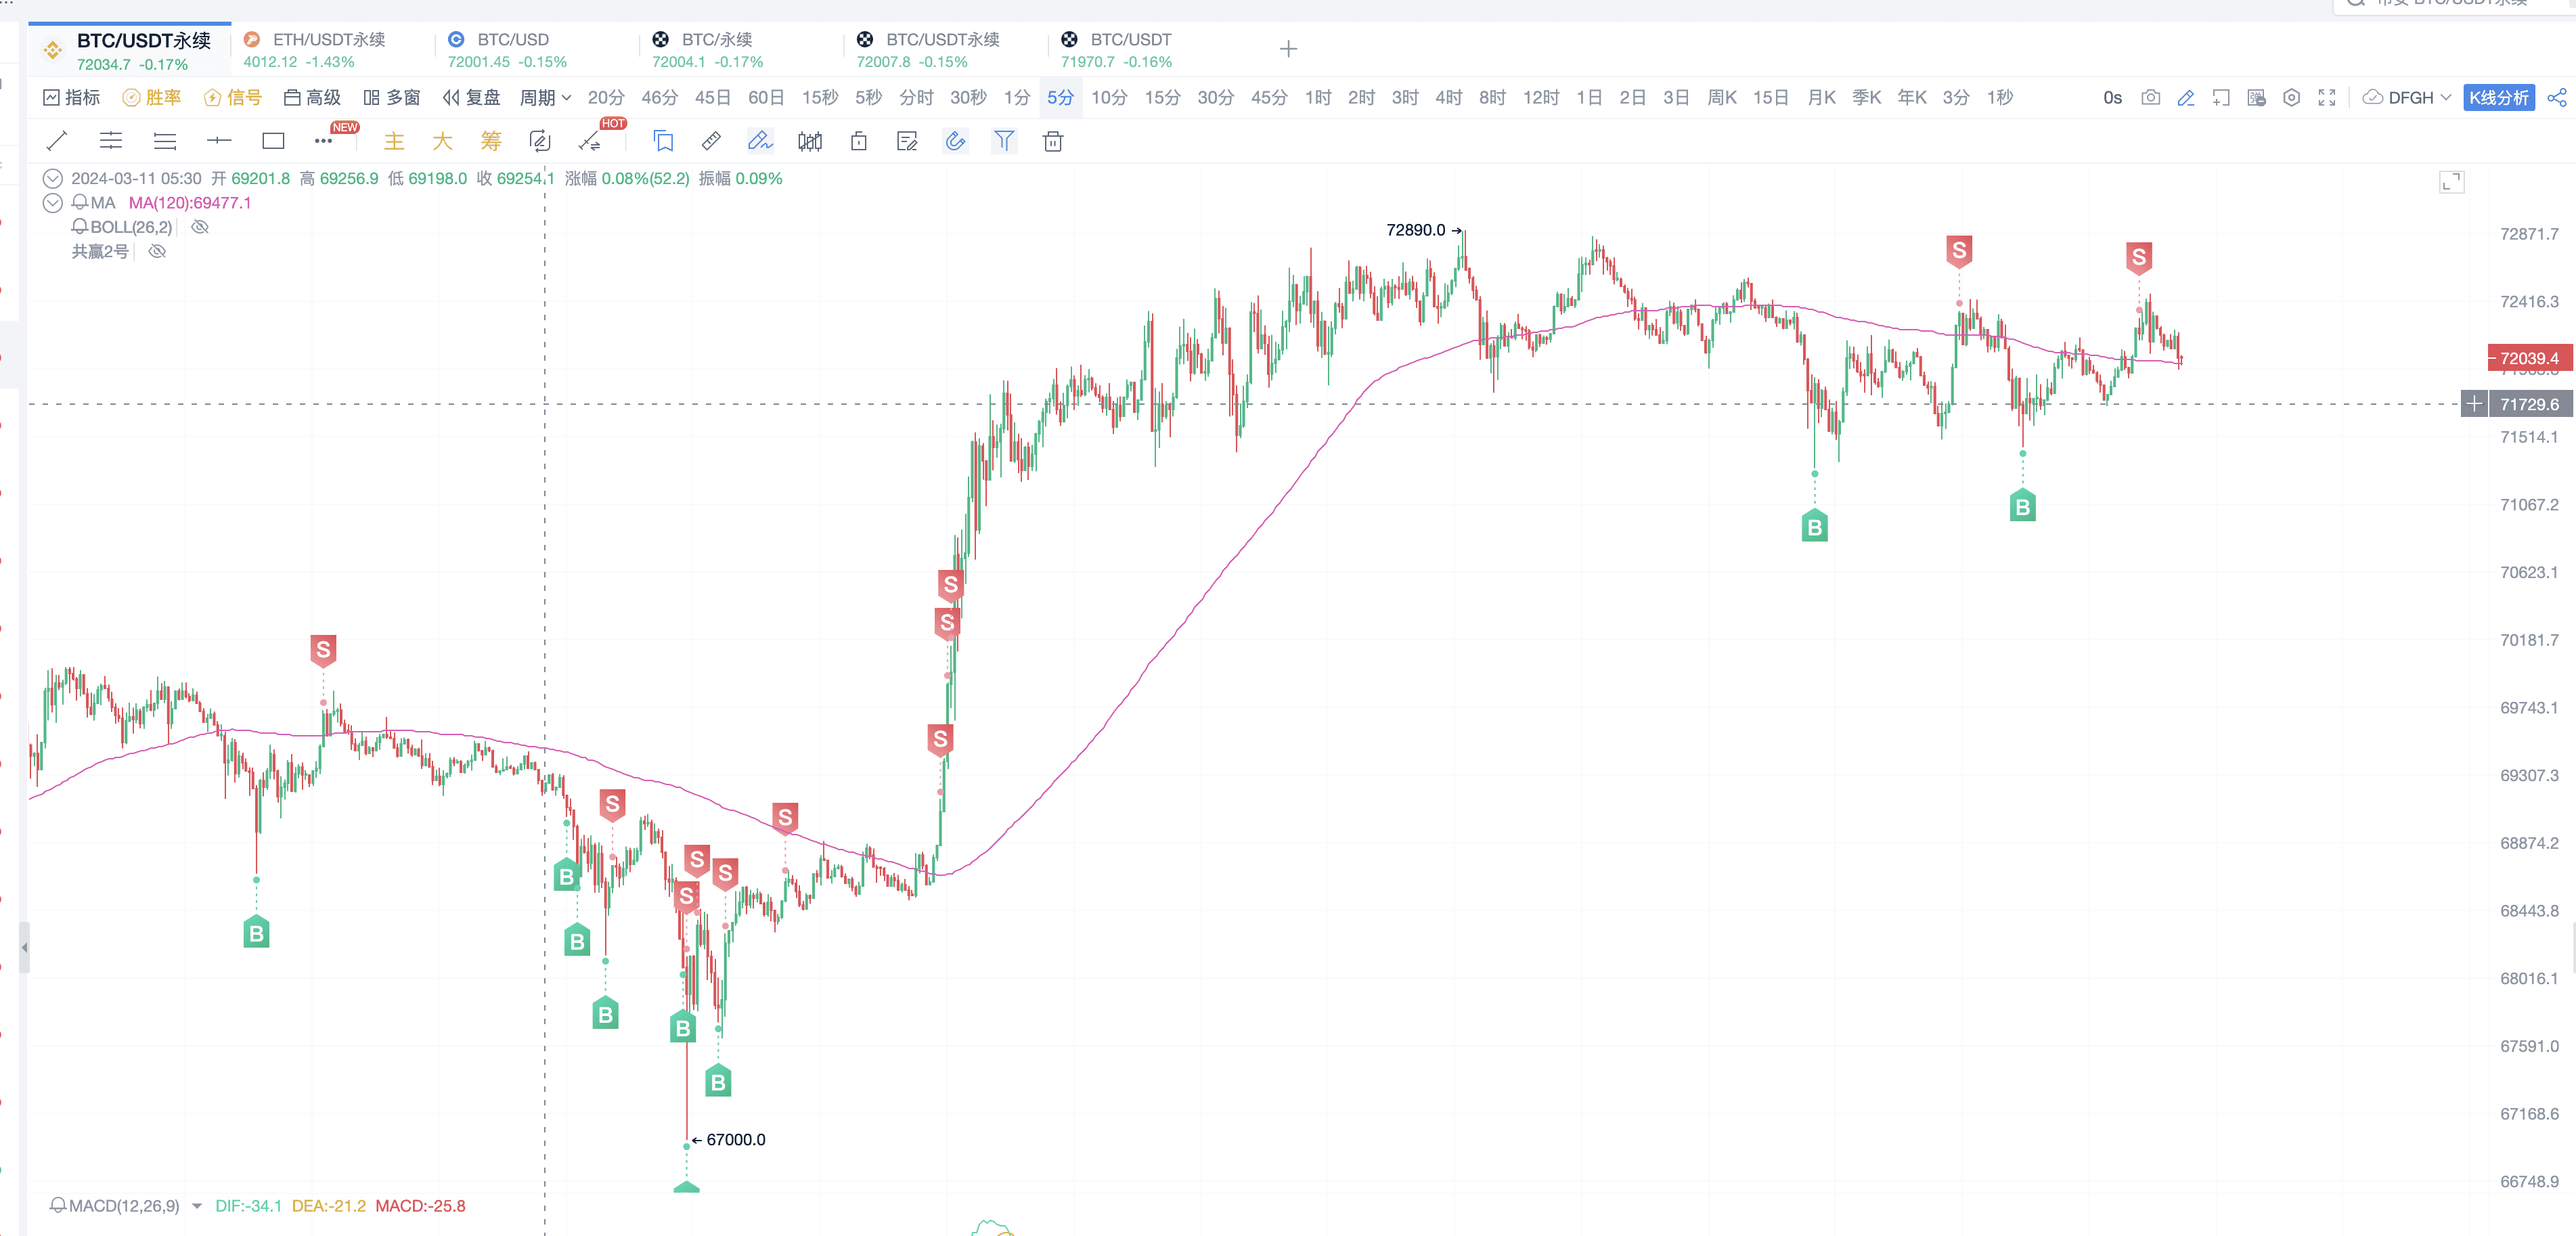
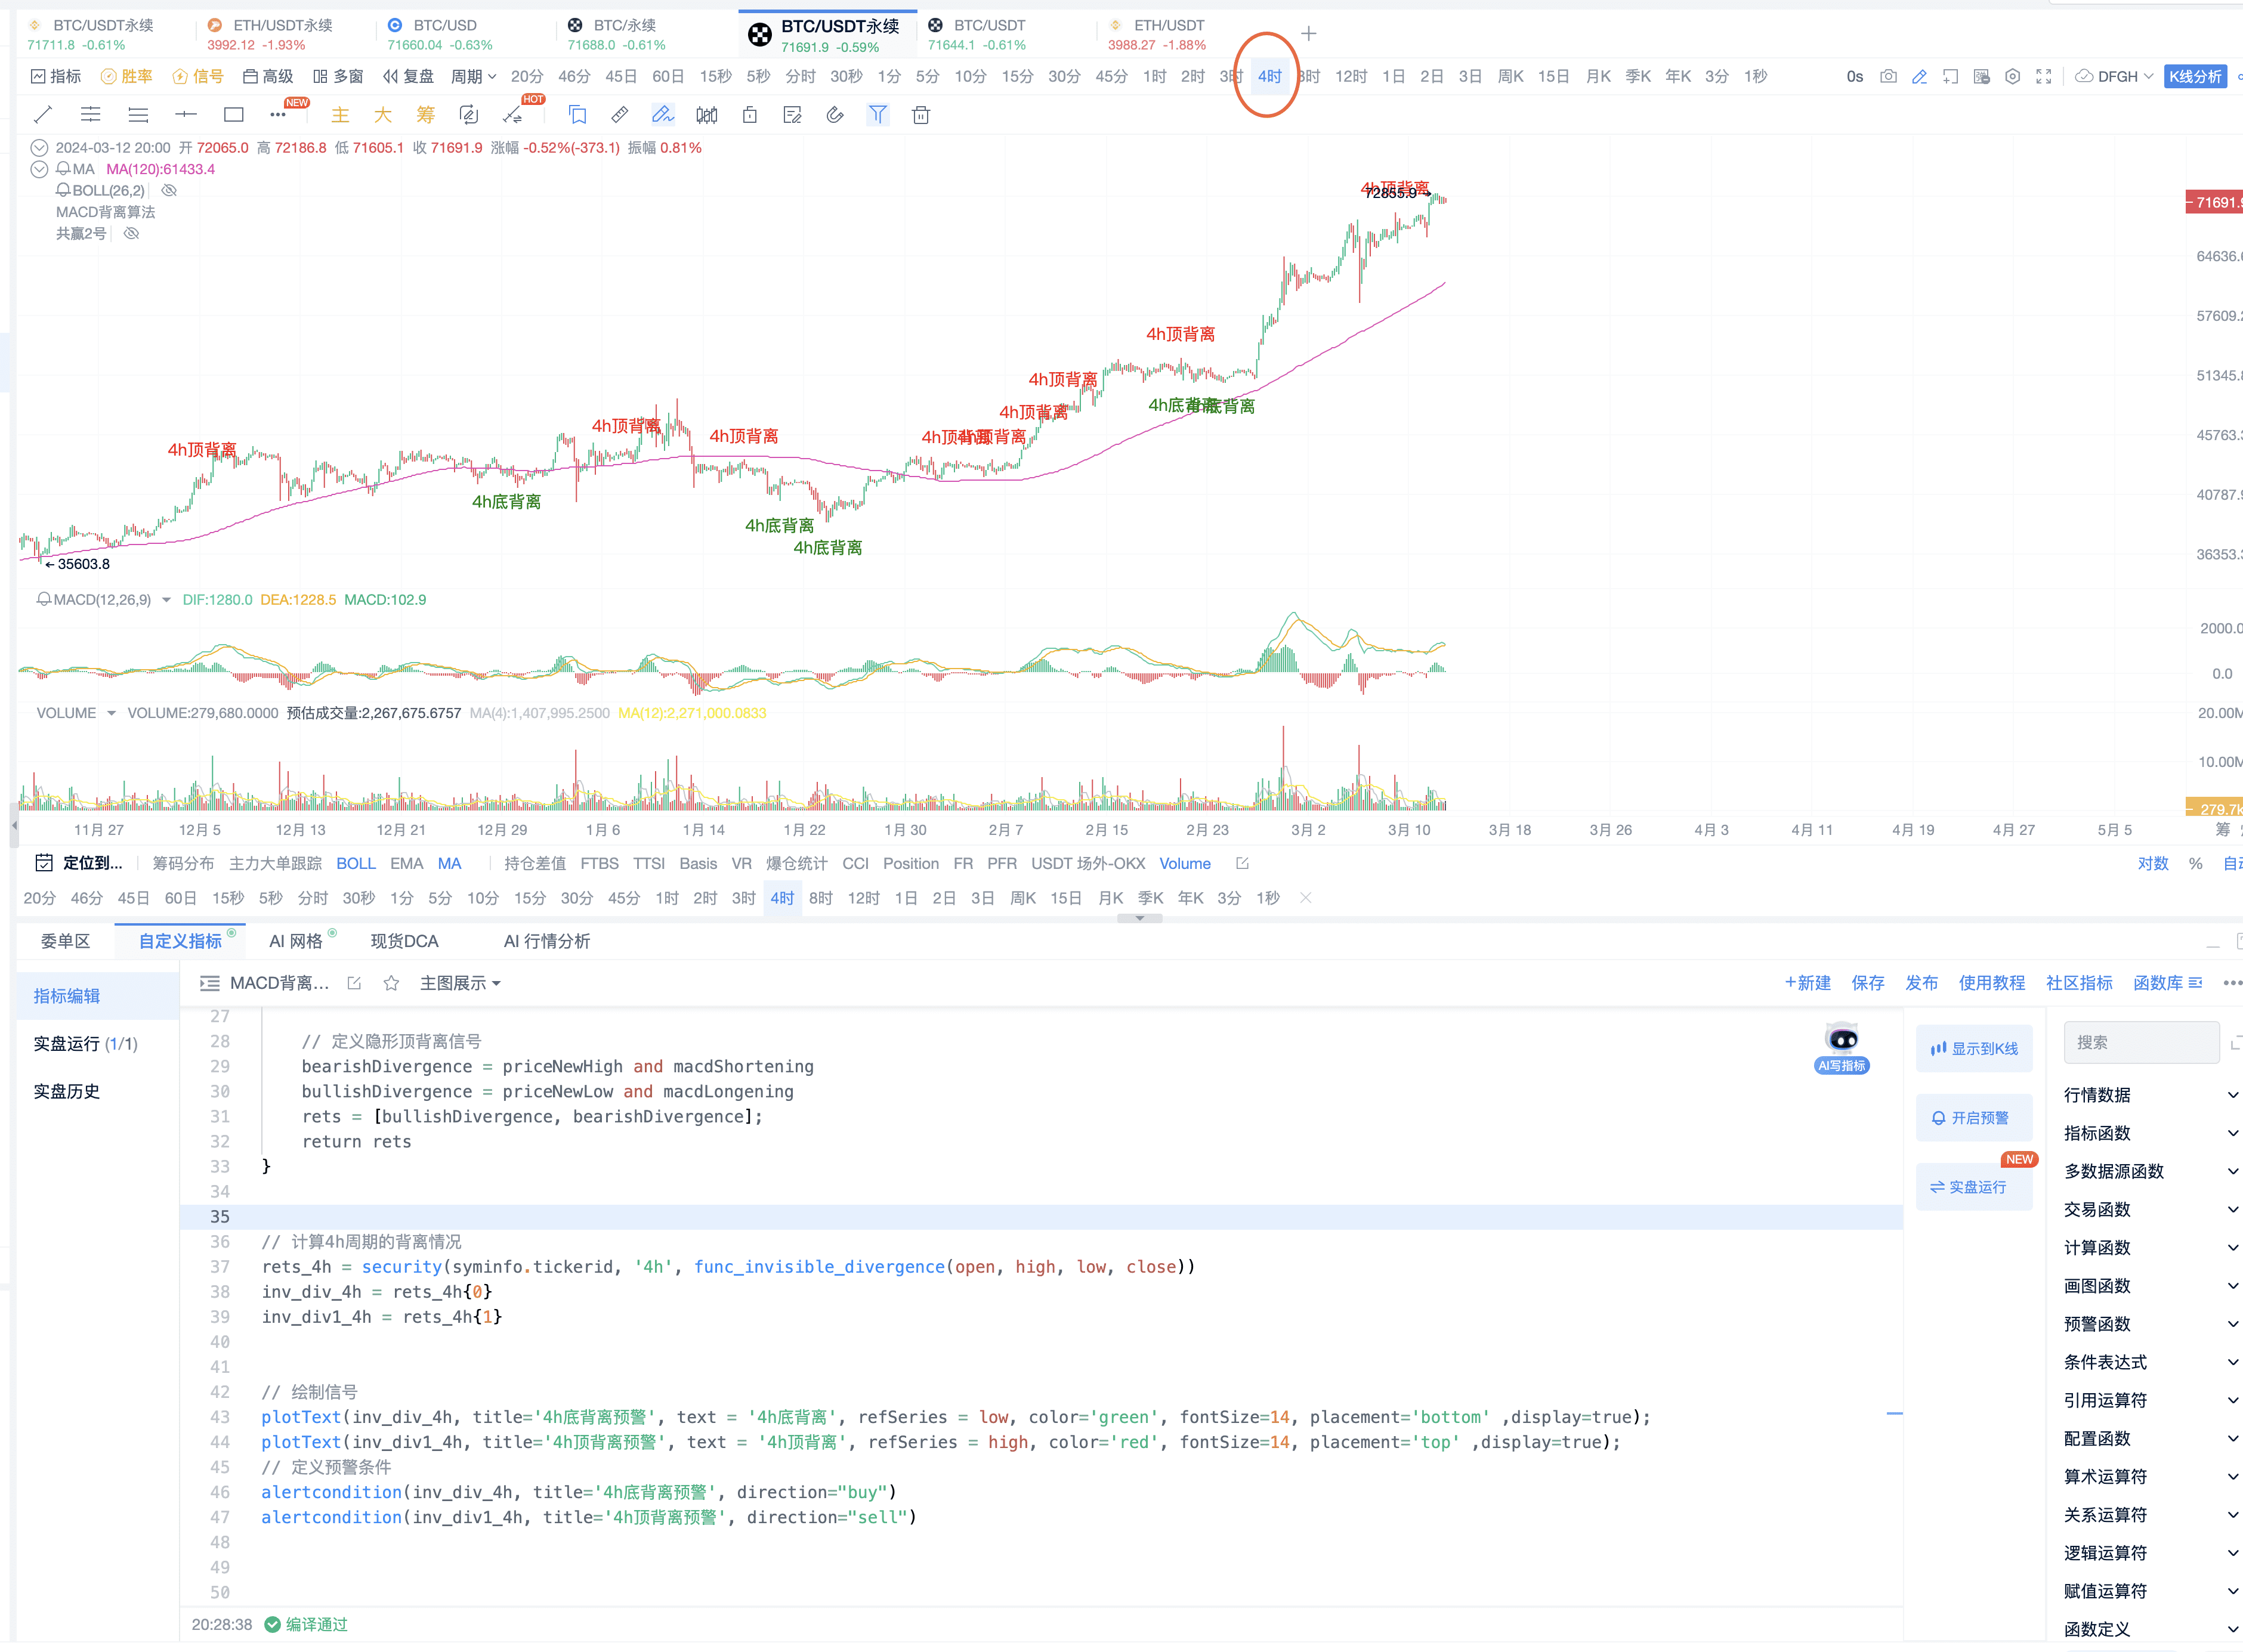
Step 5: Display effect on the K-line
You can switch to the 4-hour period for more signals
Step 6: Complete code
   // This indicator is created by AICOIN Research Institute. If you encounter any usage issues, you can join the indicator community for consultation
   // @version=2
   // Define indicator-related parameters
   N1 = 12
   N2 = 26
   M = 9
   func_invisible_divergence(open_, high_, low_, close_) {
       // Define indicator-related parameters
       N1 = 12
   }
N2 = 26
M = 9
// Calculate the value of the MACD indicator
dif = ema(close, N1) - ema(close, N2)
dea = ema(dif, M)
macd = (dif - dea) * 2
// Calculate the new high of the price
priceNewHigh = high_ > highest(high_, 10)[1] // Assuming we use the highest price of the past 10 candles as a reference
priceNewLow = low_ < lowest(low_, 10)[1]
// Calculate MACD column shortening
macdShortening = macd < macd[1] and macd[1] > macd[2]
// Calculate MACD column lengthening
macdLongening = macd > macd[1] and macd[1] < macd[2]
// Define hidden top divergence signals
bearishDivergence = priceNewHigh and macdShortening
bullishDivergence = priceNewLow and macdLongening
rets = [bullishDivergence, bearishDivergence];
return rets
}
// Calculate the divergence situation of the 4-hour period
rets4h = security(syminfo.tickerid, '4h', funcinvisible_divergence(open, high, low, close))
invdiv4h = rets_4h{0}
invdiv14h = rets_4h{1}
// Draw the signal
plotText(invdiv4h, title='4h Bottom Divergence Warning', text = '4h Bottom Divergence', refSeries = low, color='green', fontSize=14, placement='bottom' ,display=true);
plotText(invdiv14h, title='4h Top Divergence Warning', text = '4h Top Divergence', refSeries = high, color='red', fontSize=14, placement='top' ,display=true);
// Define alert conditions
alertcondition(invdiv4h, title='4h Bottom Divergence Warning', direction="buy")
alertcondition(invdiv14h, title='4h Top Divergence Warning', direction="sell")
Step 7, you can pay attention to setting the main chart display
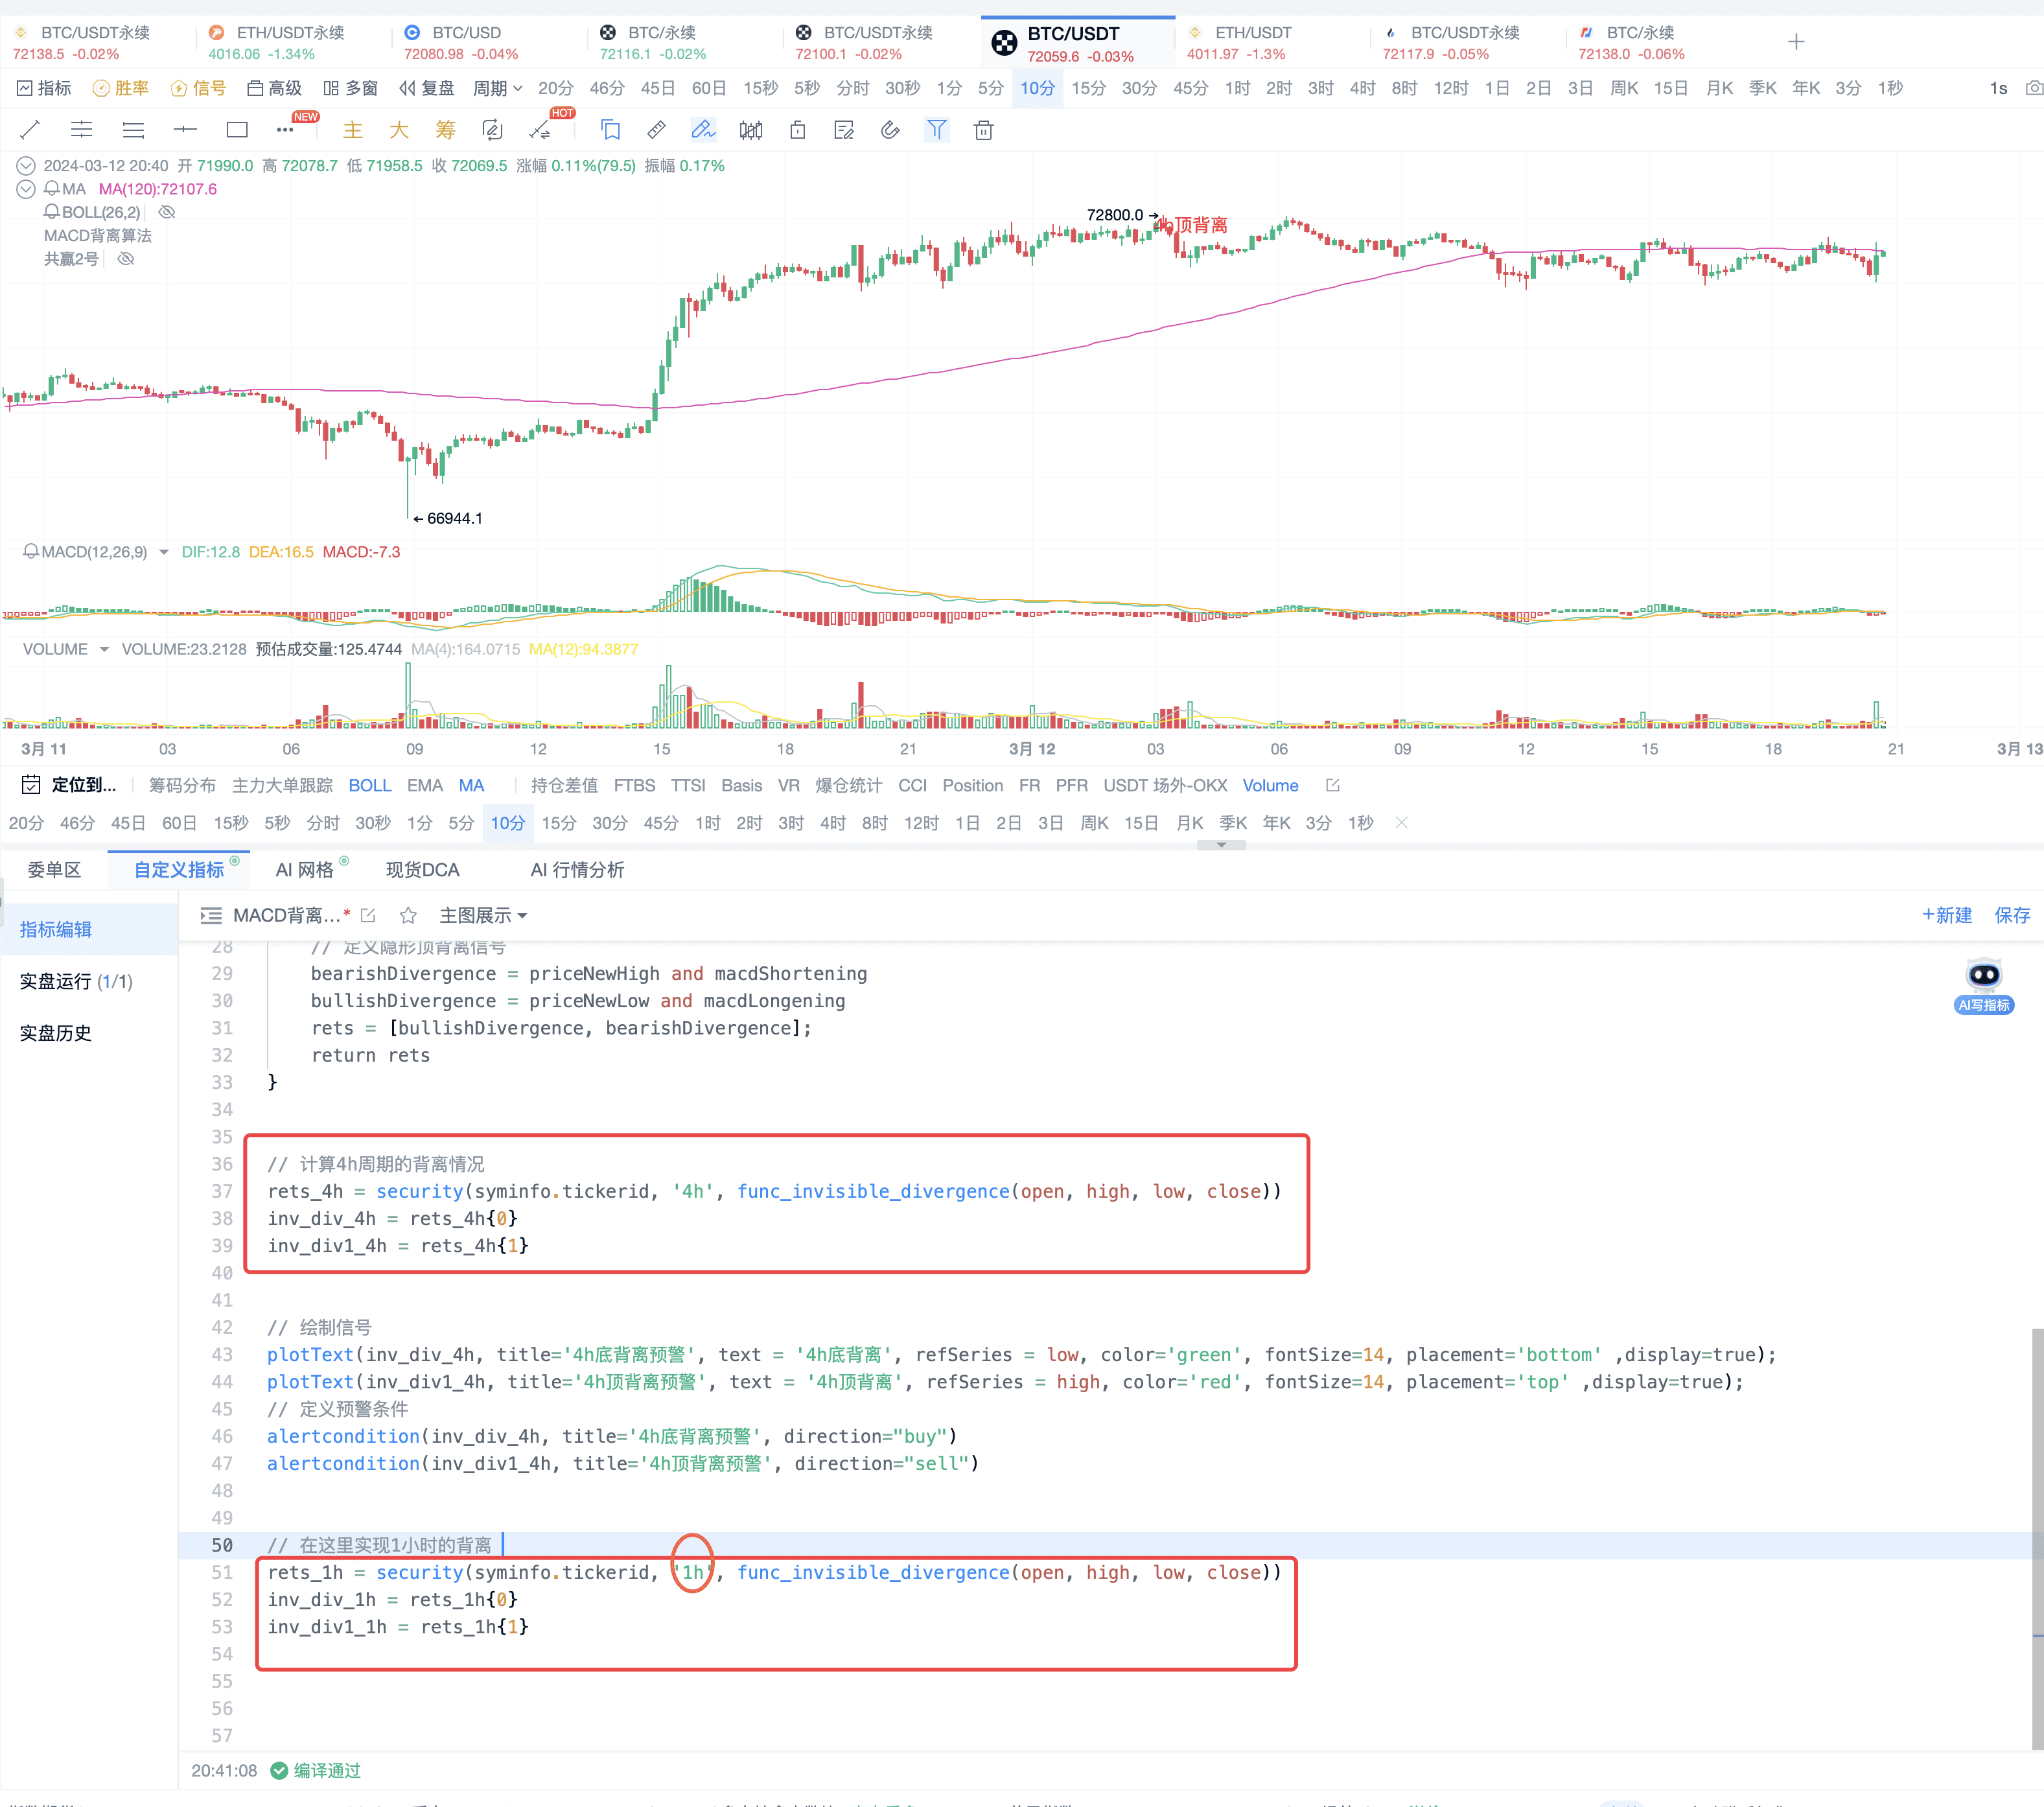
III. Adding MACD Divergence Signals for Other Periods
1. You can refer to the 4-hour divergence and modify the relevant parameters for the 1-hour divergence
See the display effect of the 1-hour divergence
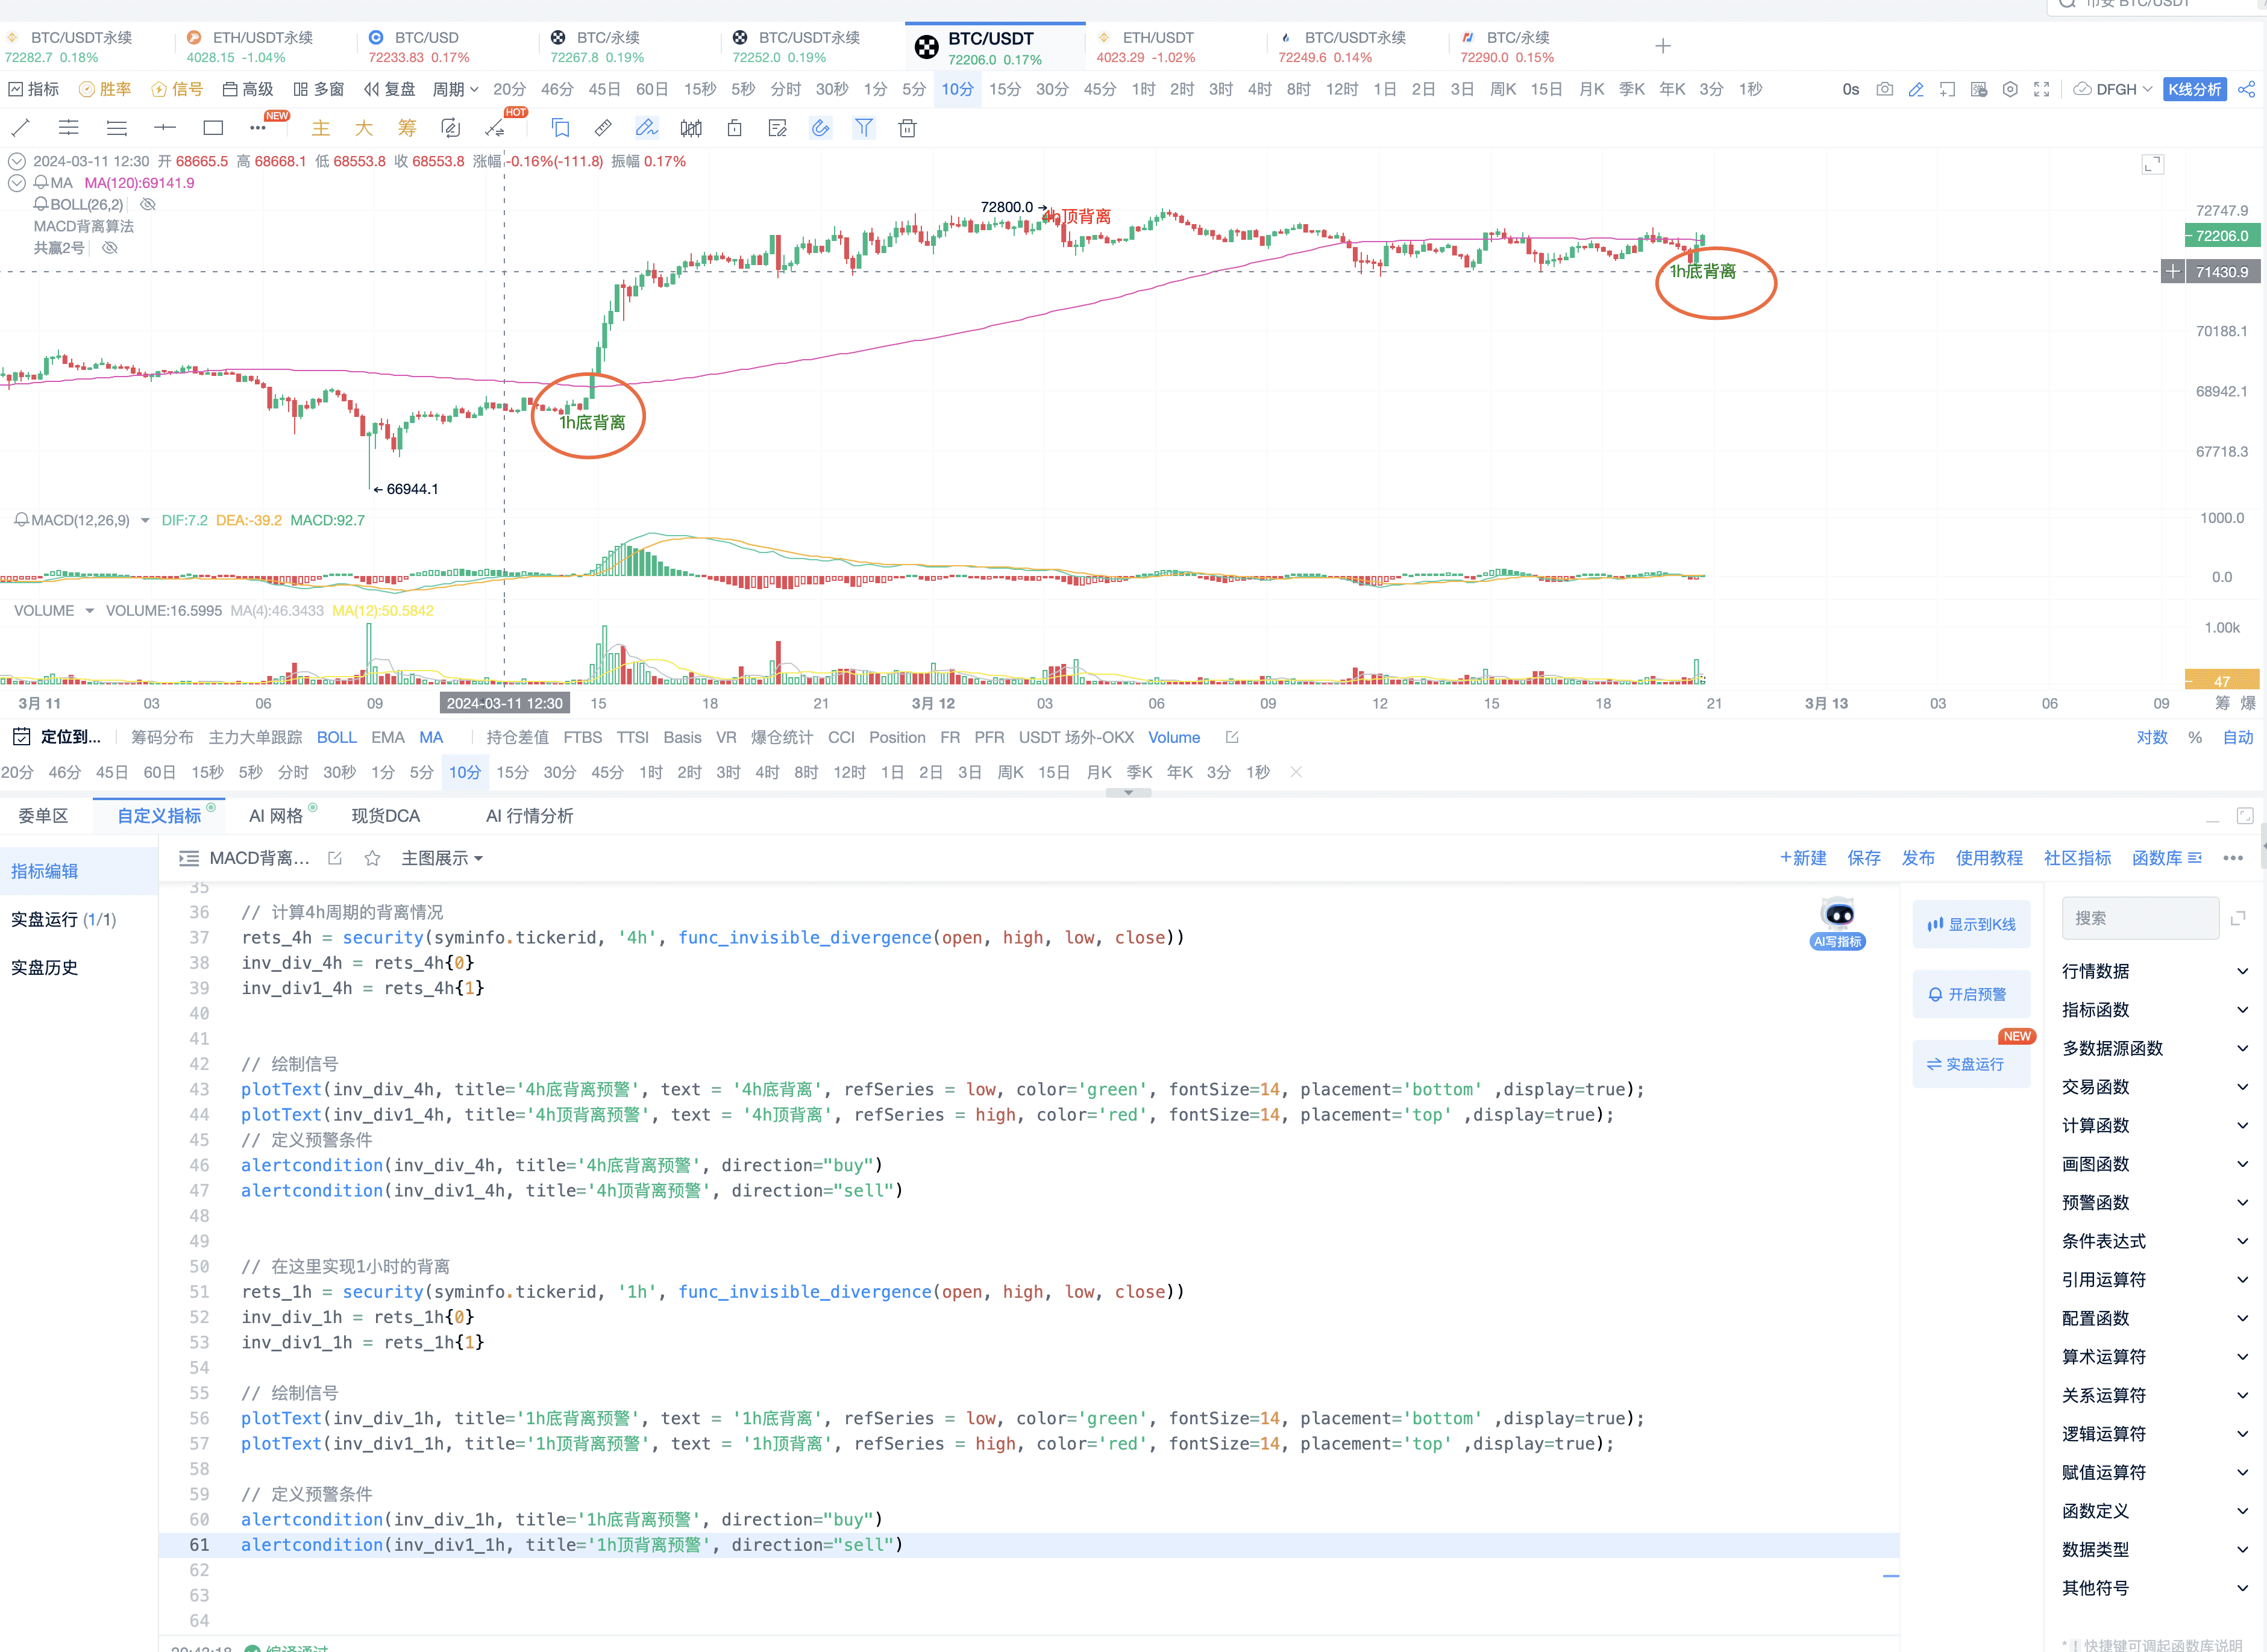
Sharing the code for 1-hour and 4-hour together
// This indicator is created by AICOIN Research Institute. If you encounter any usage issues, you can join the indicator community for consultation
// @version=2
// Define indicator-related parameters
N1 = 12
N2 = 26
M = 9
funcinvisibledivergence(open, high, low, close) {
// Define indicator-related parameters
N1 = 12
N2 = 26
M = 9
// Calculate the value of the MACD indicator
dif = ema(close, N1) - ema(close, N2)
dea = ema(dif, M)
macd = (dif - dea) * 2
// Calculate the new high of the price
priceNewHigh = high_ > highest(high_, 10)[1] // Assuming we use the highest price of the past 10 candles as a reference
priceNewLow = low_ < lowest(low_, 10)[1]
// Calculate MACD column shortening
macdShortening = macd < macd[1] and macd[1] > macd[2]
// Calculate MACD column lengthening
macdLongening = macd > macd[1] and macd[1] < macd[2]
// Define hidden top divergence signals
bearishDivergence = priceNewHigh and macdShortening
bullishDivergence = priceNewLow and macdLongening
rets = [bullishDivergence, bearishDivergence];
return rets
}
// Calculate the divergence situation of the 4-hour period
rets4h = security(syminfo.tickerid, '4h', funcinvisible_divergence(open, high, low, close))
invdiv4h = rets_4h{0}
invdiv14h = rets_4h{1}
// Draw the signal
plotText(invdiv4h, title='4h Bottom Divergence Warning', text = '4h Bottom Divergence', refSeries = low, color='green', fontSize=14, placement='bottom' ,display=true);
plotText(invdiv14h, title='4h Top Divergence Warning', text = '4h Top Divergence', refSeries = high, color='red', fontSize=14, placement='top' ,display=true);
// Define alert conditions
alertcondition(invdiv4h, title='4h Bottom Divergence Warning', direction="buy")
alertcondition(invdiv14h, title='4h Top Divergence Warning', direction="sell")
// Implement the divergence for 1 hour here
rets1h = security(syminfo.tickerid, '1h', funcinvisible_divergence(open, high, low, close))
invdiv1h = rets_1h{0}
invdiv11h = rets_1h{1}
// Draw the signal
plotText(invdiv1h, title='1h Bottom Divergence Warning', text = '1h Bottom Divergence', refSeries = low, color='green', fontSize=14, placement='bottom' ,display=true);
plotText(invdiv11h, title='1h Top Divergence Warning', text = '1h Top Divergence', refSeries = high, color='red', fontSize=14, placement='top' ,display=true);
// Define alert conditions
alertcondition(invdiv1h, title='1h Bottom Divergence Warning', direction="buy")
alertcondition(invdiv11h, title='1h Top Divergence Warning', direction="sell")
2. Continue to copy the 30-minute code
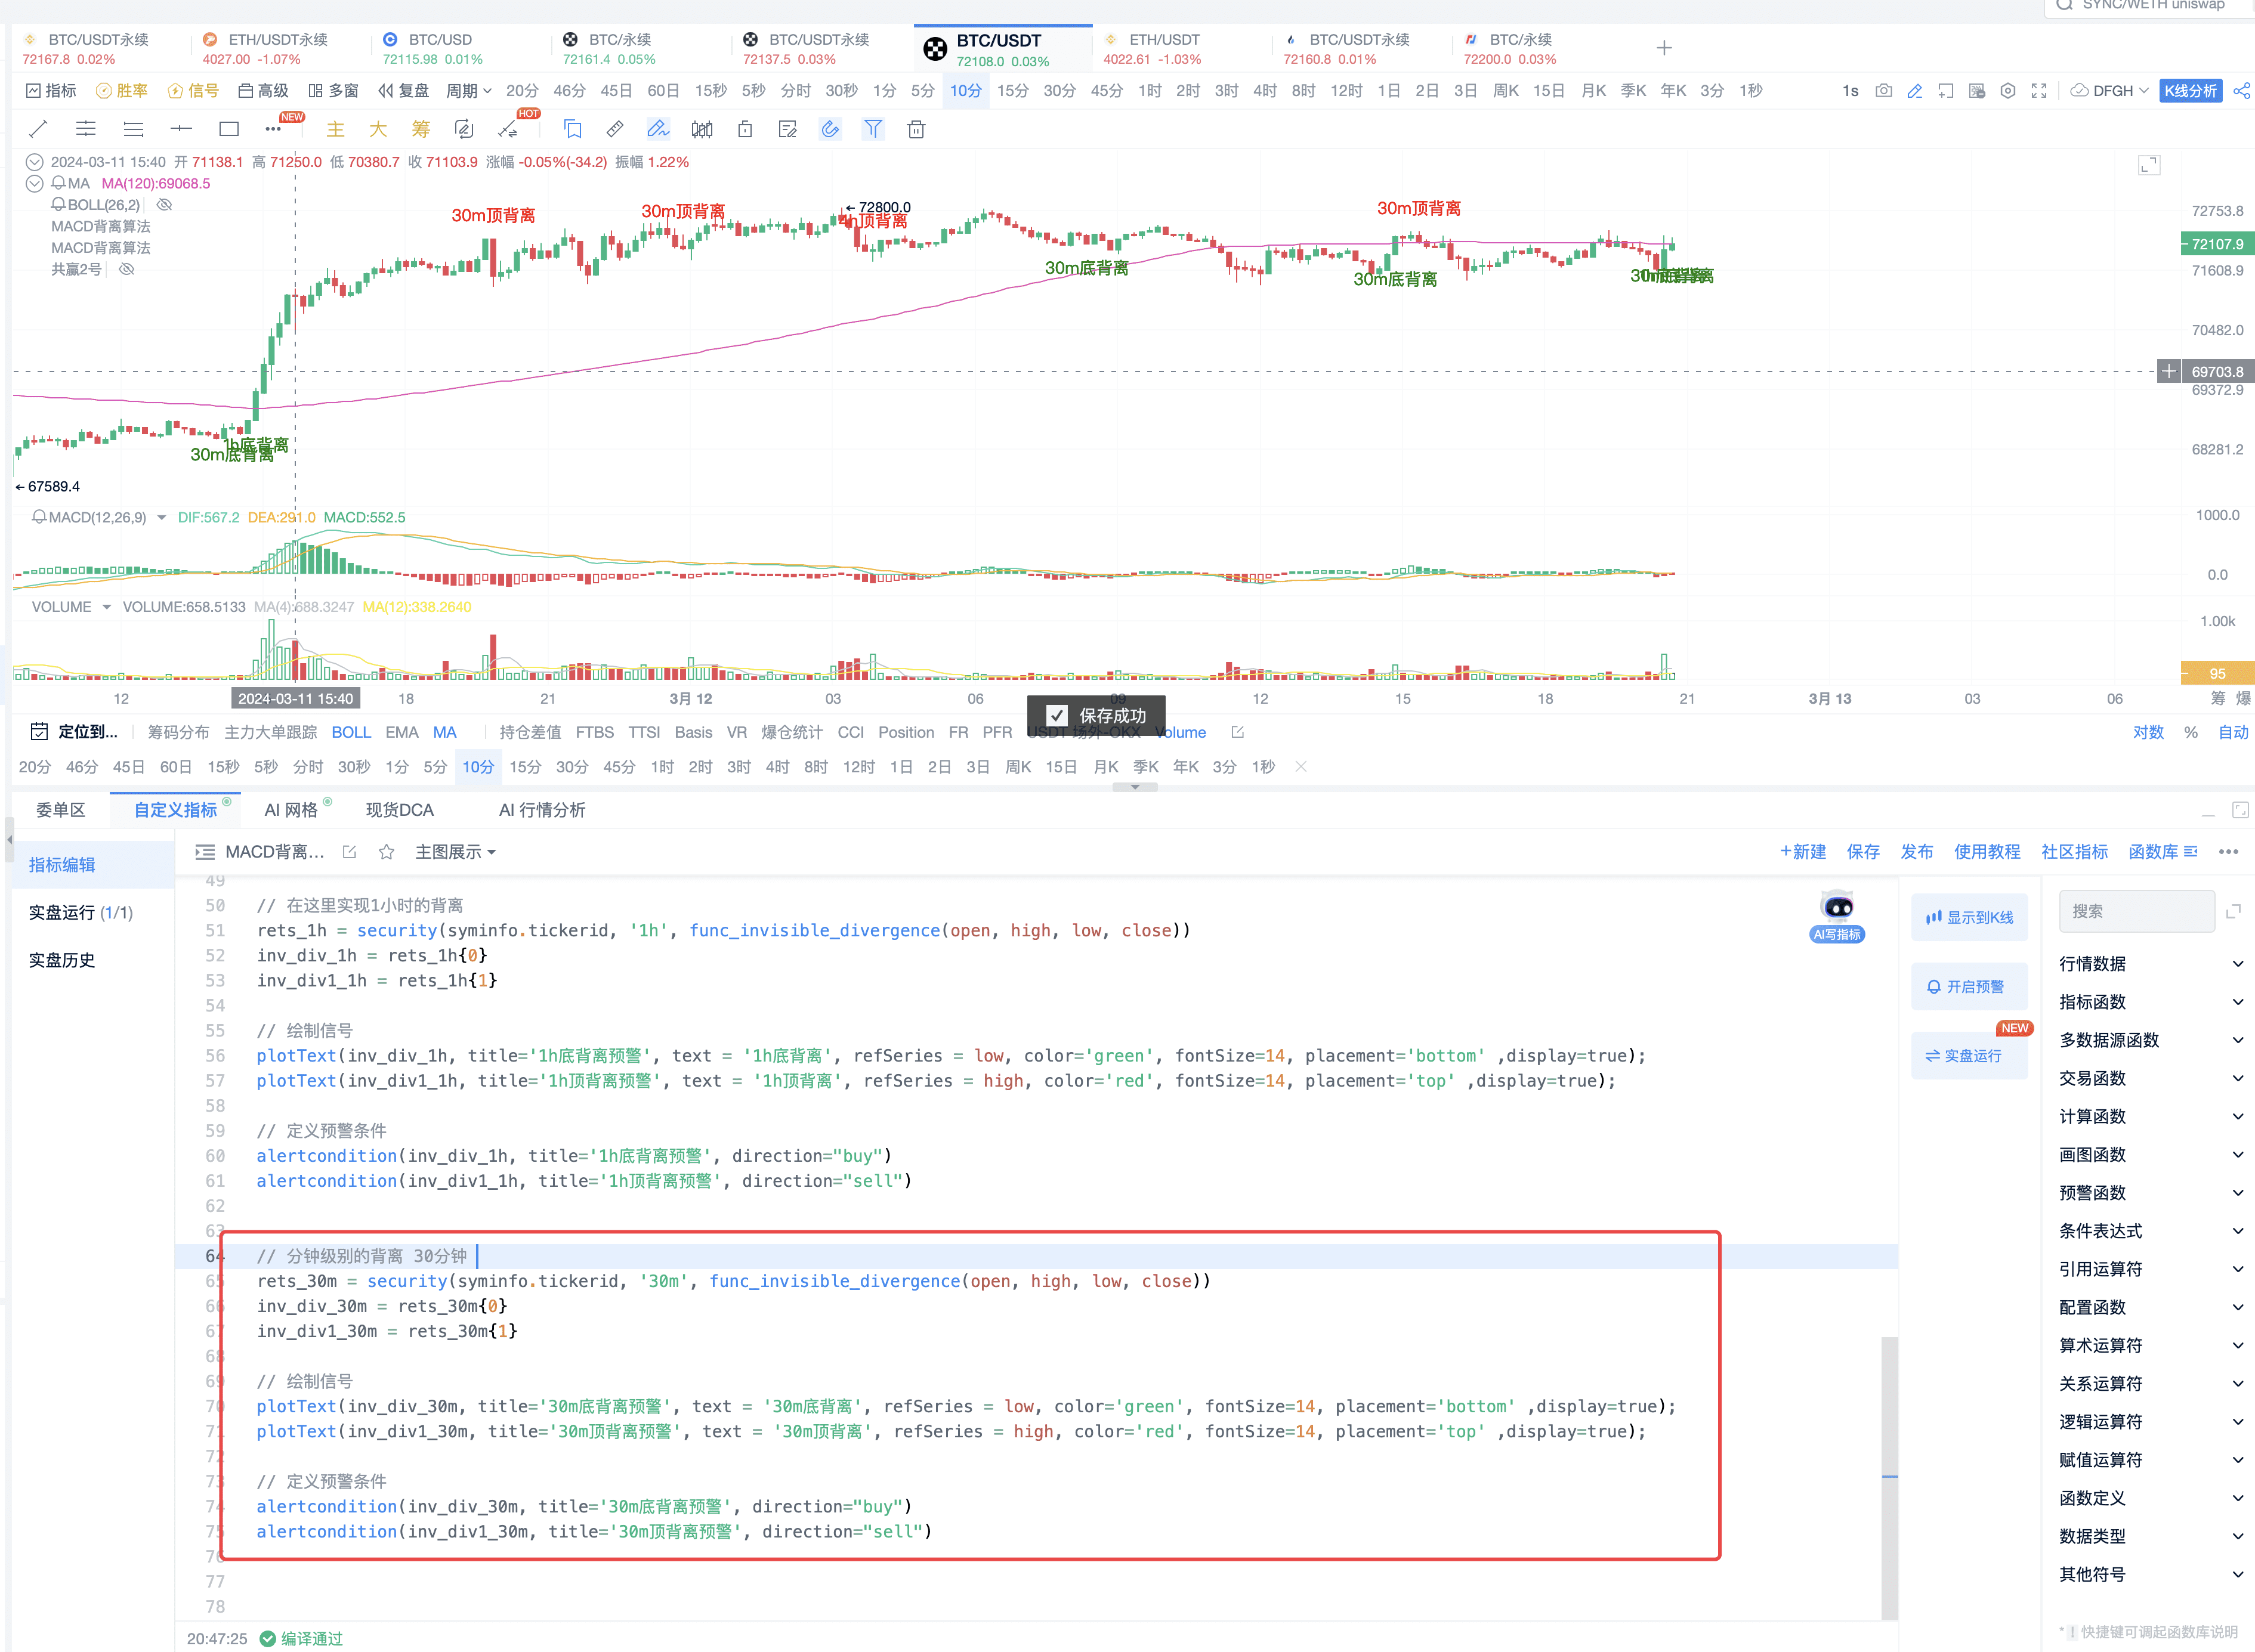
30-minute Divergence Signal Code Sharing
// Divergence at the minute level 30 minutes
rets30m = security(syminfo.tickerid, '30m', funcinvisible_divergence(open, high, low, close))
invdiv30m = rets_30m{0}
invdiv130m = rets_30m{1}
// Draw the signal
plotText(invdiv30m, title='30m Bottom Divergence Warning', text = '30m Bottom Divergence', refSeries = low, color='green', fontSize=14, placement='bottom' ,display=true);
plotText(invdiv130m, title='30m Top Divergence Warning', text = '30m Top Divergence', refSeries = high, color='red', fontSize=14, placement='top' ,display=true);
// Define alert conditions
alertcondition(invdiv30m, title='30m Bottom Divergence Warning', direction="buy")
alertcondition(invdiv130m, title='30m Top Divergence Warning', direction="sell")
3. Displaying top and bottom divergences for 4-hour, 1-hour, and 30-minute periods
By adding the above code and clicking to display the candlestick chart, you can see the top and bottom divergences for the 4-hour, 1-hour, and 30-minute periods on the candlestick chart.
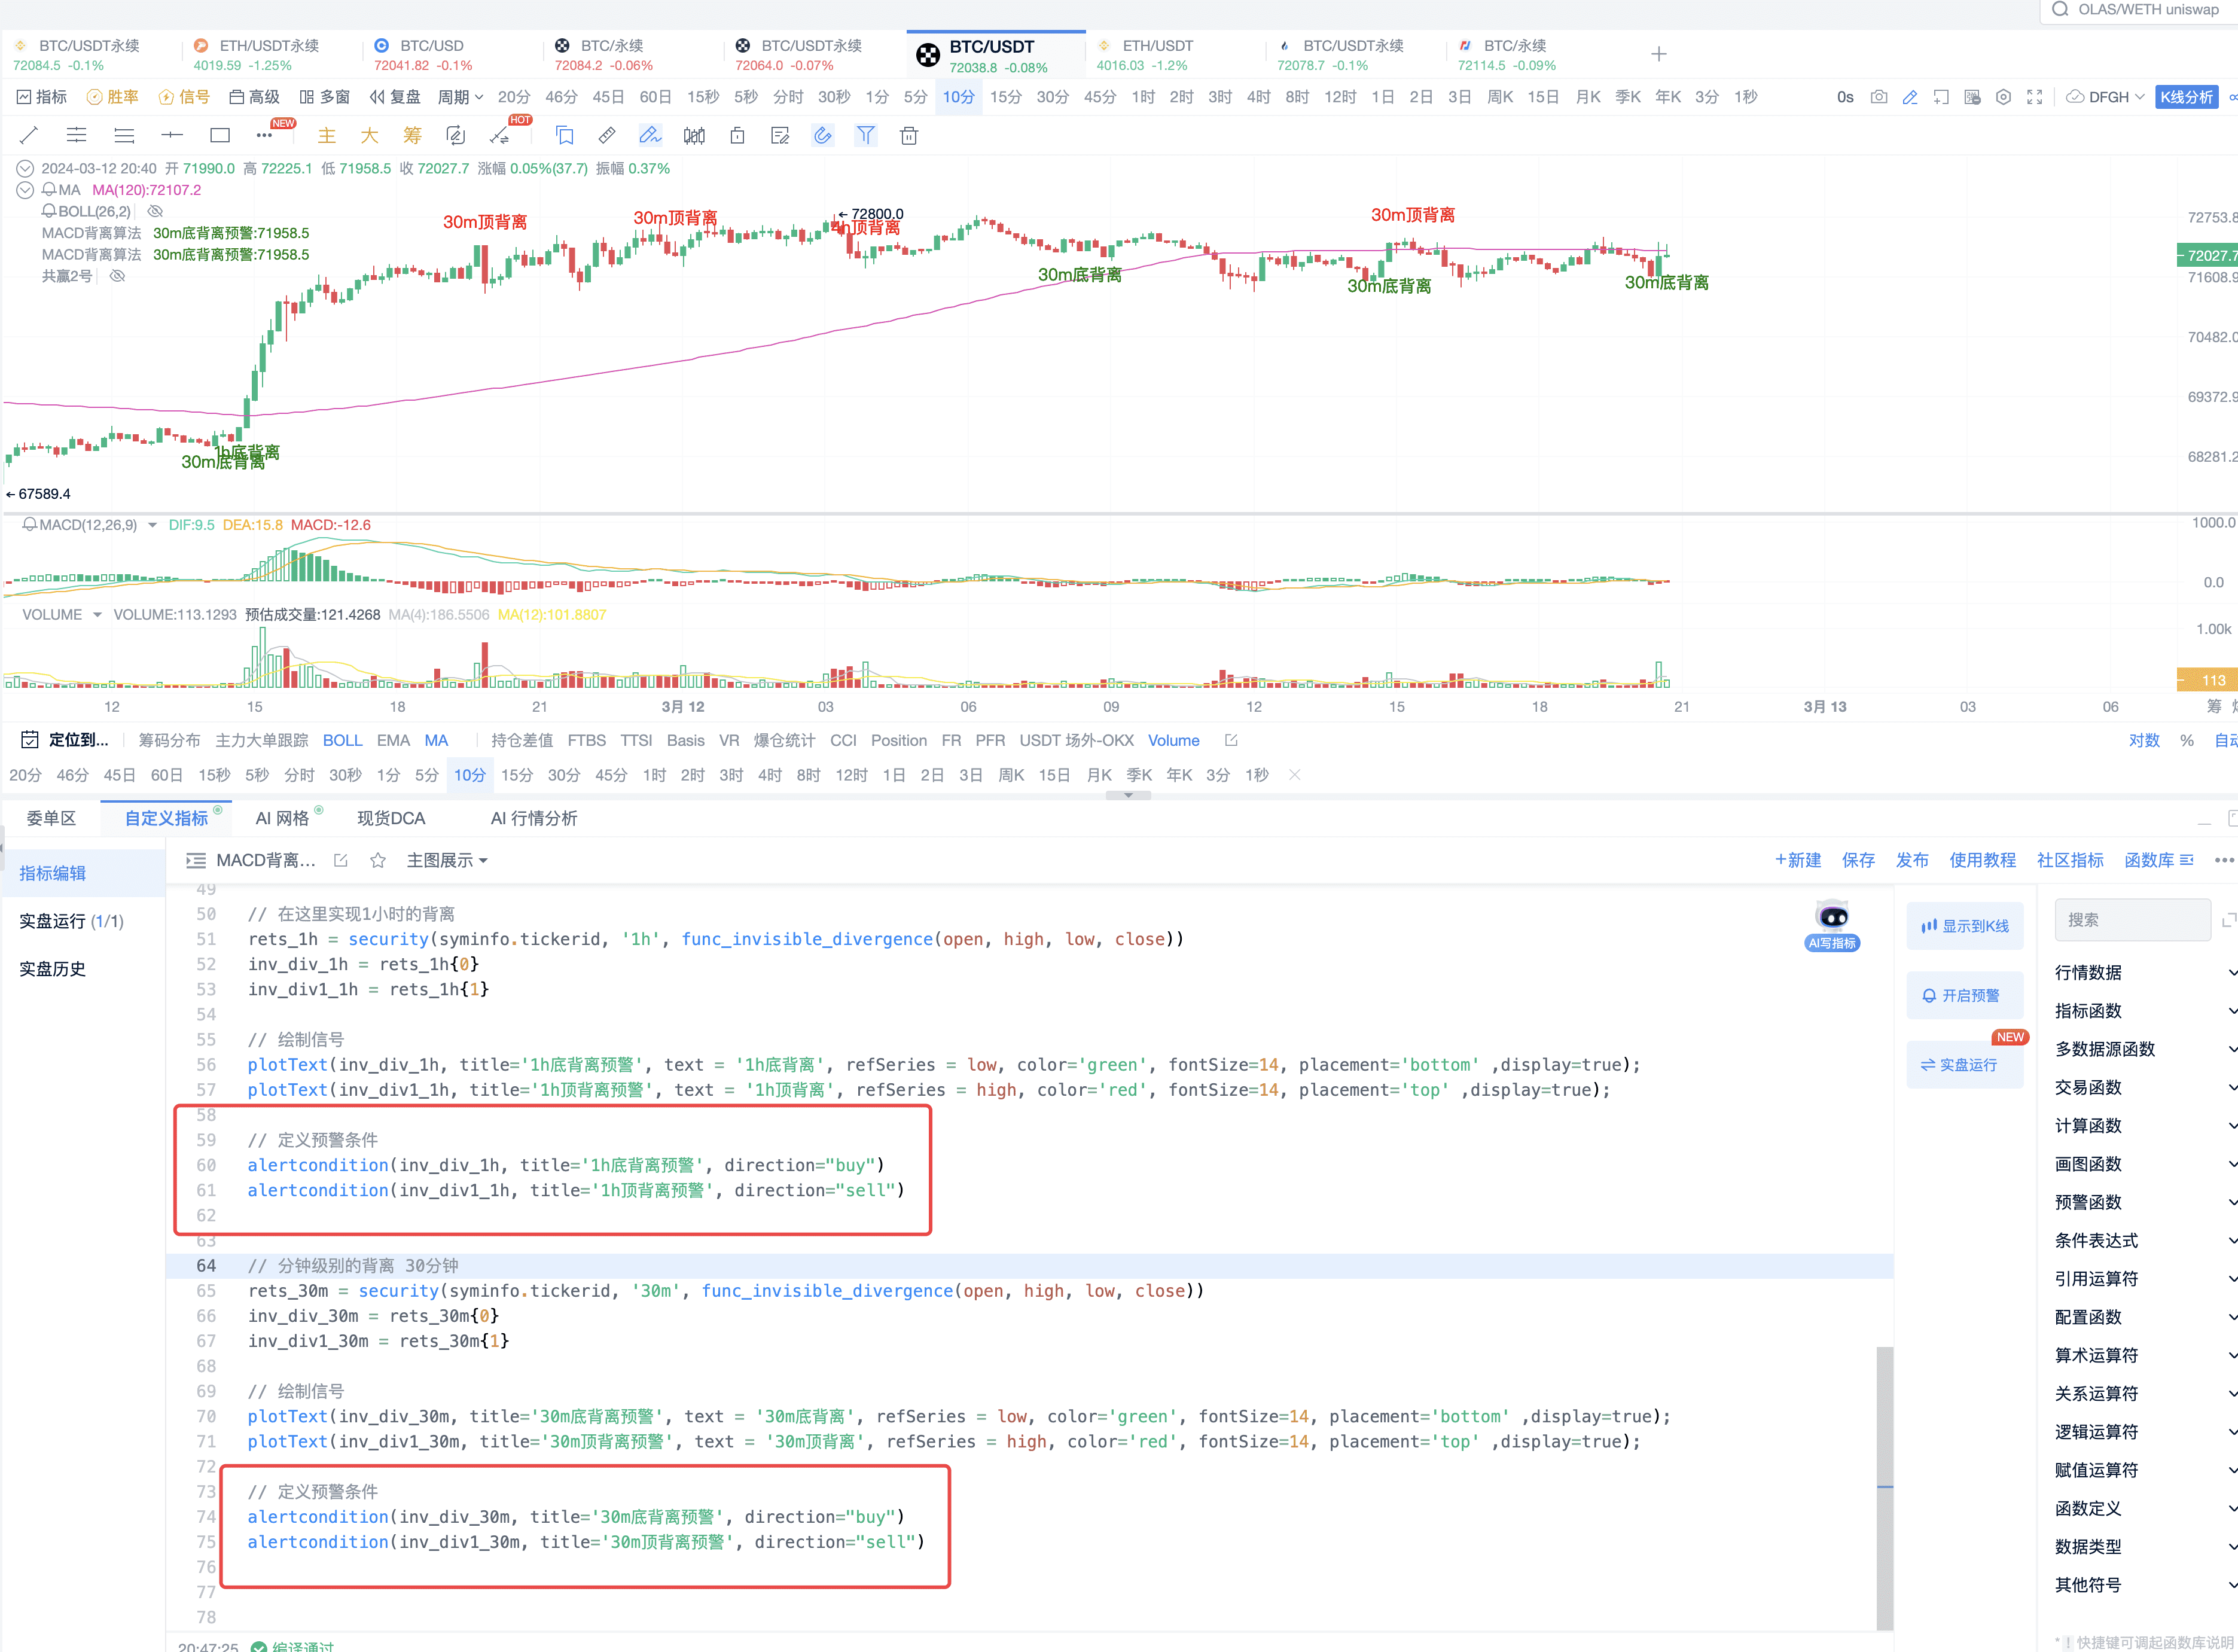
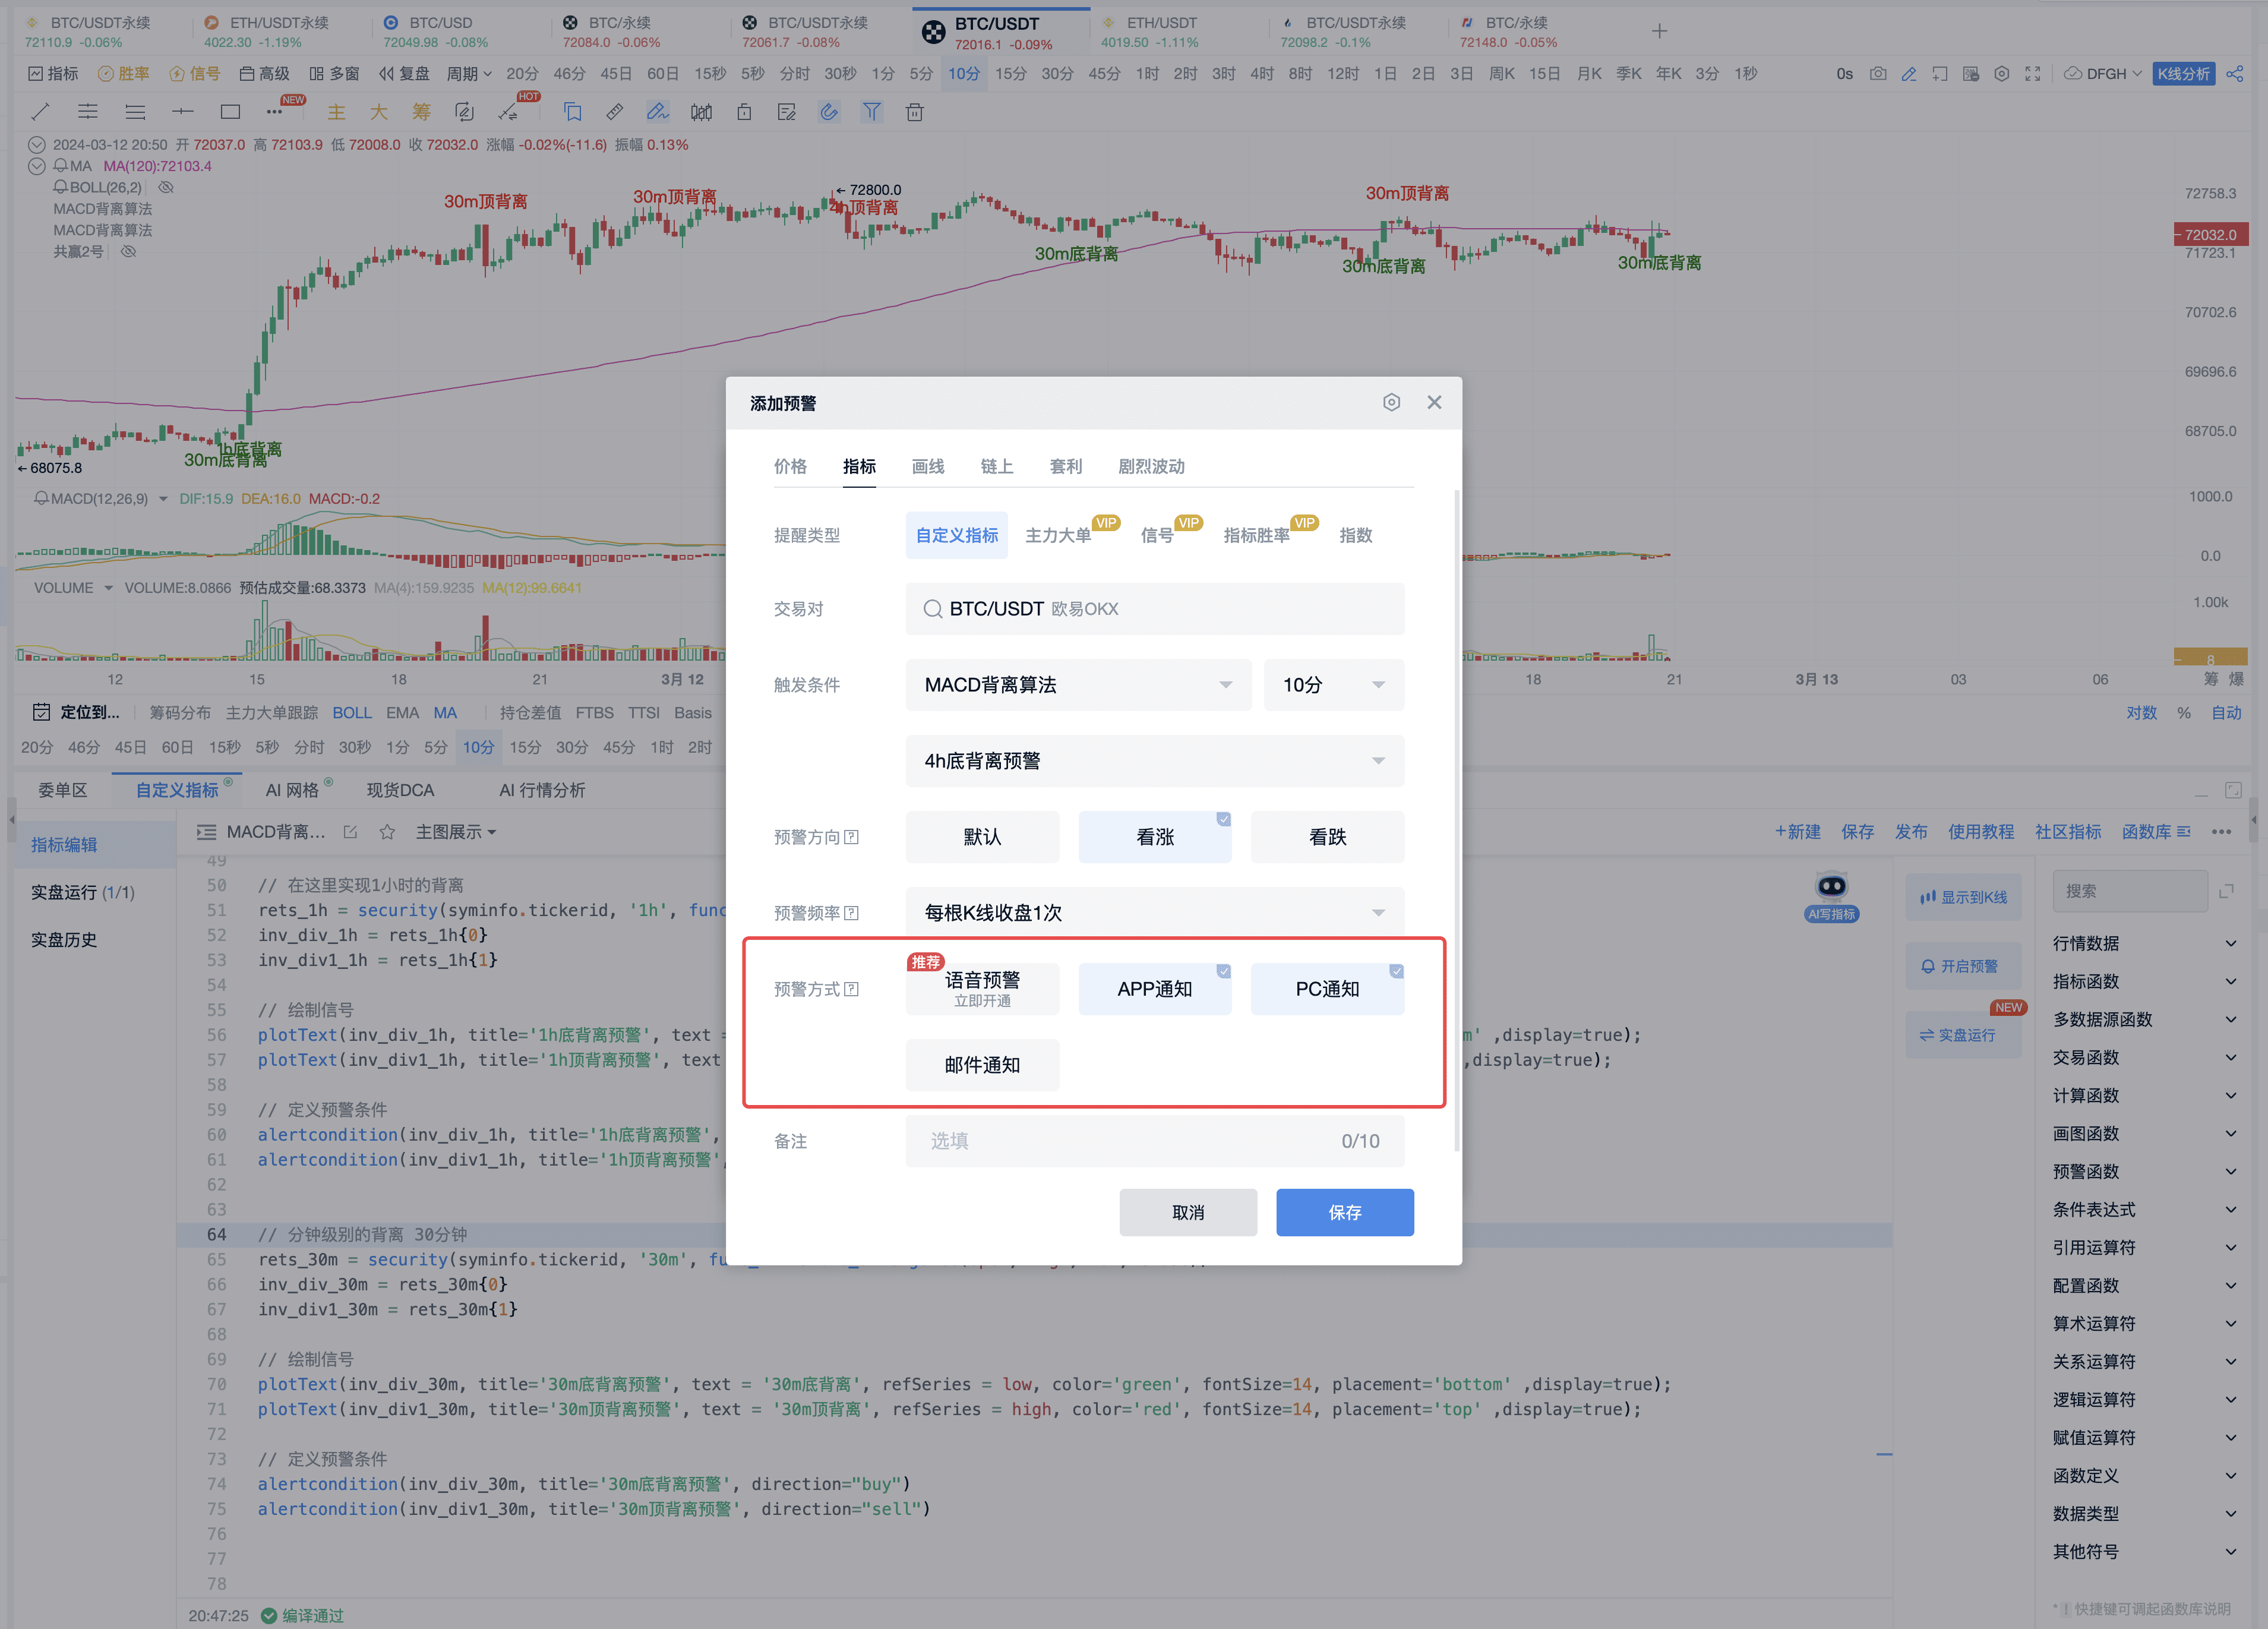
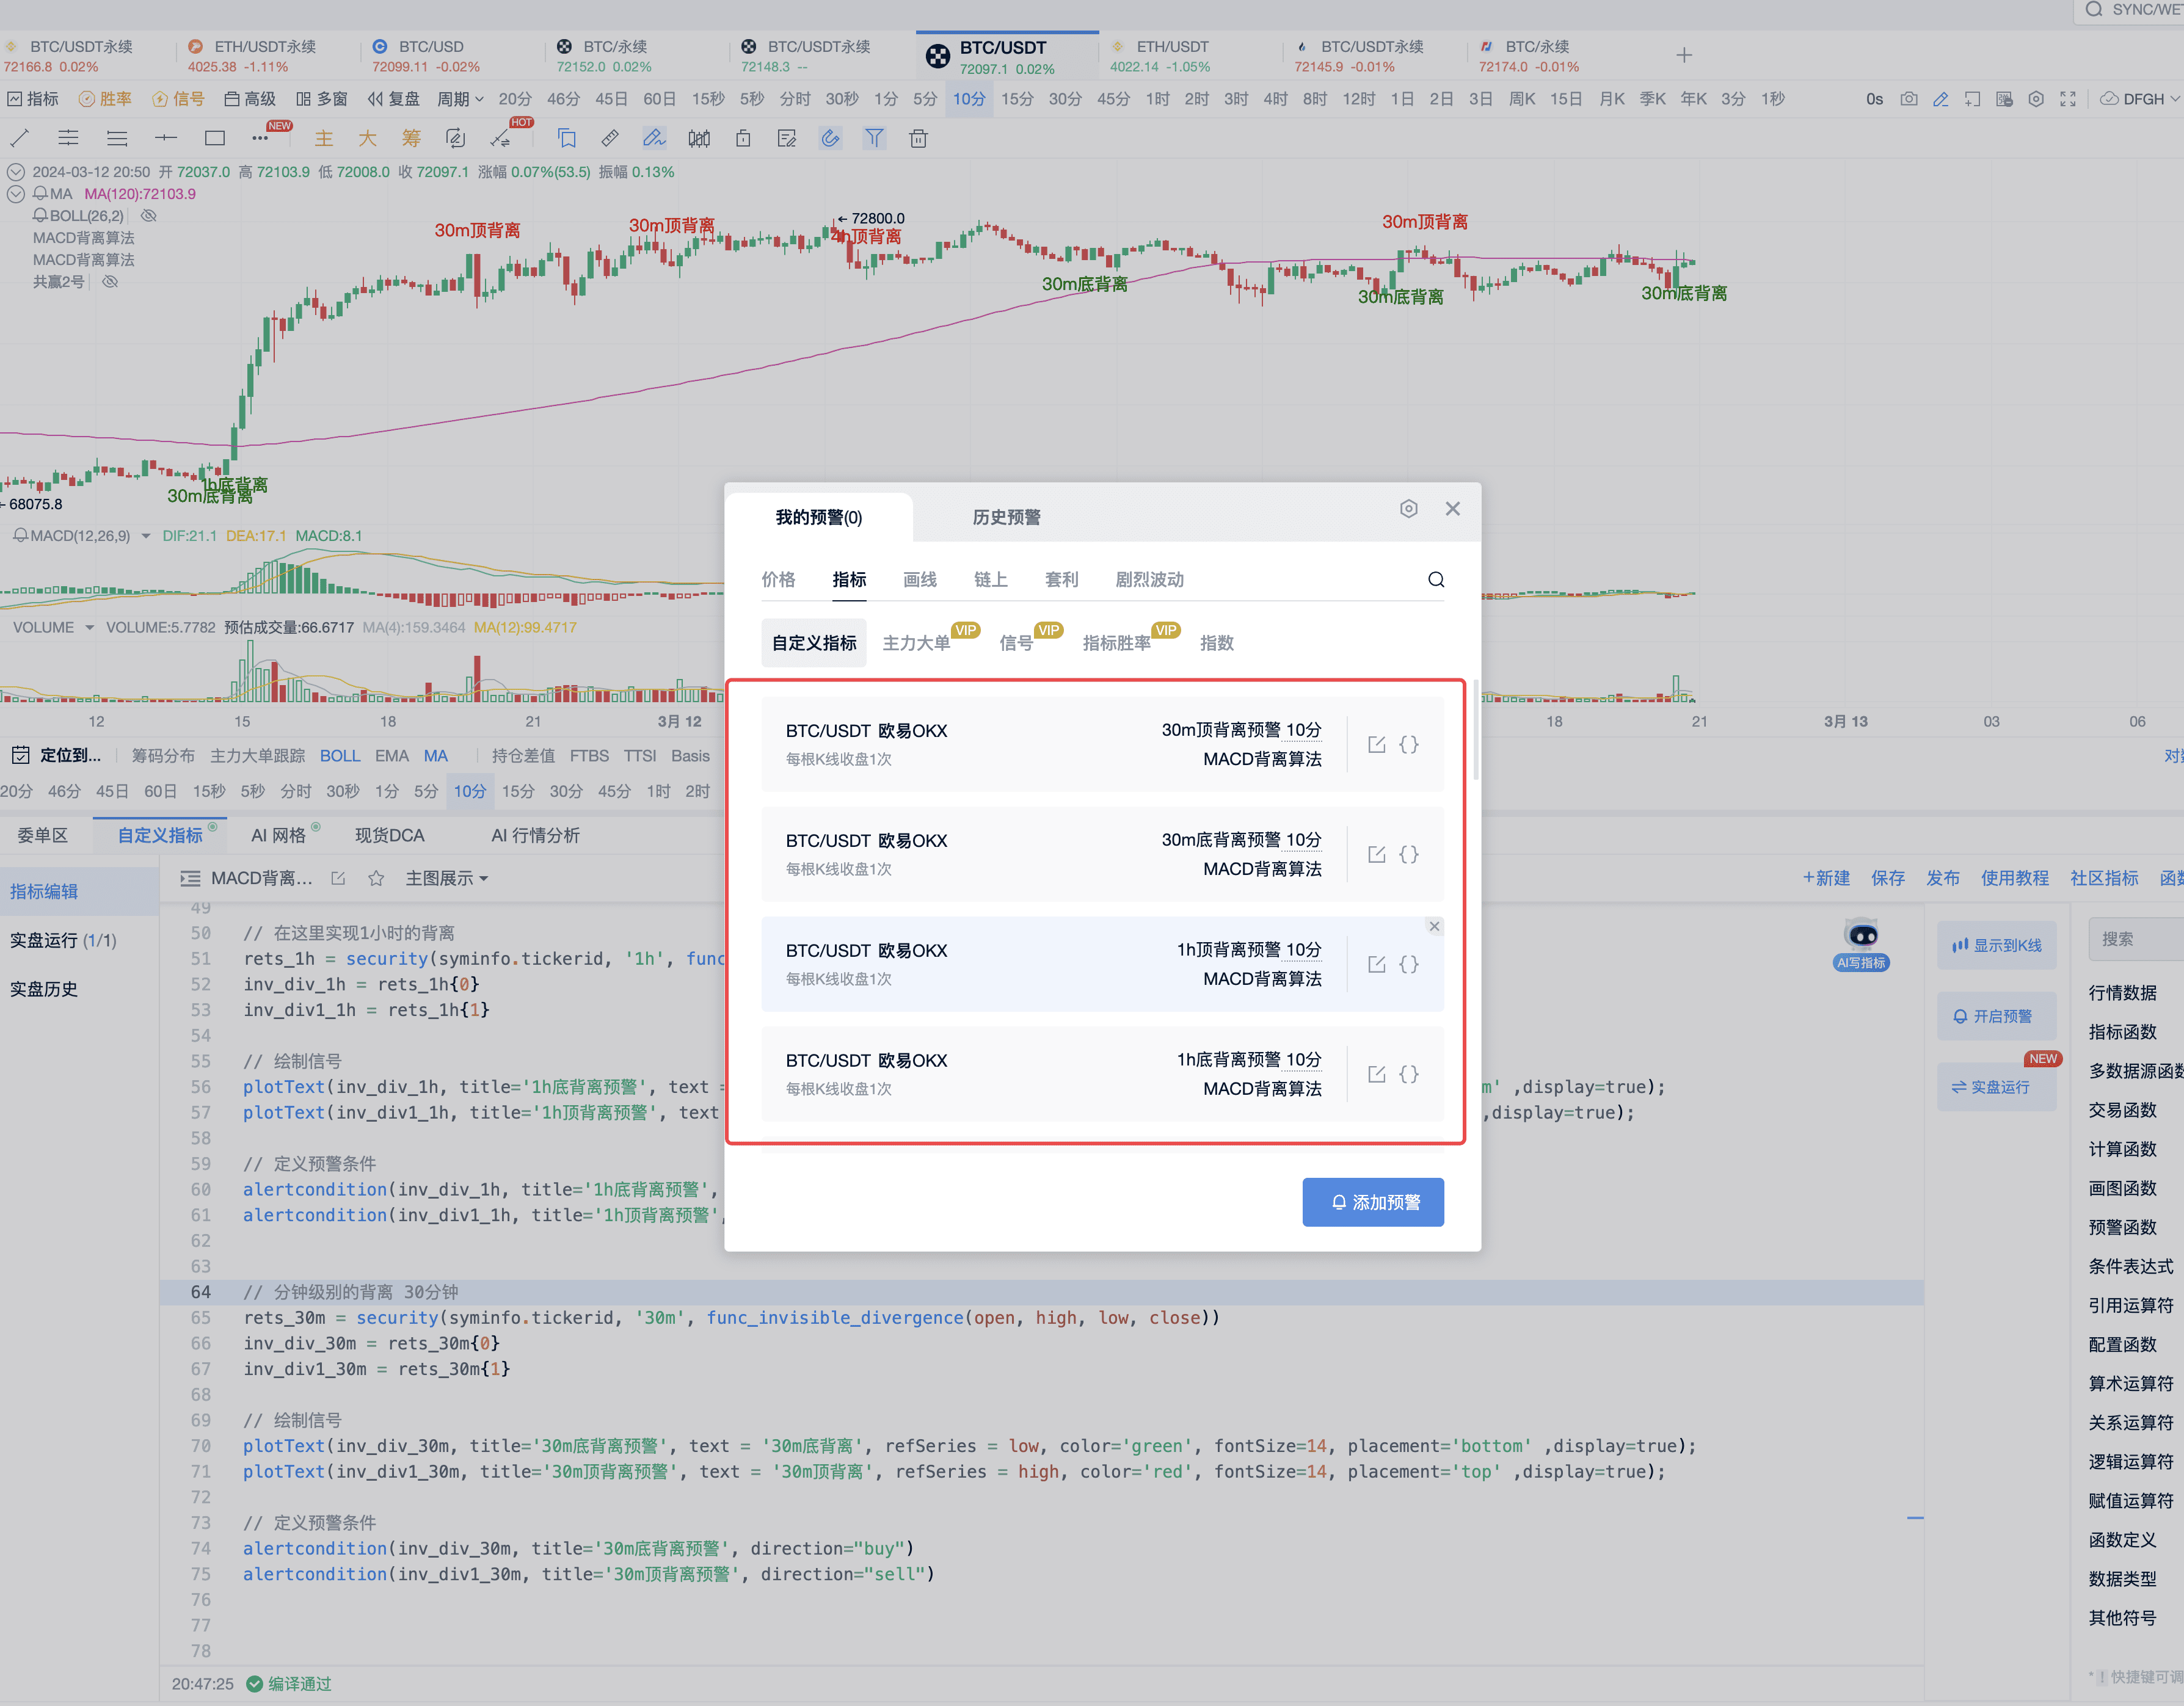
IV. Setting Alert Reminders for MACD Indicator Divergence
1. Set alert conditions for each period as shown in the image
2. After setting the alert, click to enable the alert
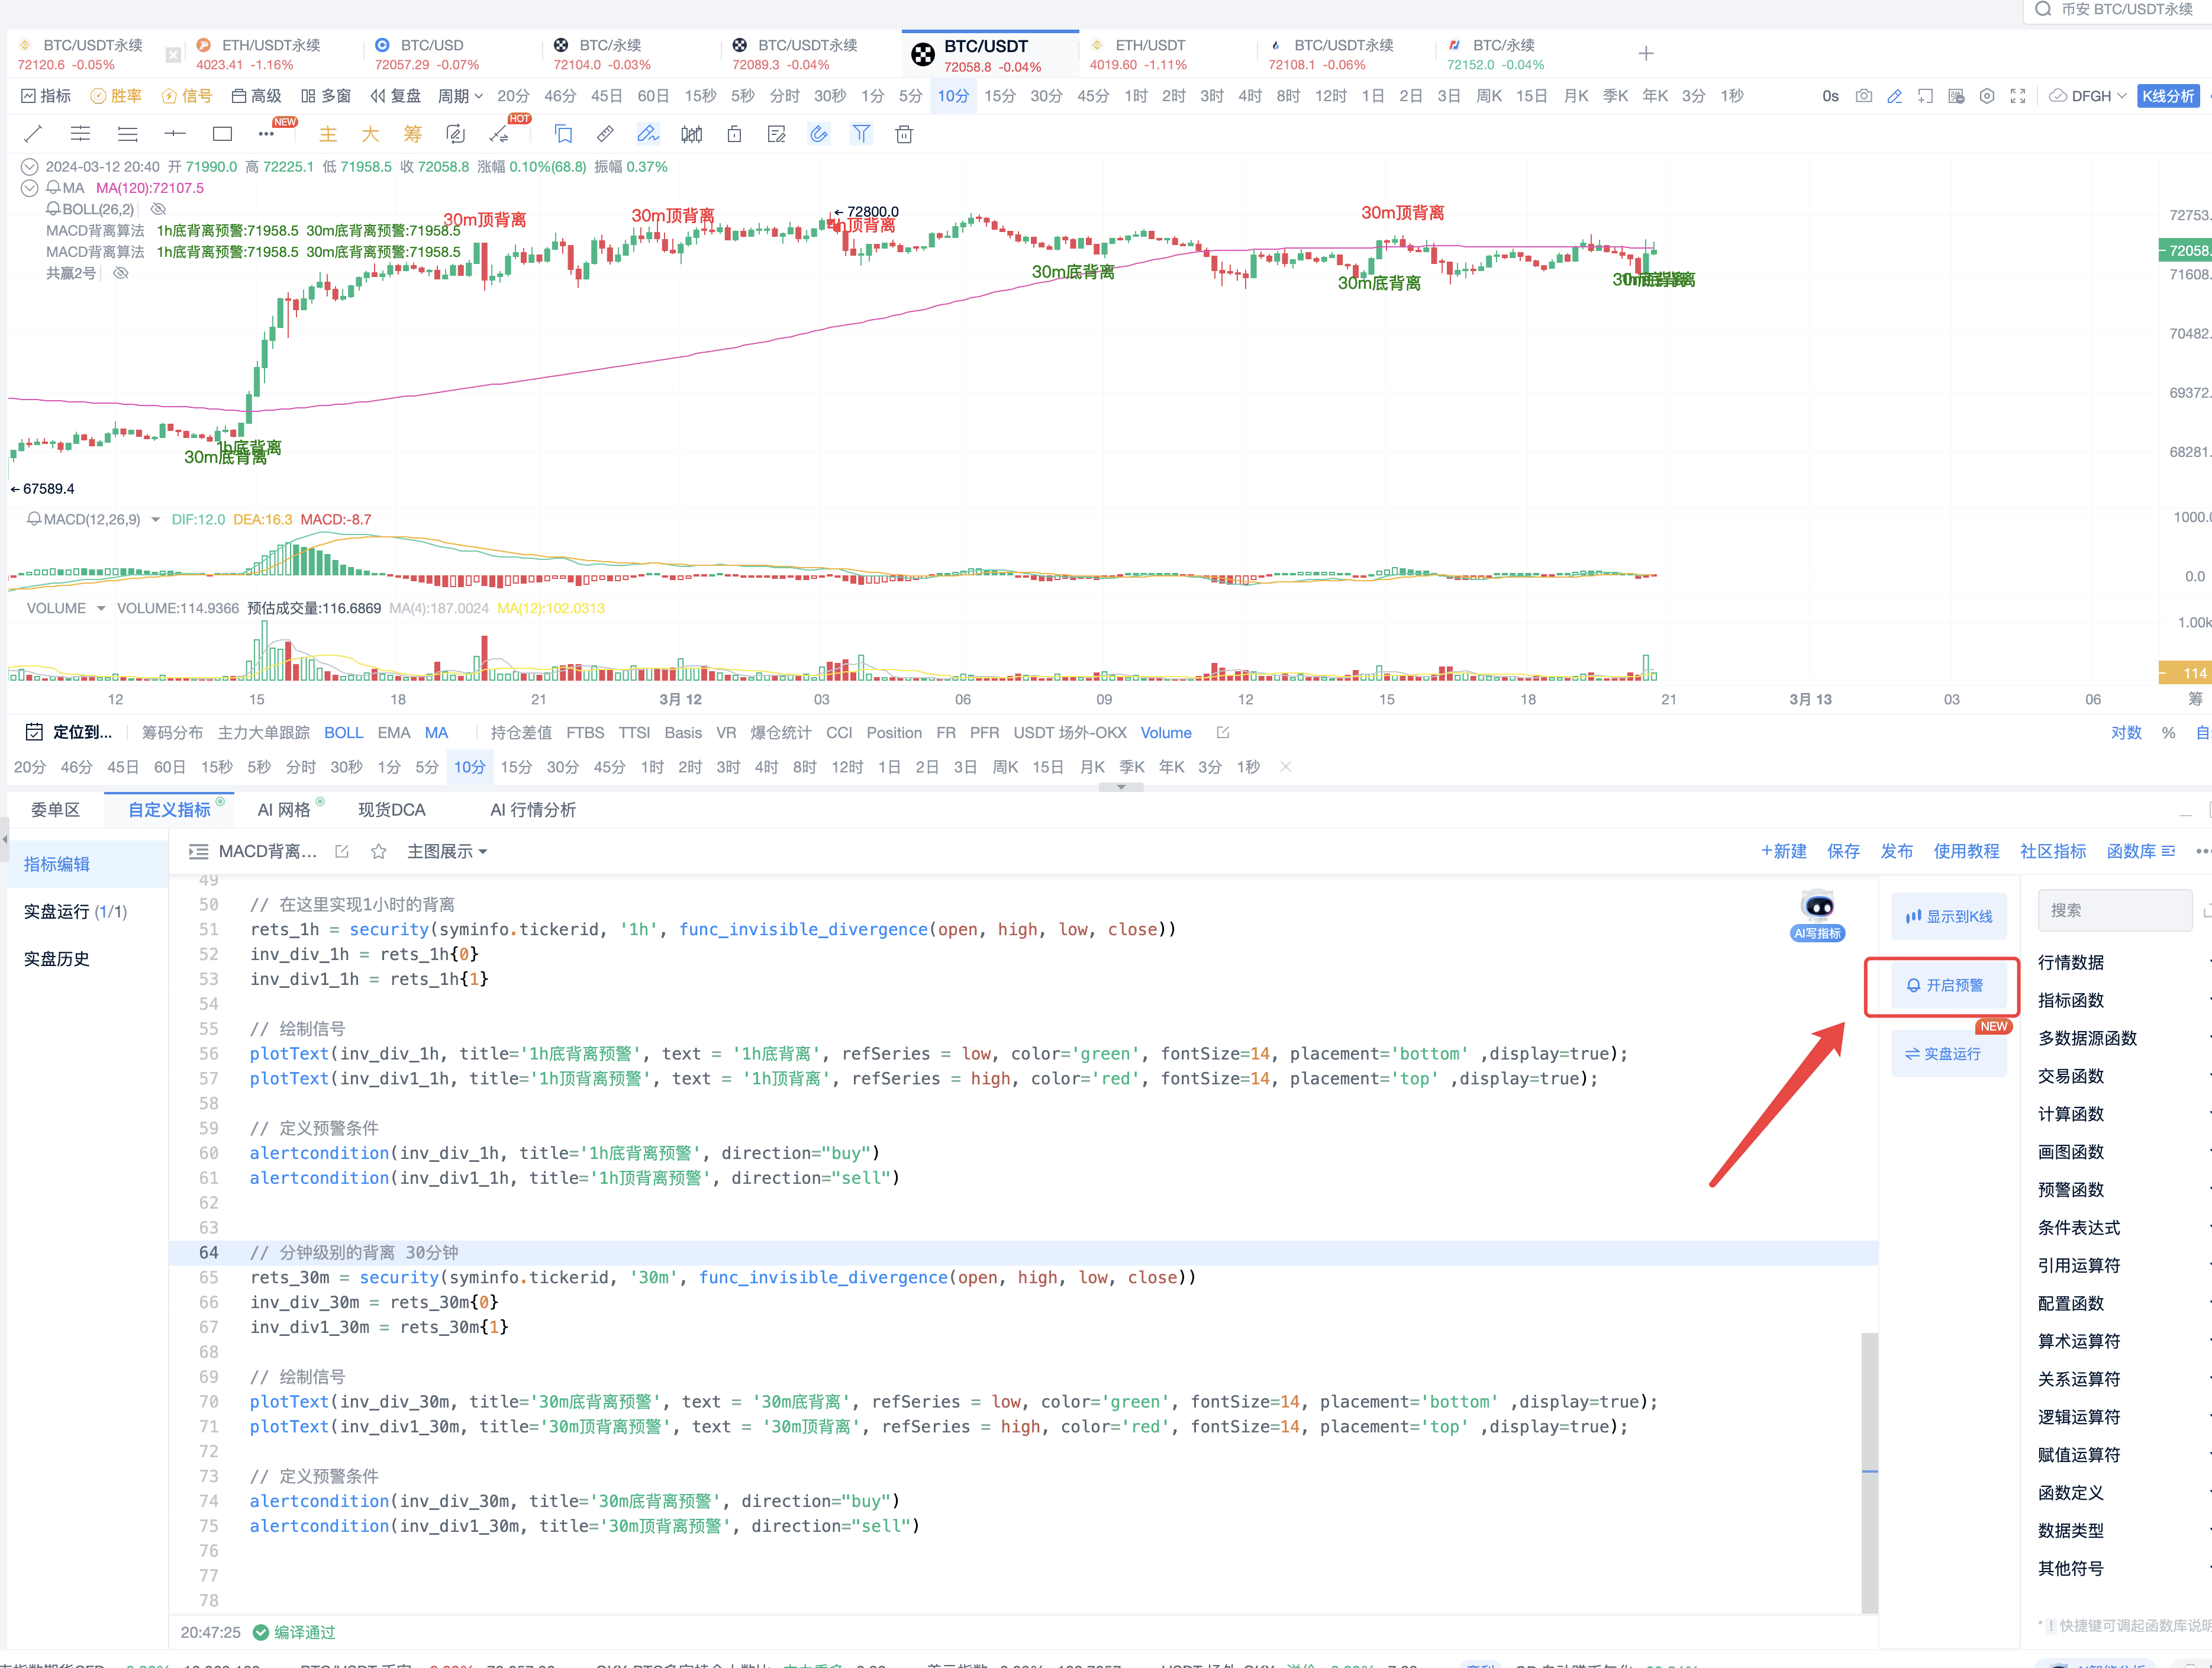
3. There are various ways to set alerts to track the market and not miss signals
V. Q&A
- Do I need to keep the AICoin trading grid software running on my computer all the time? Will the program be affected if the computer goes to sleep?
Yes, you need to keep the computer running to maintain the software operation, or you can buy a cloud server to run it, such as purchasing a Windows version of a cloud server to keep it running continuously.
- Can I set multiple periods for the indicators?
You can write several divergence scripts to achieve this.
PRO members and signal alert members have access to premium tools tailored for lazy traders, including custom indicators to help plan their trades and trade their plans. For more custom indicator strategy displays and multiple alert reminders, feel free to subscribe to the Signal Alert/PRO K-line version, both of which offer a limited-time free trial of custom indicator membership. Click the link below to subscribe and experience: https://aicoin.app/zh-CN/vip/chartpro
Recommended Reading
For more live broadcast content, please follow the "Live Review" section in AICoin's news/information, and feel free to download the AICoin PC version.
免责声明:本文章仅代表作者个人观点,不代表本平台的立场和观点。本文章仅供信息分享,不构成对任何人的任何投资建议。用户与作者之间的任何争议,与本平台无关。如网页中刊载的文章或图片涉及侵权,请提供相关的权利证明和身份证明发送邮件到support@aicoin.com,本平台相关工作人员将会进行核查。