
Bitcoin returns to 43,000. I believe many people will say that this wave is about to surge to 50,000 or 60,000, or that the bull market will return quickly. Here, I want to pour cold water on everyone again. The mini bull market is about to end, and the rebound is still the last chance for the bulls to escape. Although the Spring Festival red envelope market is generous, the risks are increasing.
First of all, the probability of a doji star on the monthly chart this month is very high. Historically, high-level doji stars have been a signal of market reversal. In 2019, a doji star appeared at the peak of the mini bull market. In 2021, both at 64,800 and 69,000, there were also doji stars. Moreover, my point of view has always been based on the 2019 mini bull market. You could say it's clinging to outdated methods, but what I've summarized is the law of capital operation, which is not subject to individual will. Indicators such as BOLL, RSI, and SKDJ all show similar patterns. Therefore, the reminder for the big cycle is to reduce the risk and rebound.
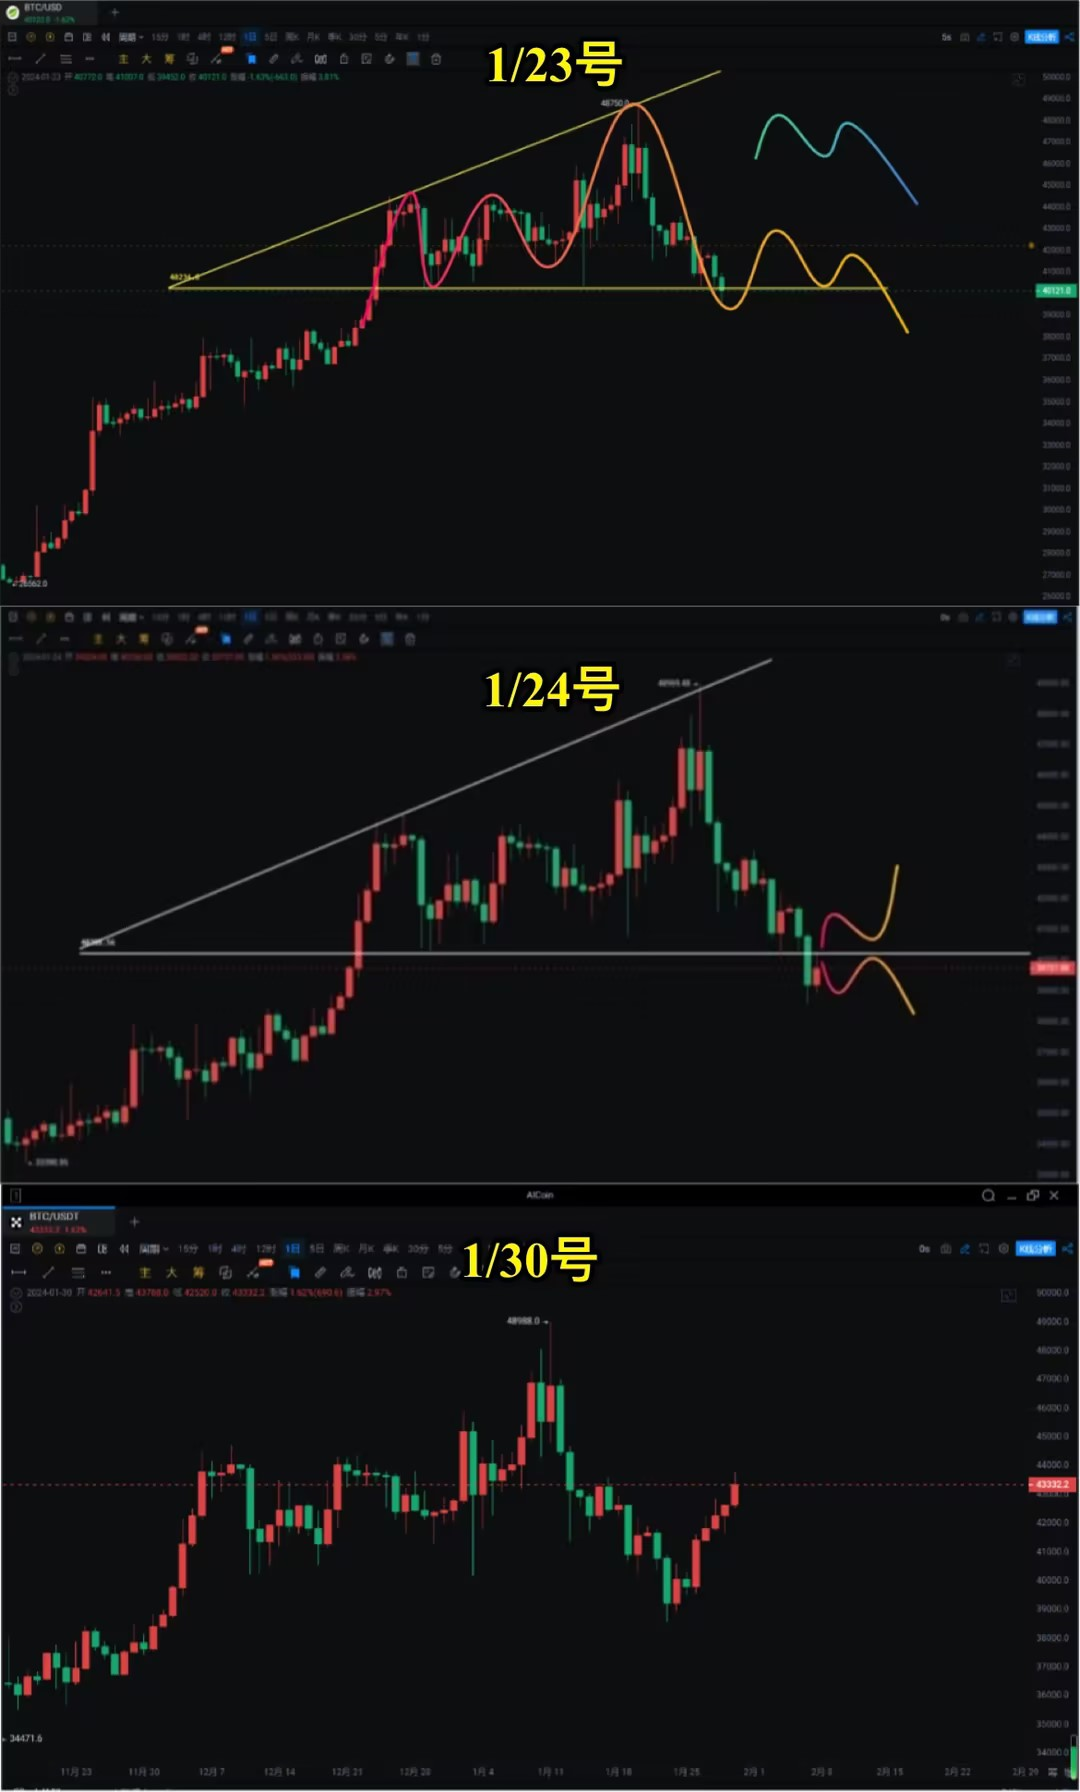
On the weekly chart, after the hammer pattern last week, it returned to the 40,000 range this week. Previously, we mentioned that very few people made money from the previous surge, so the decline will not be smooth sailing either. We have been expecting the return of the Spring Festival red envelope market. Sure enough, after the breakthrough, we reminded on 1/25: Bitcoin and Ethereum can speculate on the limited height of the rebound. The first stop loss for Bitcoin is 39,400, the second is 38,555, and for Ethereum, the stop loss is 2,168. Currently, they are all reminders of profit. PYTH and SUI have both increased by more than 50%.
Bitcoin
On the daily chart, it temporarily broke through the intersection of MA20 and MA60, showing some strength. However, we chose to reduce the position to reach our target of 43,600. The next pressure point is 44,444 to 45,500. The higher it goes, the greater the probability of a large bearish candle. Alternatively, leave some small positions to speculate on reaching 47,000 to 48,000 again. This is the routine of the mini bull market, but it will not immediately plummet. It will grind at a high level for a while before falling again (an ideal trend that also fits our description of the Spring Festival red envelope market).
4-hour chart
In the short term, we mentioned on 1/25 that a bullish shark pattern appeared, and there was a bullish divergence in the MACD. After the head and shoulders pattern appeared on the 1-hour chart, the price must return to 40,800 to 42,000 to be considered an effective return to the platform, and it would be a perfect move. Congratulations to friends who followed.
Currently, reaching 43,787 allows for locking in profits in batches, and the take-profit level is raised to 42,600. The next pressure point is the previous false breakthrough of the M-head neckline at 45,500. Only by breaking through this line will it go for another surge to 48,000 to 49,000 (a low probability speculation). But our spot strategy is not to catch the top or the bottom.
Support:
Resistance:
Ethereum
On the monthly chart, Ethereum has a typical doji star, and we have always been expecting a rebound in Ethereum. For the time being, it still seems possible (provided that Bitcoin continues to grind at a high level for a while and does not plummet quickly, and the Spring Festival red envelope market continues). Here, we can refer to the weekly chart in August 2020 when Ethereum broke through the triangle and then continued to rise after a pullback (the difference is that it was after the halving, which has not happened yet).
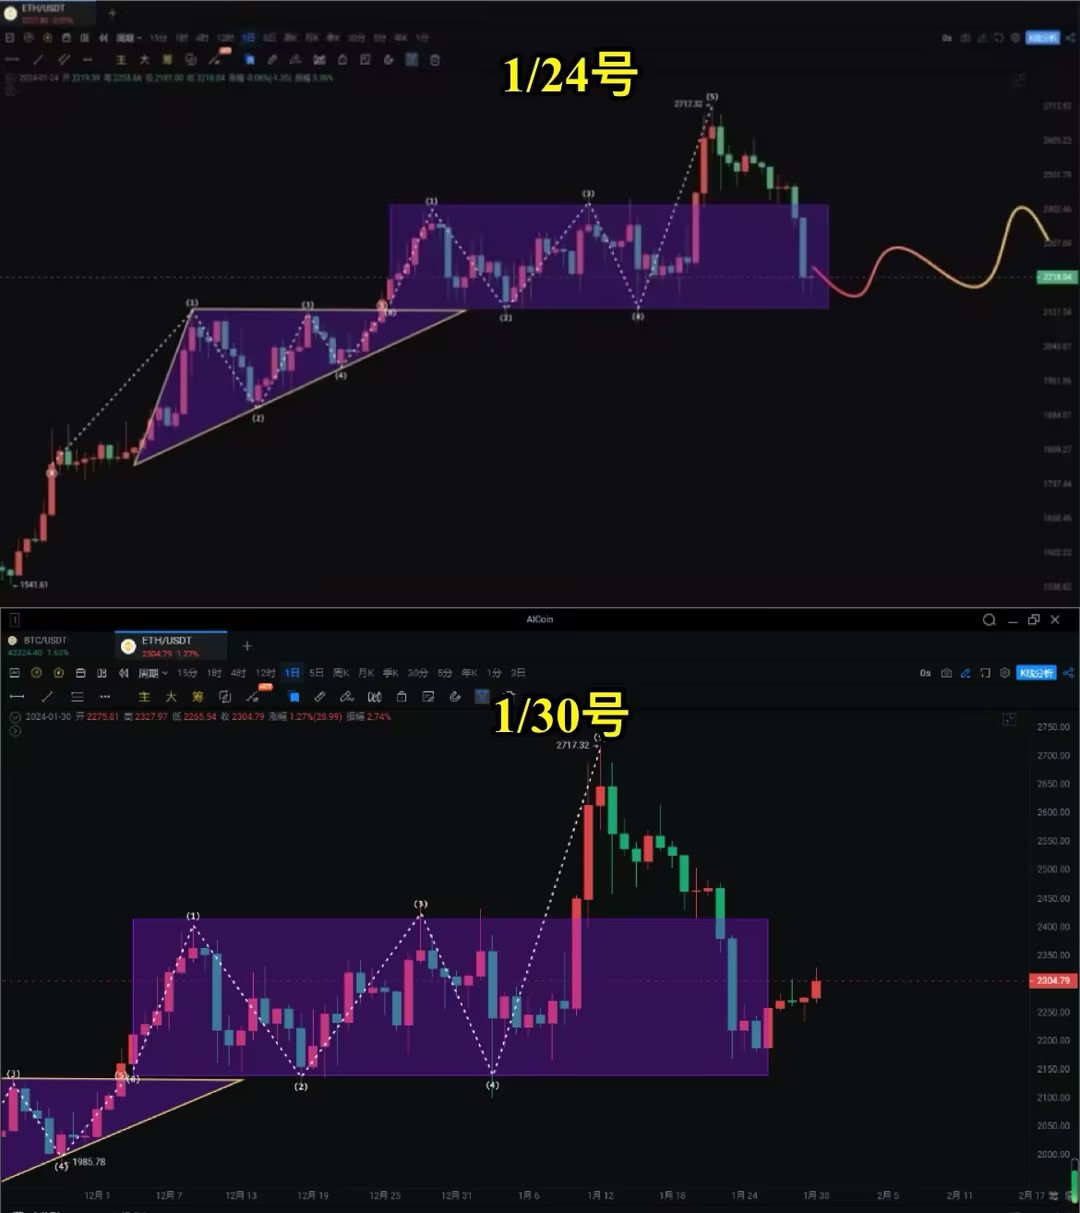
Returning to the market signal, the daily chart has returned to the bottom of the 2,100 range, showing clear support. We continue to look for a rebound market. Currently, reaching the Fibonacci 0.382 (2,337), the next step is to look at 2,400, which is also the top pressure of the range.
Keep an eye on Bitcoin for a second peak and then a fall back. Only when the mini bull market is solidified can we say that the mini bull market is over. Reduce positions in other varieties as needed. Bitcoin's daily chart shows a broadening triangle, and after a surge at a high level, the subsequent fall is a signal of consolidation.
Support:
Resistance:
The ETH/BTC exchange rate is something we have analyzed a lot. On the weekly chart, the increase last week was basically reversed, returning to the bottom of the 0.050 range, and the probability of a rebound is high.
If you like my views, please like, comment, and share. Let's go through the bull and bear markets together!!!
The article is time-sensitive and is for reference only, with real-time updates.
Focus on candlestick technical research, win-win global investment opportunities. WeChat public account: 交易公子扶苏
免责声明:本文章仅代表作者个人观点,不代表本平台的立场和观点。本文章仅供信息分享,不构成对任何人的任何投资建议。用户与作者之间的任何争议,与本平台无关。如网页中刊载的文章或图片涉及侵权,请提供相关的权利证明和身份证明发送邮件到support@aicoin.com,本平台相关工作人员将会进行核查。