Click to watch the video: Master Chen's 1.30 Video: Is Consolidation Digging a Buying Point? Review of Historical Market Gains
Bitcoin has been rising these days. I have mentioned that if you want to get involved in spot trading, you can buy directly. Now it's almost reaching the key resistance level I mentioned before, 44.4K. Today, let's talk about the basis for holding long-term profits.
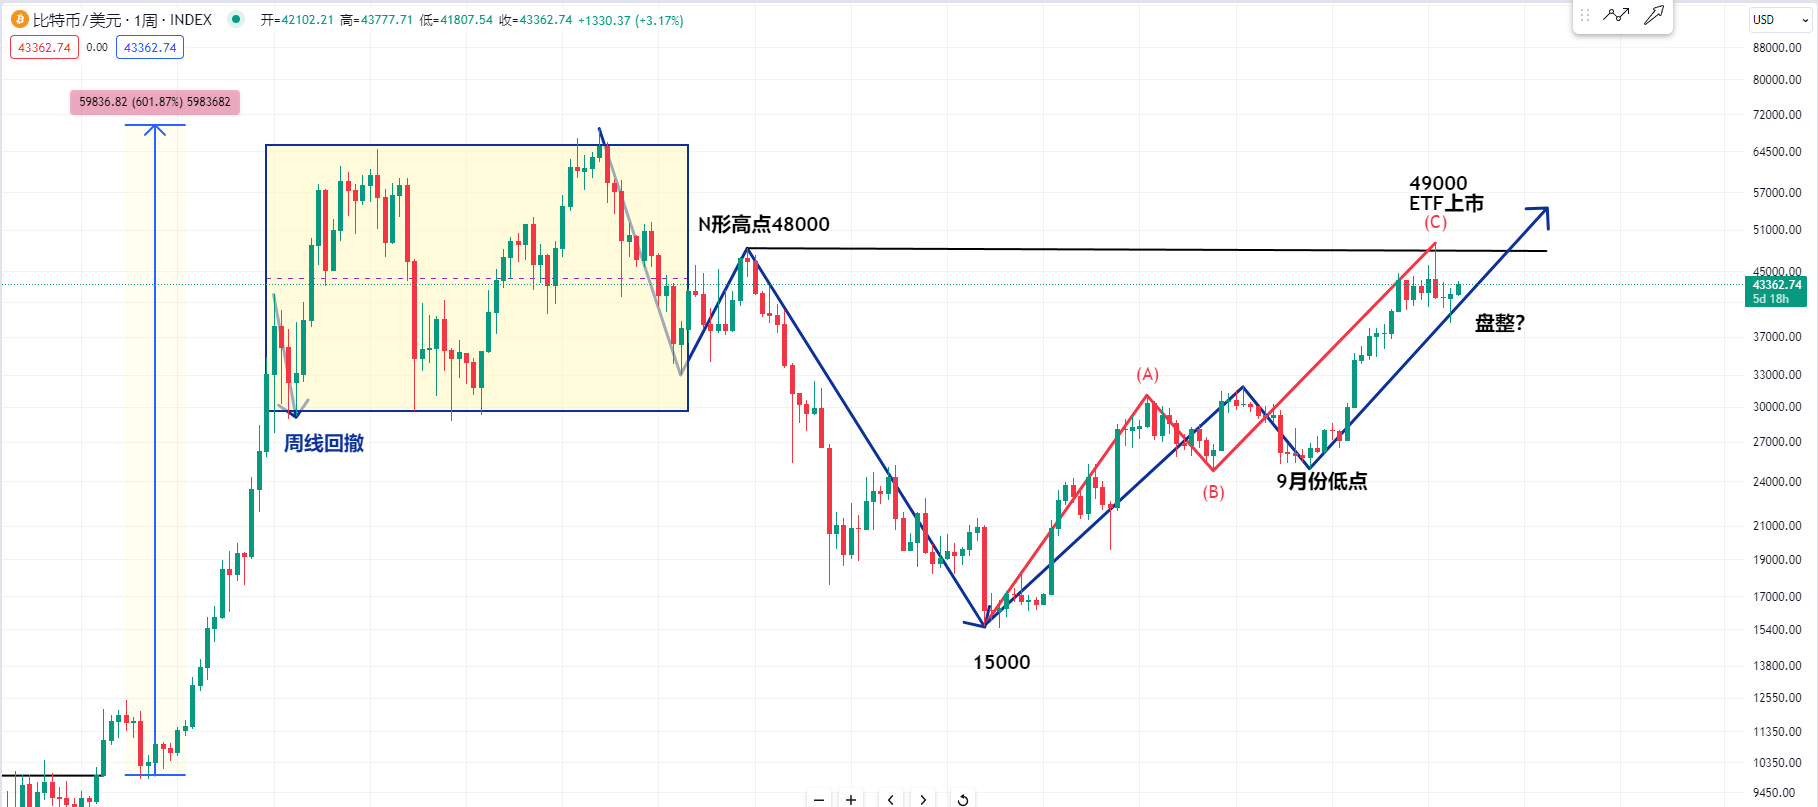
Let's first take a look at the weekly chart of Bitcoin. The last time the Bitcoin spot ETF was listed or the price was around 49,000. Three months before that, at the low point, I told everyone that it was possible for Bitcoin to break through the N-shaped high point on the weekly chart, around 48,000, before the halving of production.
At that time, I shared in the video that there was at least a 70% increase. Now, I have been looking to see if I can hold on to higher historical highs for long-term profits, whether it's long positions at 25,000 or bottom-fishing long positions below 20,000.
I believe that the low point of 15,000 will definitely not fall further. However, I have seen some bears in the market who believe that Bitcoin's current position forms an ABC pattern and think that Bitcoin will have a large C wave. Some opinions even suggest that the C wave may not necessarily fall below this low point. But my view is different. Even in the worst case, I don't know if this position will fall.
But in the past few days, it seems like it doesn't want to fall at all. So I think there won't be a C wave. It's possible that it's just a wave of upward movement, and we are currently in the structure of the third wave. We are currently in the consolidation of the second wave within the third wave. Especially for friends who still want to enter the market, we need to be cautious about whether this position is consolidating.
Now everyone knows that the time or price of the Bitcoin spot ETF listing is around 49,000. We also know that there is a lot of capital continuously flowing into Bitcoin, possibly also buying spot Bitcoin. Is it possible for the profits of our previous long positions to continue to reach higher historical positions?
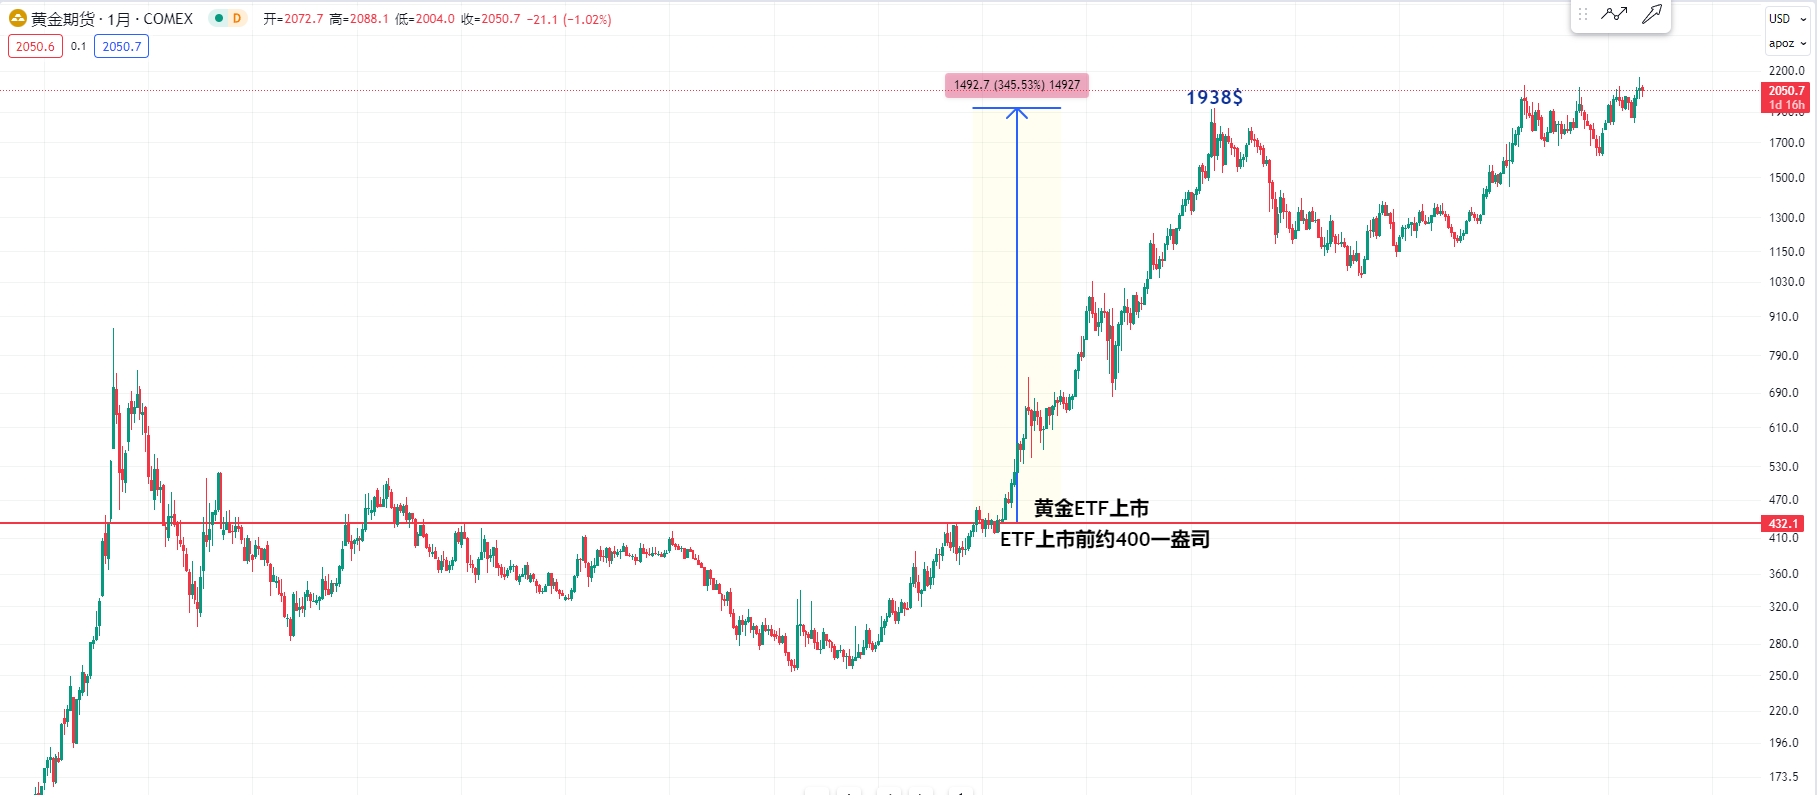
Let's take a look at the historical chart of the gold spot ETF. The price was around $400 per ounce at that time. After the spot ETF was listed, it rose to the high point in 2011, which was around $2,000 per ounce. So the increase was close to 4 times.
So I personally believe that the increase in Bitcoin will definitely be greater than that of gold, at least not less than the increase of over 300%. Is it possible for even greater increases to occur?
Let's go back to the Bitcoin weekly chart and see that the current 48,000 N-shaped high point has already been reached. I have also mentioned this before.
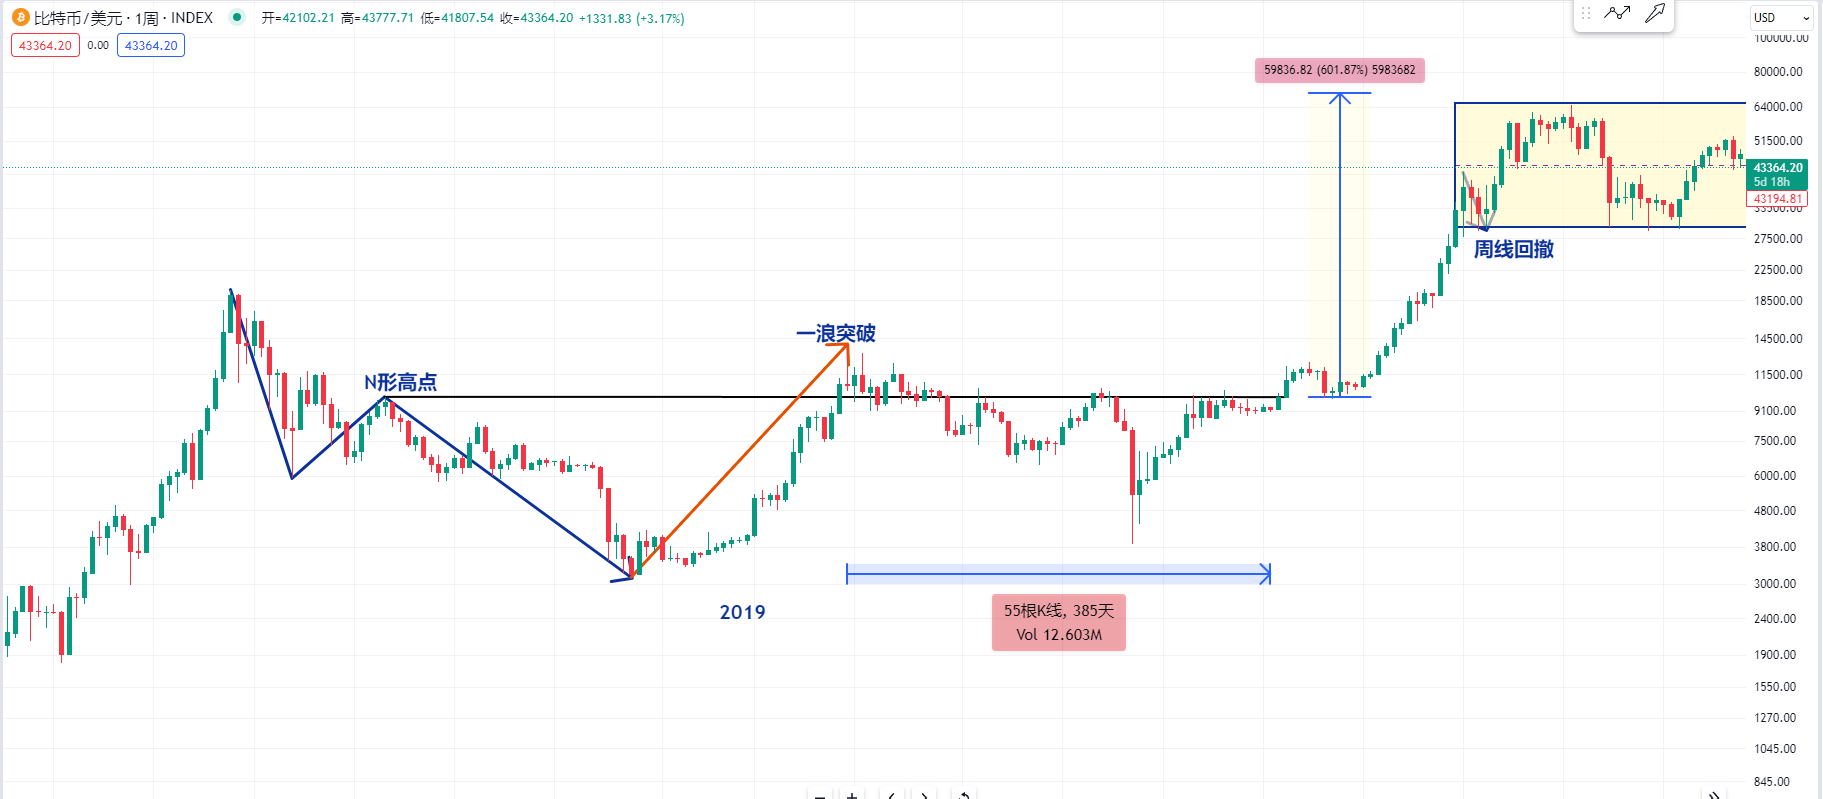
We can observe the bear market of Bitcoin from 2017 to 2018. At that time, at this N-shaped high point, it broke through in the first wave and then consolidated for almost a year. Calculated from this N-shaped high point, the price rose by close to 600%.
Now, my personal view is that if Bitcoin breaks through this 48,000, if you are still hesitating about buying spot, for long-term positions, you can buy directly without worrying about short-term declines. If it goes straight up from this position, you may miss out on future profits.
So I believe that if Bitcoin breaks through this 48,000 after 2024, the future increase could completely exceed the 600% increase in 2020. Because some friends also talk about the decreasing increase in each bull market in Bitcoin's history, or the decreasing magnitude of the increase.
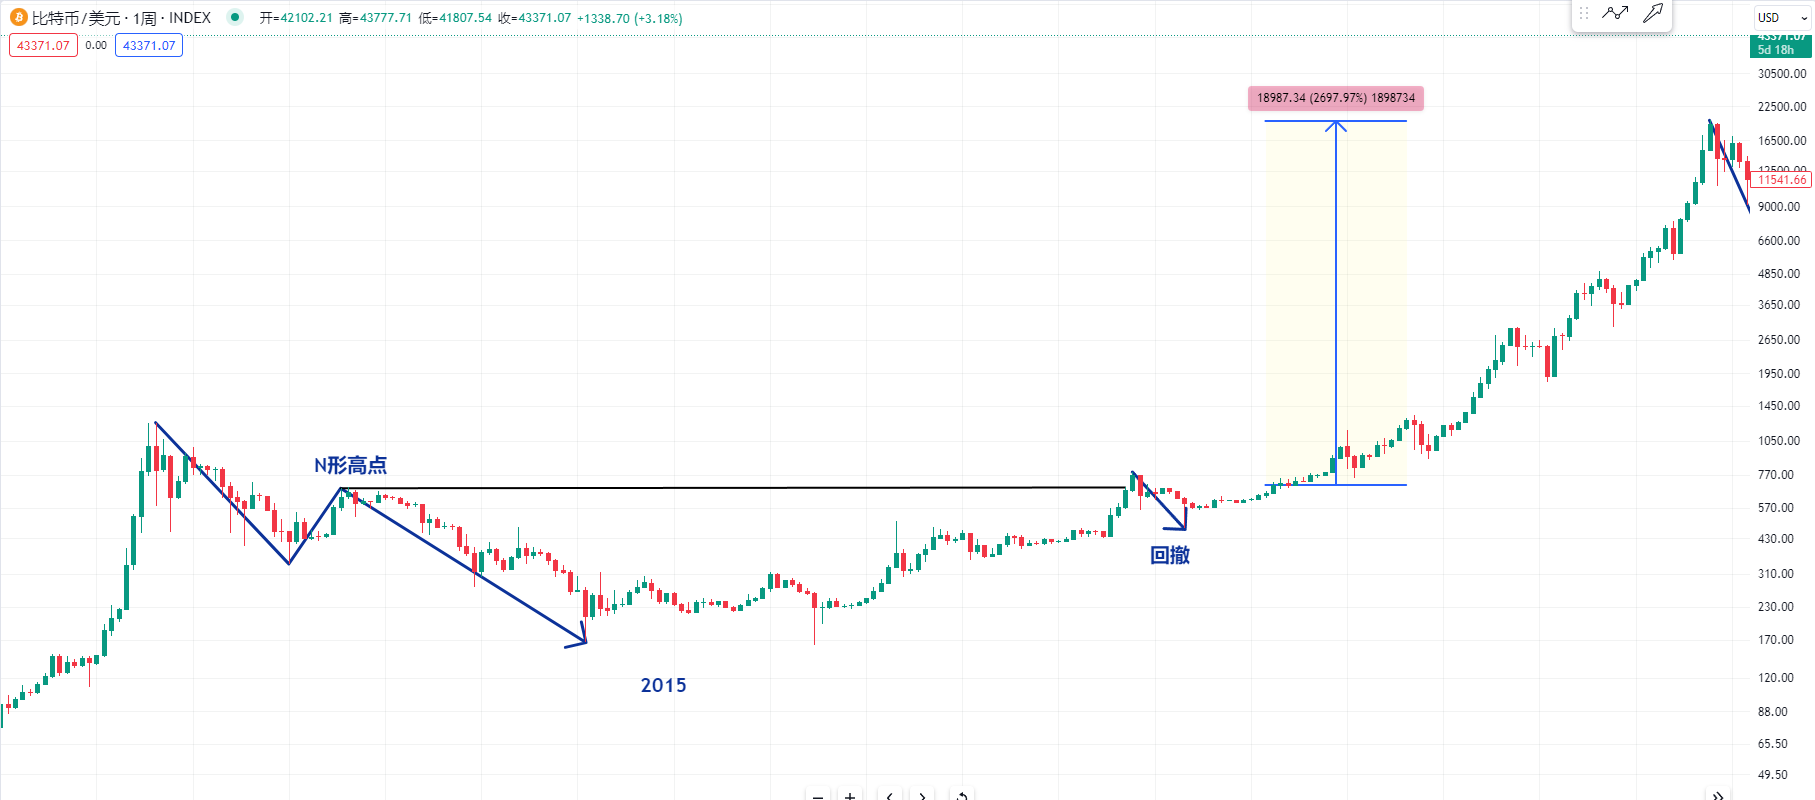
Or we can observe that before the halving of production in 2015, Bitcoin broke through the N-shaped high point of the bear market from 2013 to 2014. After breaking through, there was a retracement, and then from this point, it rose by nearly 30 times.
Then in 2020, the N-shaped position rose by 6 times. The returns of each bull market are decreasing, or the magnitude of the increase is also decreasing. Some friends are worried whether the current position will really have a 700% increase. But I think the current environment is different. We need to think about why the increase in 2020 was only 7 times.
You should know that at that time, it was because of the quantitative easing by the Federal Reserve after the epidemic, and the US dollar was printed a lot. The inflation in the United States was very high. Bitcoin's increase in 2020 started in January 2021, and the market had expectations that the Federal Reserve might start raising interest rates.
So there was a weekly-level retracement at this position, and I also thought about the different market environment. It's possible that the main force also saw that if the market continued to rise, and the Federal Reserve started raising interest rates, some institutions or large holders might sell.
So it's possible that the main force deliberately suppressed the price of Bitcoin at this level, and then bought a lot of spot below 20,000. If the environment is so good, with the addition of ETF institutions, funds will continue to buy, or retail investors will continue to enter, including the future rate cuts by the Federal Reserve, or Bitcoin is about to face the halving of production, so many positives. The overall environment is different from 2020.
I believe that if Bitcoin breaks through this 48,000, the increase in the future will definitely exceed the increase in 2020. If it increases tenfold, starting from 48,000, it's not impossible for Bitcoin to rise to $500,000.
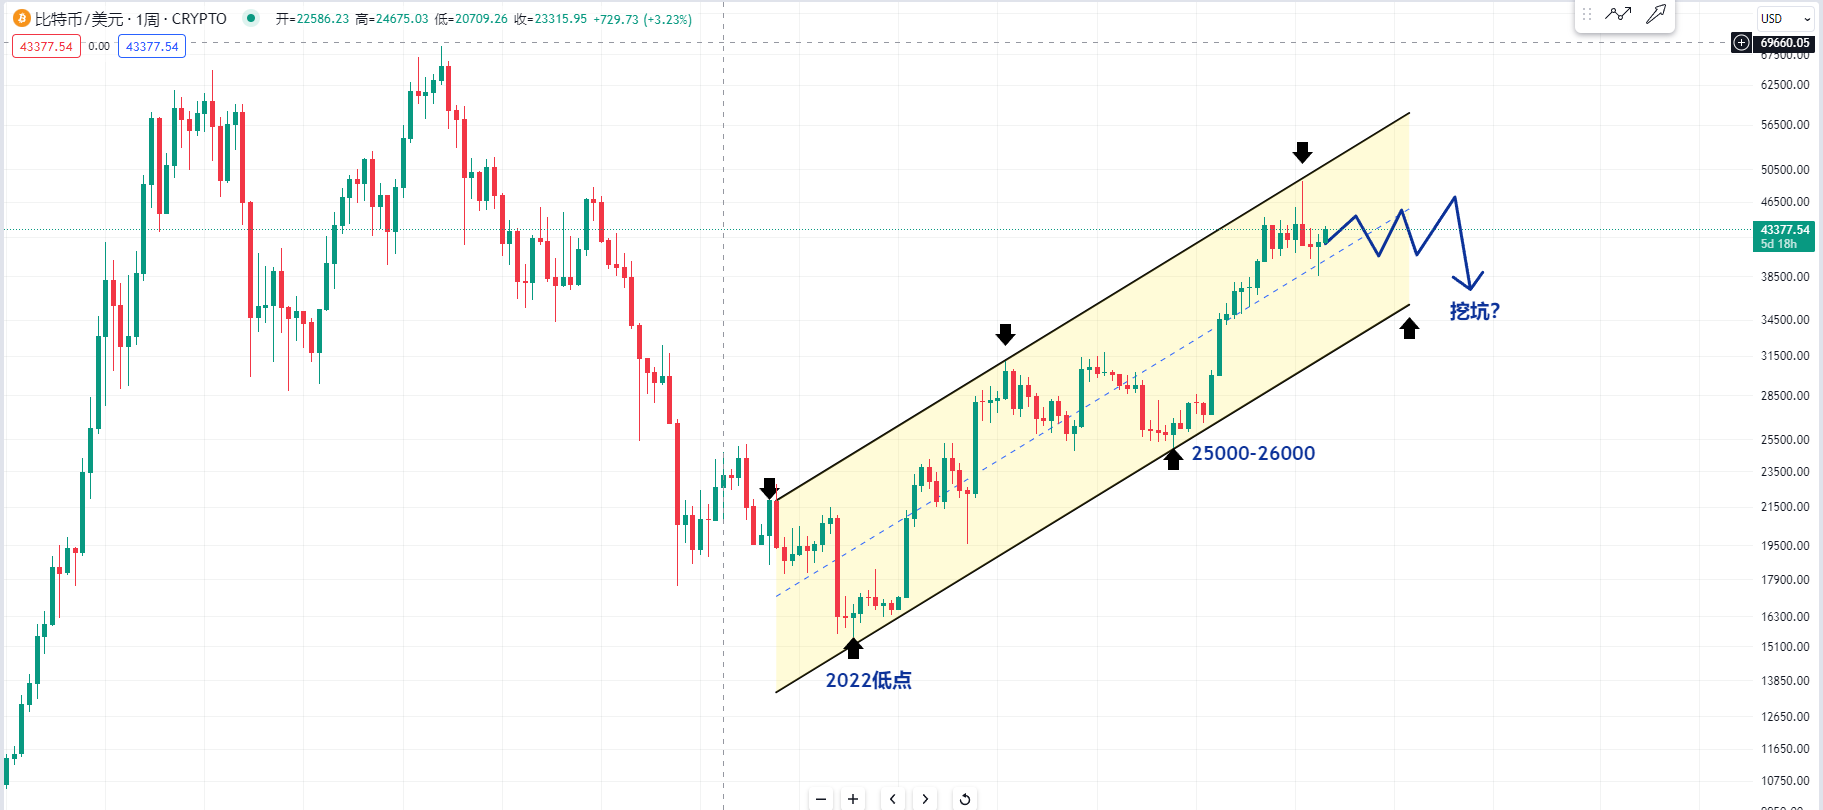
Let's take a look at the upward channel of Bitcoin's weekly chart. We can see the two low points of Bitcoin in 2022, and connecting them forms an upward trend line. The position of 25,000 to 26,000 is also a buying point.
However, I also mentioned in the video a few days ago that it's not ruled out that there will be a period of consolidation at the current position. We need to be careful. If a buying point appears after the consolidation, then we may continue to move upward. So for short-term positions, we need to be careful and see if there will be a next buying point after the consolidation.
For more strategies, you can join the live trading.
_Candlesticks are king, trends are emperor. I am Master Chen, focusing on BTC, ETH spot and contract trading for many years. There is no 100% method, only 100% following the trend. Daily macro analysis articles and technical analysis review videos are updated on the entire network. _ Friendly reminder: Only the public account of the column (as shown in the picture above) is written by Master Chen. The advertisements at the end of the article and in the comments are not related to the author. Please be cautious in distinguishing between true and false. Thank you for reading._
免责声明:本文章仅代表作者个人观点,不代表本平台的立场和观点。本文章仅供信息分享,不构成对任何人的任何投资建议。用户与作者之间的任何争议,与本平台无关。如网页中刊载的文章或图片涉及侵权,请提供相关的权利证明和身份证明发送邮件到support@aicoin.com,本平台相关工作人员将会进行核查。


