I, a commoner, have been working hard in Nanyang, striving to survive in the chaotic market, not seeking fame in the coin circle, but seeking to be true to myself. I really like a quote from Robert T. Kiyosaki, "The love of money is the root of all evil, and poverty is the root of all evil." I believe everyone in the coin circle is here to profit. I hope that in the days to come, my market analysis can help everyone reap substantial gains in the coin circle. The sea of learning is boundless, and knowledge is endless. Continuously increasing one's knowledge and combining it with one's own trading habits is the only way to survive and achieve one's ambitions in the coin circle.
First, let's analyze the recent market trends of Bitcoin, Ethereum, Ordin, and Manta.
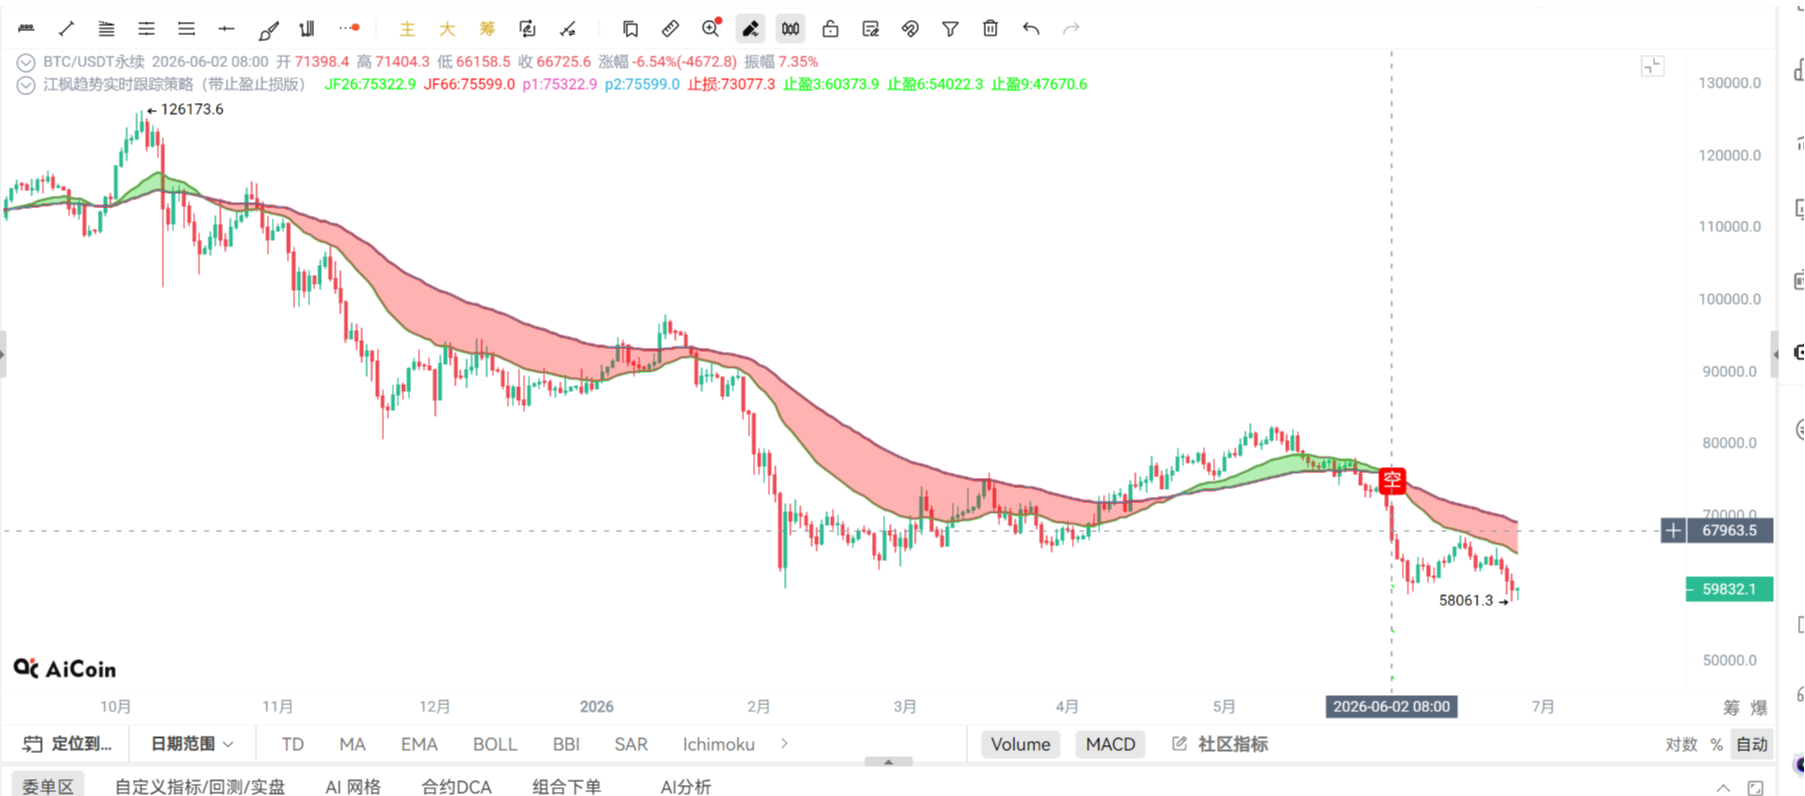
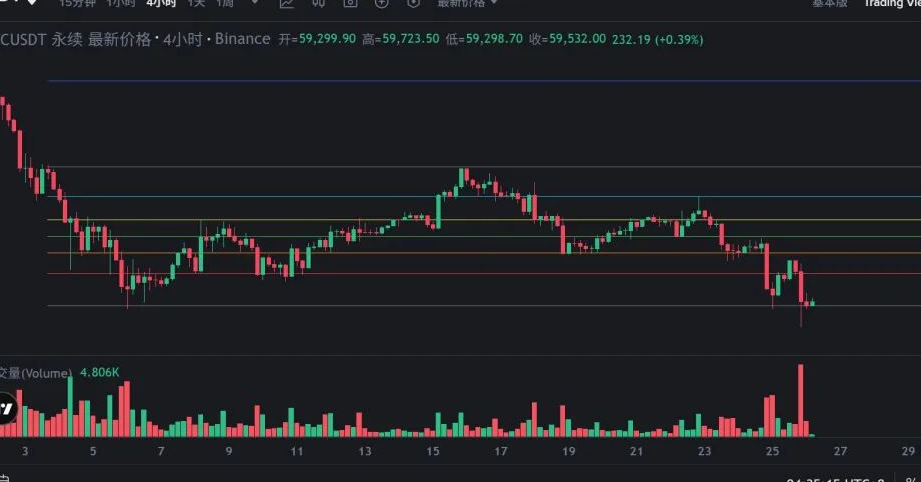
Bitcoin, BTC dropped from 42,000 to a low near 39,400 yesterday. From the trend, it is in line with my expectations. Looking at the daily chart, it has consecutively dropped below the MA30 and MA60 moving averages, but has not yet dropped below the MA120 moving average. Overall, it is in a downtrend. However, as I mentioned before, if BTC drops to around 38,000 near the MA120 moving average, it is a bold opportunity to buy the dip because the MA120 moving average support will inevitably lead to a certain degree of rebound, which is unquestionable. Looking at the 4-hour chart, currently, the three lines are too far from the coin price, and the Bollinger Bands have opened up, but there is no significant increase in trading volume. When there is no significant increase in trading volume, this type of Bollinger Bands is likely to induce a bearish trend. Therefore, it is more appropriate to buy the dip in the short term. Of course, if there is a second drop to 38,500, it would be a good position to add to the position. Looking at the 1-hour chart, the three lines have also dropped, but it is not advisable to blindly go short. If there is a long period of sideways movement at this level, it indicates a temporary bottom. There are two possible trends, and regardless of which one, I suggest holding long positions at this level rather than going short. The first trend is a rebound near 41,300, followed by a second retracement below 39,000 and 38,000 to find support, which is the likely scenario based on the current V-shaped trend, followed by a temporary rebound to around 44,000. The second trend, which I think is very likely, is a prolonged sideways movement between 39,500 and 40,500, which also indicates a repair of the moving averages and signs of a rebound. Therefore, my suggestion is: close the previous short positions, as the current market is in a phase of short-term bearish trend release. It is advisable to hold some long positions, or place long positions at 38,500, and the target for the uptrend is around 43,800-44,500.

Ethereum, Ethereum dropped from 2,700 to 2,300. From the trend, it is a weak downward trend. Looking at the daily chart, it has only dropped below the MA30 moving average, and the MA60 moving average near 2,300 has not been breached. I am paying attention to the support at 2,300. If it breaks, I suggest placing long positions near the MA120 moving average at around 2,150, which is more prudent. Looking at the 4-hour chart, it is in a downtrend, and during the downtrend, there has been a moving average crossover forming a death cross, while the price is at the lower Bollinger Band, but the trading volume has not increased significantly. In the short term, the probability of a rebound to the middle band is still high. If the support at 2,300 is broken, it is not advisable to go long on Ethereum, and the support to watch is near 2,100. Looking at the 1-hour chart, it is also in a downtrend. Similarly, during each downtrend, there will be a certain degree of rebound, so I think it is worth buying the rebound at this level. Therefore, my suggestion is: for Ethereum, go long at this level, with a stop loss at 2,300. Once 2,300 is broken, it is advisable to place long positions at 2,150, and the uptrend target is to be determined.

Ordin, looking at the daily chart, the trend is extremely poor. Looking at the 4-hour chart, it is in a downtrend, and the moving averages have formed a death cross. Currently, there is no sign of a significant rebound in the 4-hour chart. If there is a chance to go near 58, it is possible to buy a little and seize a rebound. Looking at the 1-hour chart, the three lines are under pressure, indicating a bearish trend. Looking at the hourly chart, it feels very difficult to have a significant market movement without standing above 66. Therefore, my suggestion is: if you want to buy the dip, it is advisable to buy near 58 and add near 55. The risk of buying the dip at this level is very high, so it is not advisable.
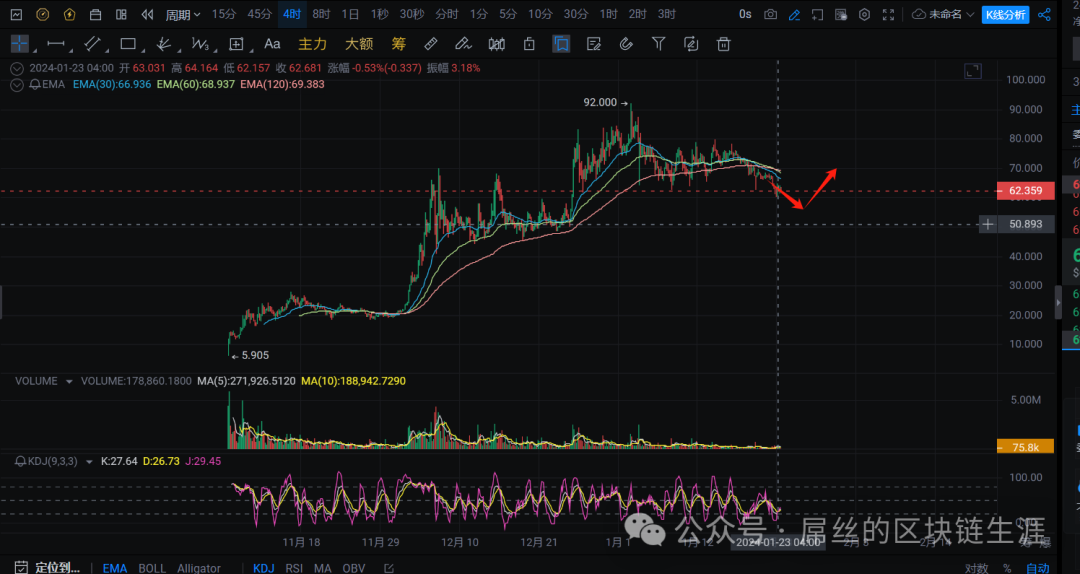
Manta, I am more inclined to recommend buying this coin recently for several reasons. It is somewhat similar to the previous TIA, belonging to a modular blockchain in the same sector. TIA's performance after listing was good, and the total issuance and circulation are similar, possibly making it a dark horse among new coins. Looking at the expectations of its listing, the price is fluctuating between 2 and 2.8, and there has not been significant selling pressure after listing, indicating strong control by the main force. Therefore, my suggestion is: as long as this coin does not break $2, it can be held long, and once it breaks $3, it can be boldly chased for an increase. If it falls below $2, it is advisable to exit, and it is worth considering buying at around $2.25.

All the above suggestions are personal opinions and do not constitute investment advice. There are risks in the coin circle, so caution is advised.
If you need to join the group, you can add the assistant's WeChat.


免责声明:本文章仅代表作者个人观点,不代表本平台的立场和观点。本文章仅供信息分享,不构成对任何人的任何投资建议。用户与作者之间的任何争议,与本平台无关。如网页中刊载的文章或图片涉及侵权,请提供相关的权利证明和身份证明发送邮件到support@aicoin.com,本平台相关工作人员将会进行核查。