First, let's look at the trend of BTC yesterday. It directly formed a V-shaped reversal, choosing the strongest bullish trend mentioned in yesterday's article, and pulled back to the 30-minute consolidation zone without triggering a sell signal. The upcoming pullback will present another opportunity to get on board, similar to a second buy signal. Following the red trend mentioned in yesterday's article, it is highly probable that BTC will break to a new high again.
Next, let's take a look at SOL, which had been surging previously but has now temporarily cooled off and is experiencing a pullback. It has oscillated from its peak of 126 back to around 100. From a higher timeframe perspective, SOL's upward movement is not over, and the pullback is just a way to gather strength.
While SOL is gathering strength during the pullback, the ETH series is starting to take over the upward trend. Before analyzing further, let's review a screenshot from the article on December 20th:
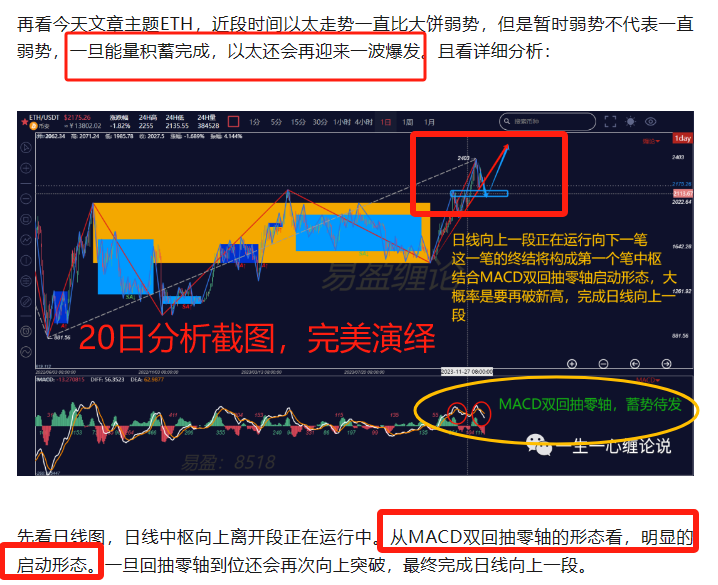
Currently, the trend of Ethereum perfectly replicates the analysis and projection from December 20th! The daily chart is growing upward as expected, with the current price at 3380, just a step away from the previous high of 3403. Breaking to a new high is almost certain! The key is the strength after breaking the high, which will determine how high Ethereum will extend upward.
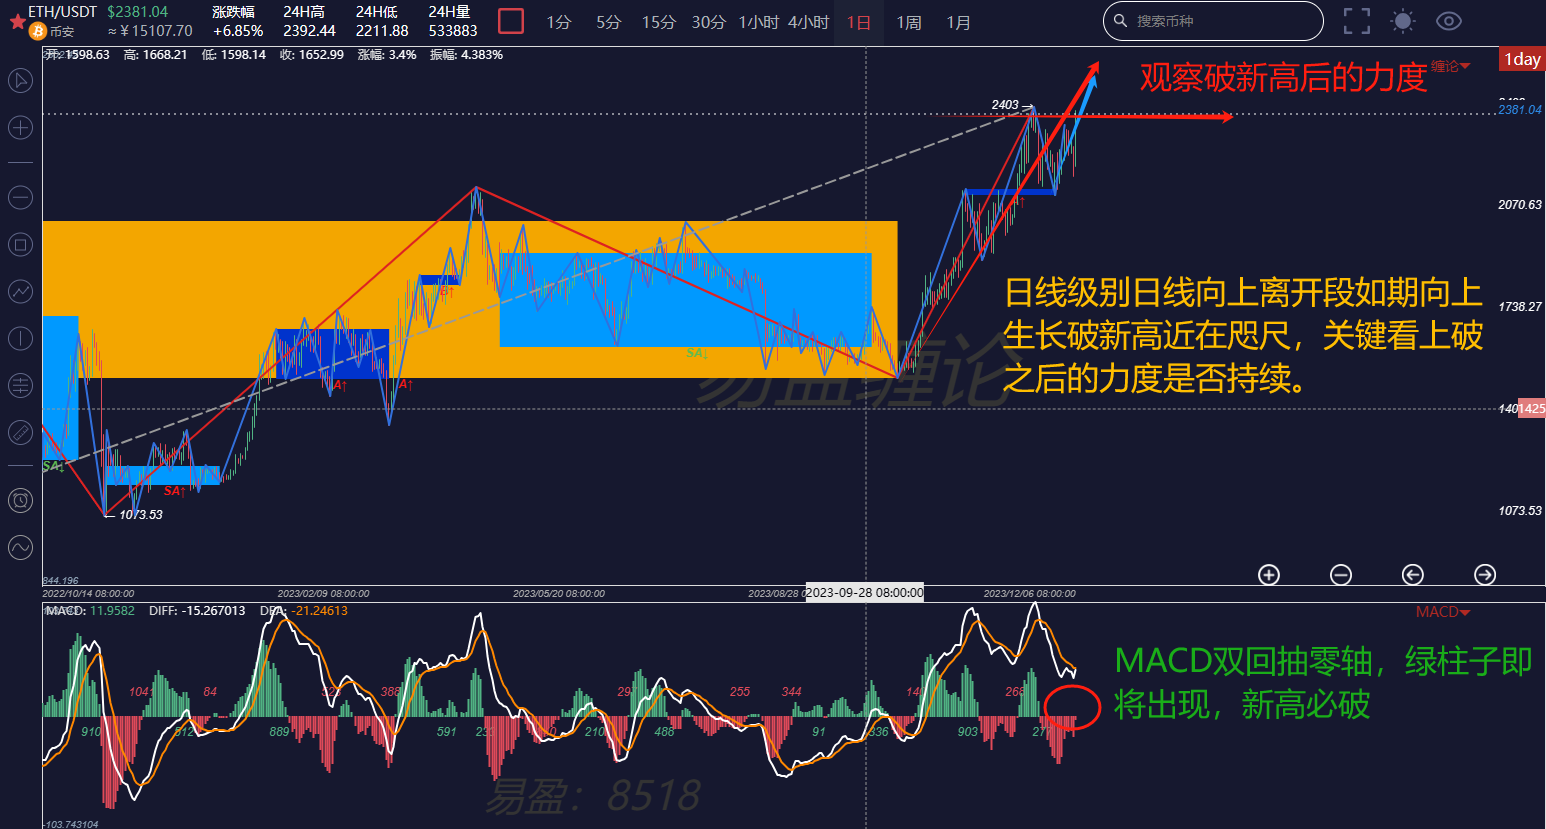
First, let's look at the daily chart, which is almost identical to the projection from the 20th. A green bar is about to appear. As for the height of this uptrend, it can be referenced to the 2500-3000 range in the left daily chart's sell zone. Although the uptrend process is tumultuous, it does not affect the final result.
This is the theoretical confidence of the K-line theory that gives us the confidence to operate!
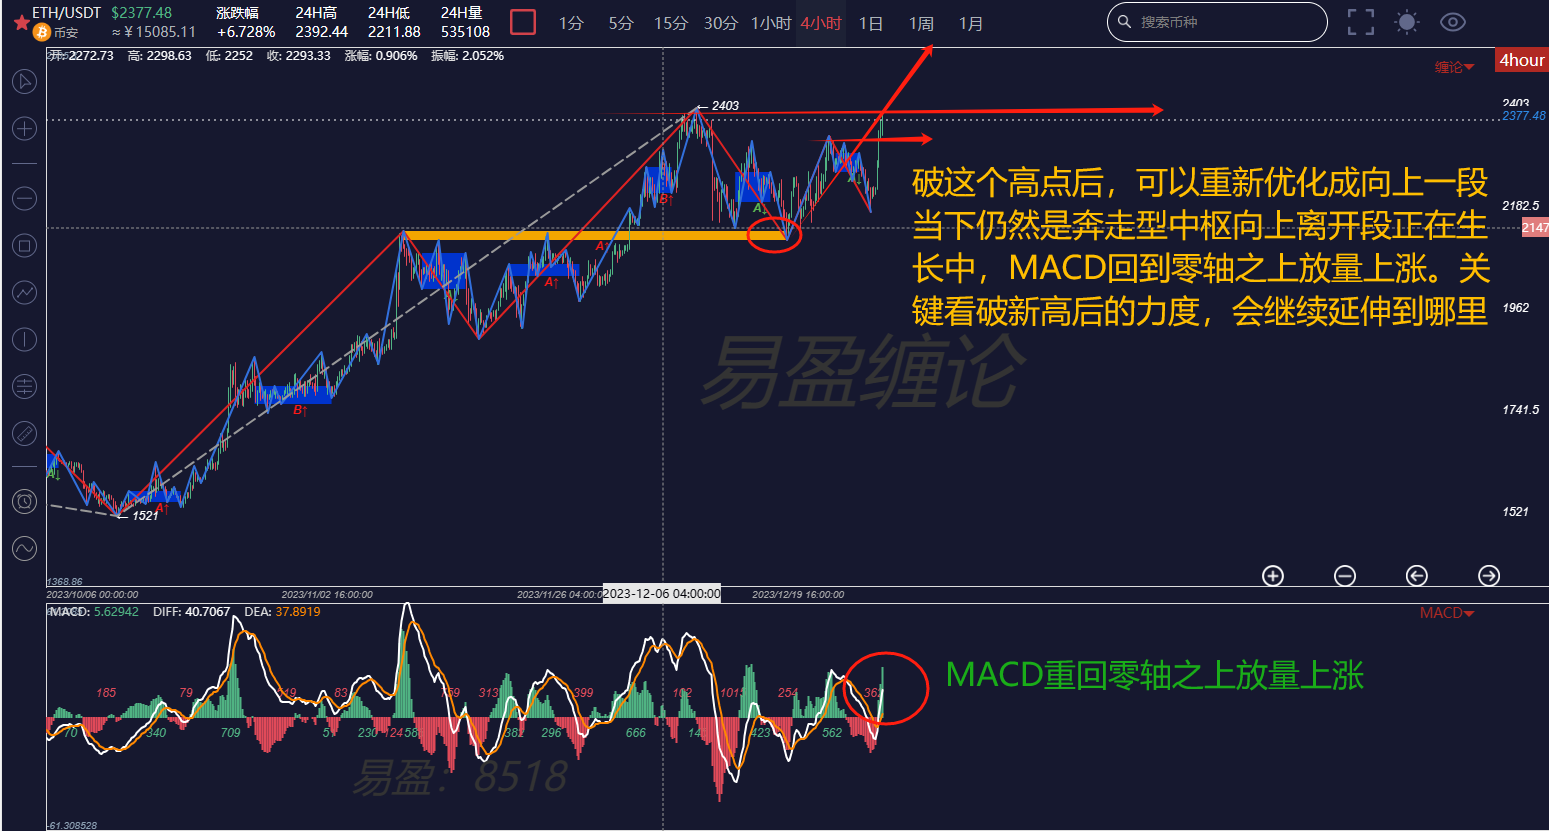
Now, let's look at the 4-hour chart. The biggest characteristic of an upward-running consolidation zone is that the previous high must be broken! Those who have already boarded should hold onto their chips and sit tight.
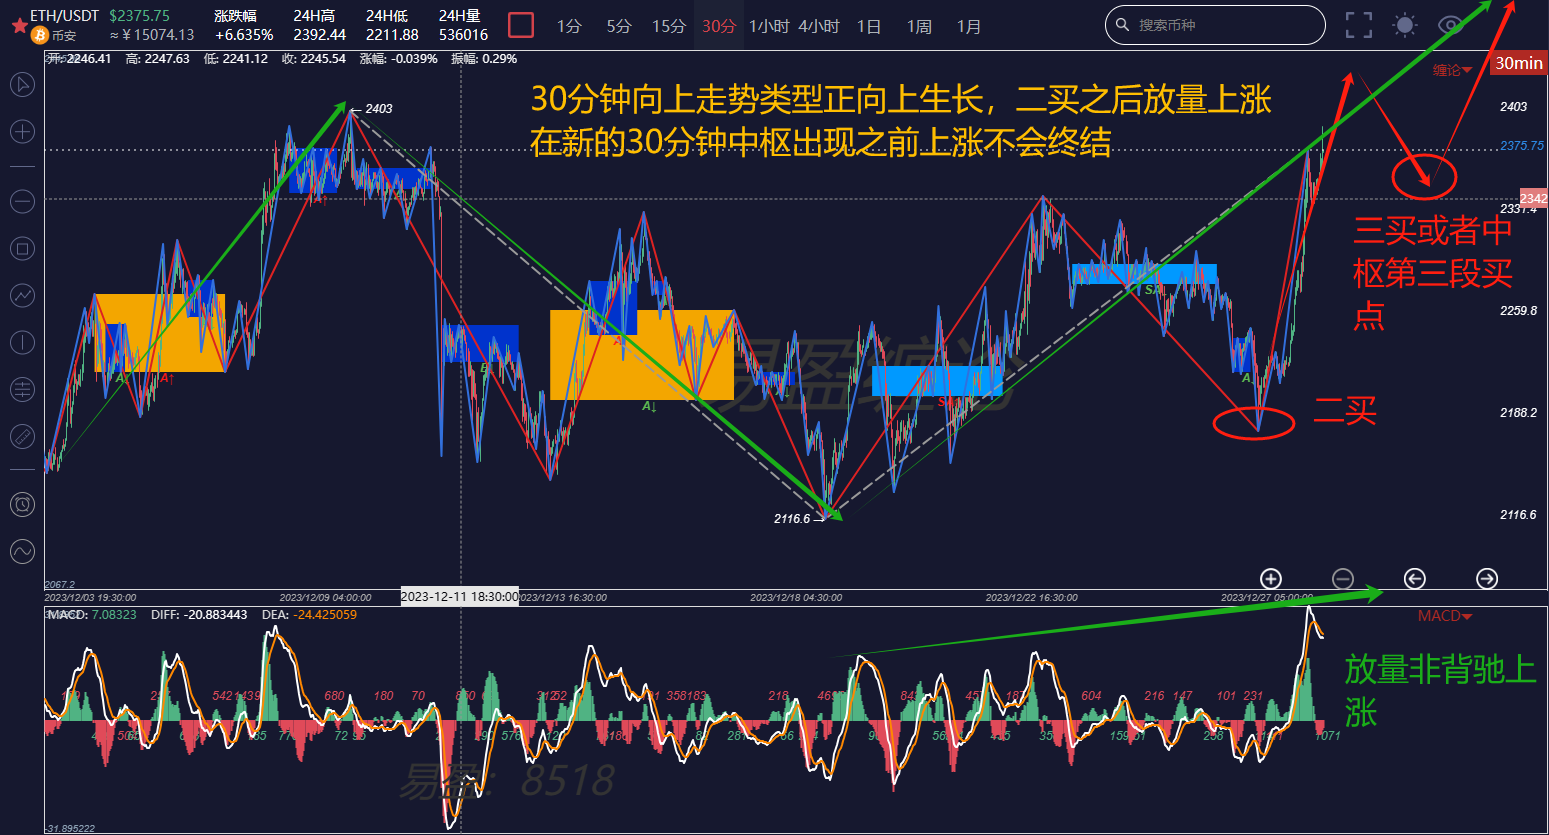
Finally, let's take a look at the 30-minute chart. After the appearance of a second buy signal, there was a direct volume surge. Therefore, the uptrend will not end before a new 30-minute consolidation zone appears. Once the buy point marked in the chart appears, there will still be an opportunity to get on board.
Witness the miracle of strength!!!
If you are interested in K-line theory and want to obtain learning materials for free, watch public live broadcasts, participate in offline K-line theory training camps, improve your trading skills, build your own trading system to achieve stable profitability, and use K-line theory to timely exit at the peak and buy at the bottom, you can scan the QR code to follow the public account, send a private message to obtain and add the WeChat account to join the group for learning!

免责声明:本文章仅代表作者个人观点,不代表本平台的立场和观点。本文章仅供信息分享,不构成对任何人的任何投资建议。用户与作者之间的任何争议,与本平台无关。如网页中刊载的文章或图片涉及侵权,请提供相关的权利证明和身份证明发送邮件到support@aicoin.com,本平台相关工作人员将会进行核查。


