Original Title: "2023 Yearly On-chain Review"
Author: Checkmate, Glassnode
Translation: Elvin, ChainCatcher
Abstract
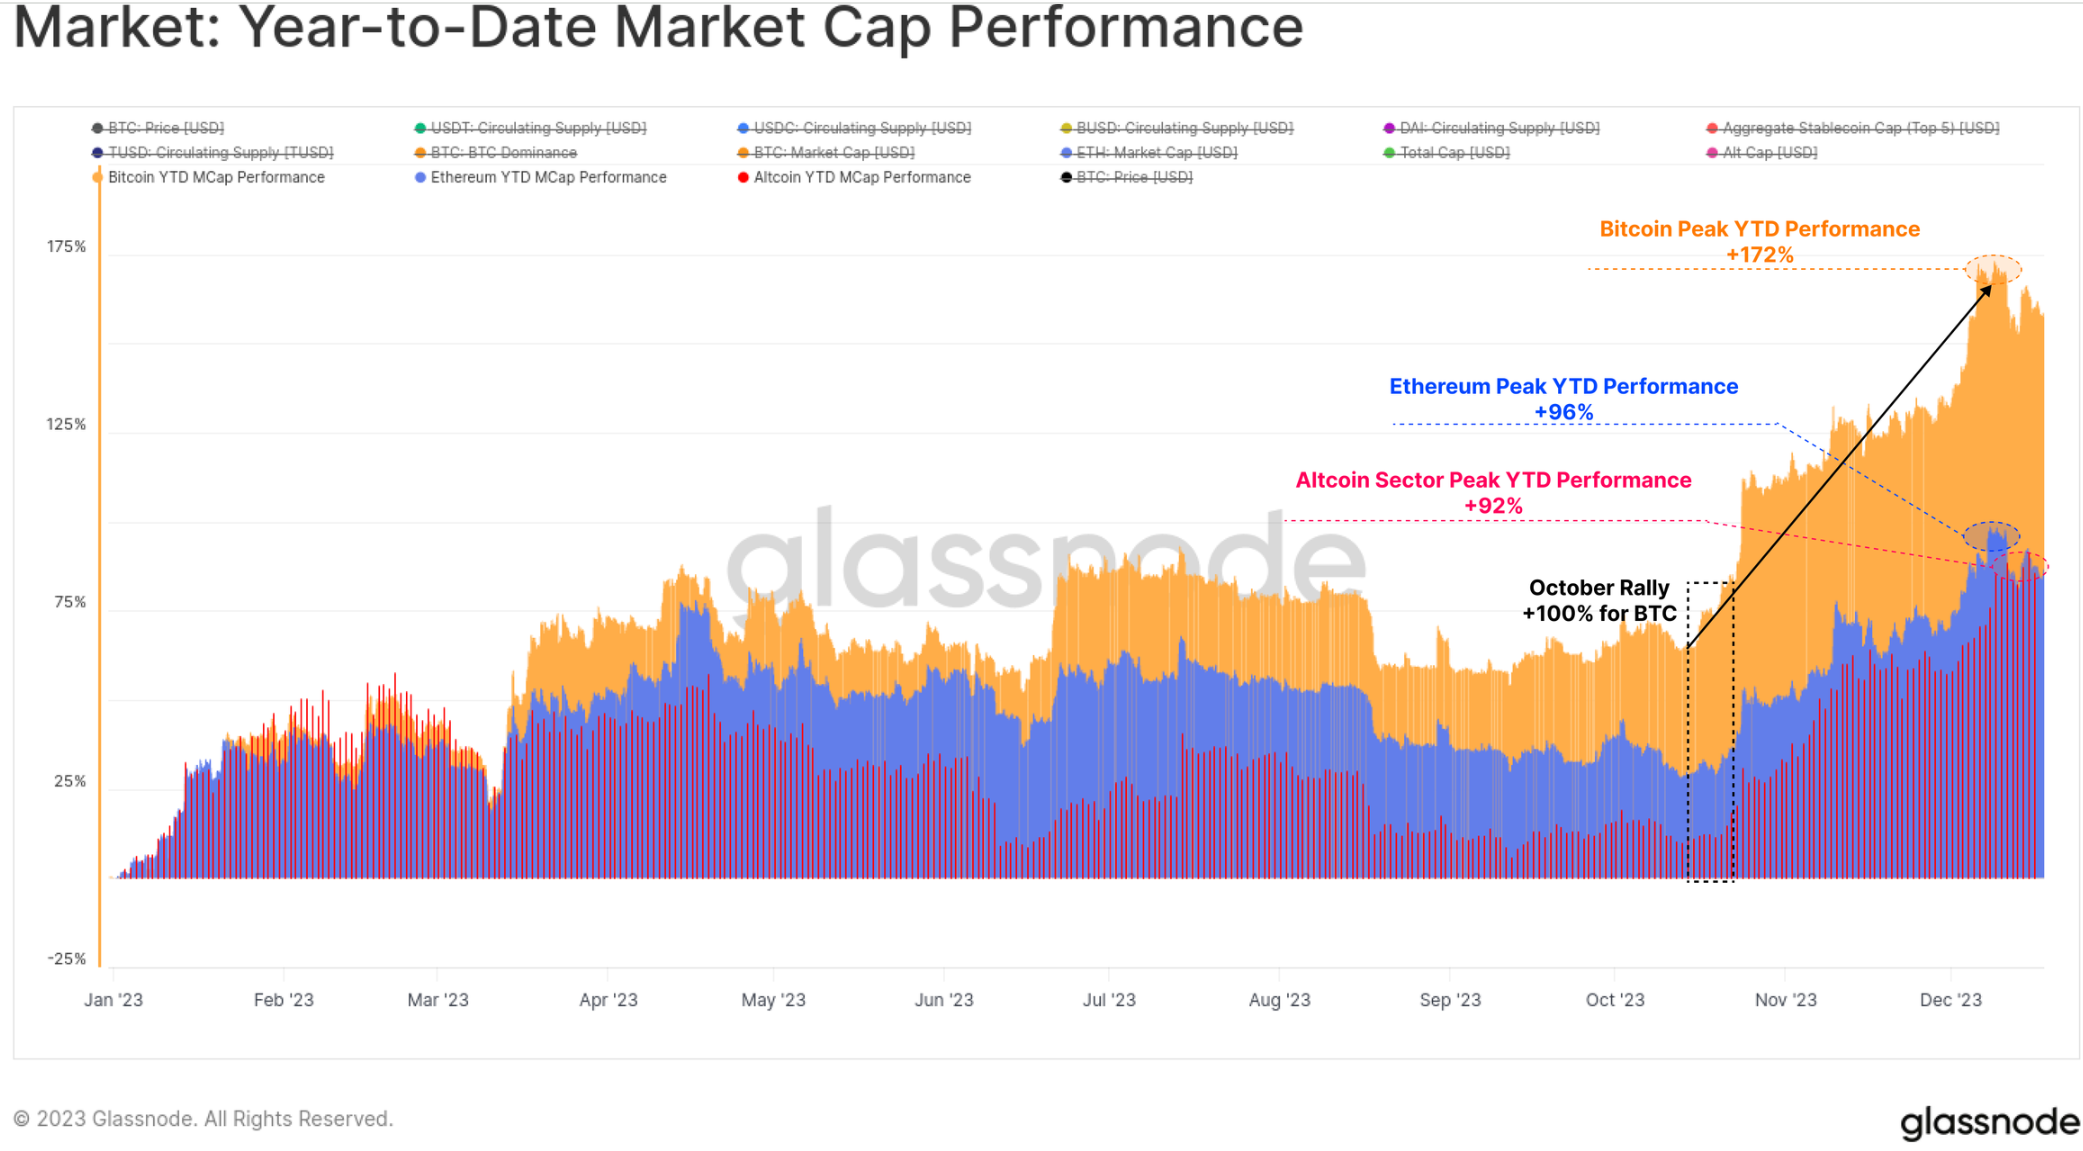
1. 2023 has been an incredible year for digital assets, with Bitcoin rising over 172%, experiencing a maximum drawdown of less than 20%, and seeing net capital inflows into BTC, ETH, and stablecoins.
2. The market has broken several important technical milestones and on-chain pricing models this year, with October being a major hub for institutional capital flows.
3. Currently, the supply of Bitcoin held by long-term holders has almost reached its historical high, and the vast majority of Bitcoin is now in a profitable state.
4. The market structure is undergoing significant changes, such as Tether re-establishing the dominance of stablecoins, CME futures disrupting Binance, and significant growth in the options market.
In this final issue of the year, we will take a whirlwind tour of the changes that have occurred on-chain this year. We will explore how the landscape of Bitcoin, Ethereum, derivatives, and stablecoins has evolved in 2023, and how this sets the stage for an exciting path to the future.
2023 has been an extraordinary year for digital assets, with Bitcoin's market value reaching a peak of 172% growth. Other parts of the digital asset ecosystem have also had a strong year, with Ethereum and the broader altcoin space seeing a market value increase of over 90%.
This highlights the continued rise in dominance of Bitcoin, which is often seen as a period of recovery from a long-term bear market (e.g., 2021-22). In particular, Ethereum, despite the successful release of the Shanghai upgrade and the development of the L2 ecosystem, has had a somewhat slower start, with the ETH/BTC ratio dropping to around 0.052, a multi-year low.
While the performance of digital assets throughout the year has been significantly better than traditional assets such as stocks, bonds, and precious metals, the rebound since the end of October has accounted for most of the gains. It first broke through the important psychological price level of $30,000, as well as many other important price levels.
Small Drawdowns
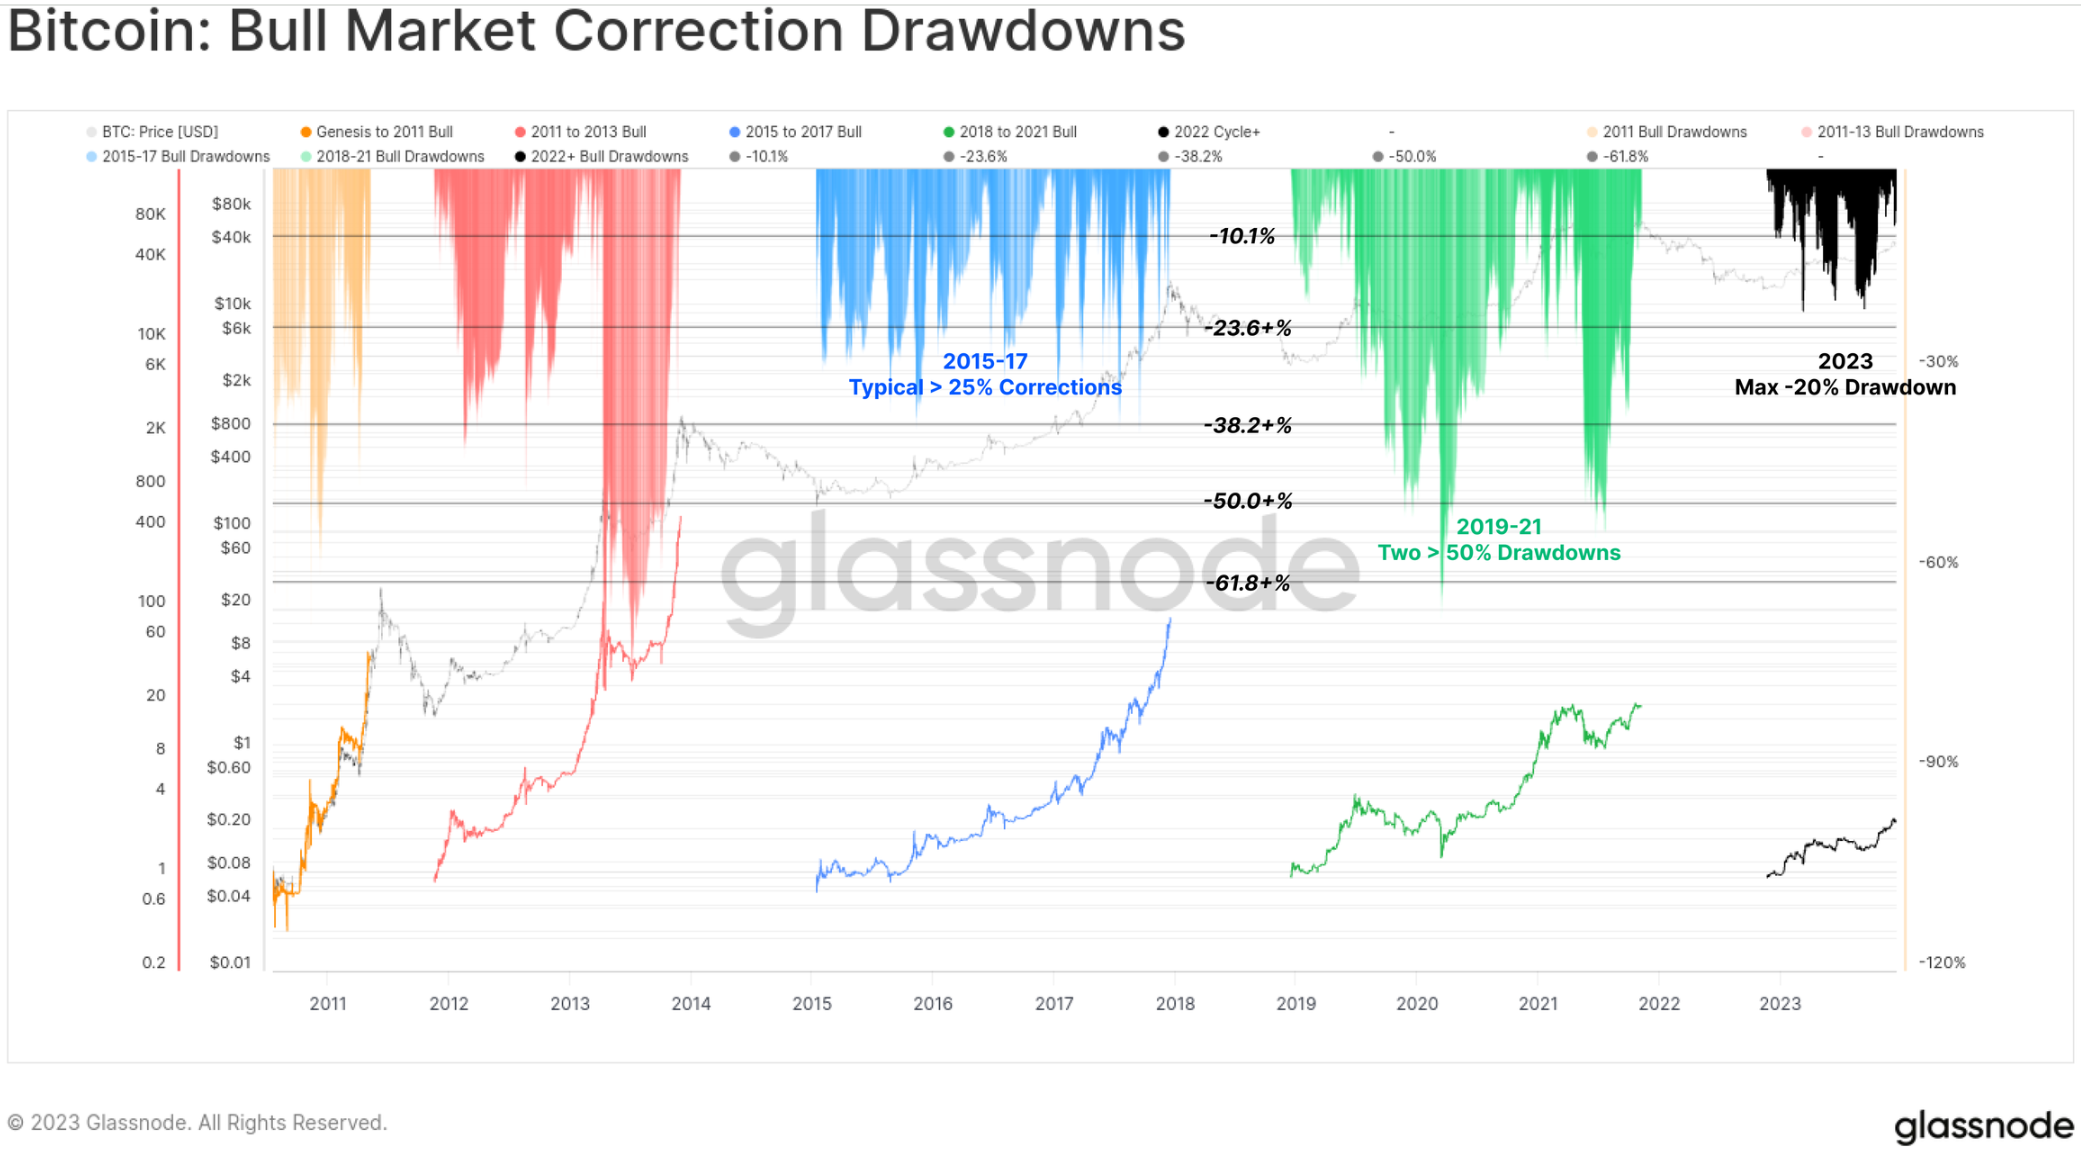
One of the significant features of the 2023 market is that all price pullbacks and adjustments have been very shallow. Historically, during the recovery of the bear market and the upward trend of the bull market, BTC has typically experienced pullbacks of at least -25% from local highs, with many examples even exceeding -50%.
However, the deepest drawdown in 2023 saw the closing price only drop by -20% from the local high, indicating buyer support and a favorable overall supply-demand balance throughout the year.
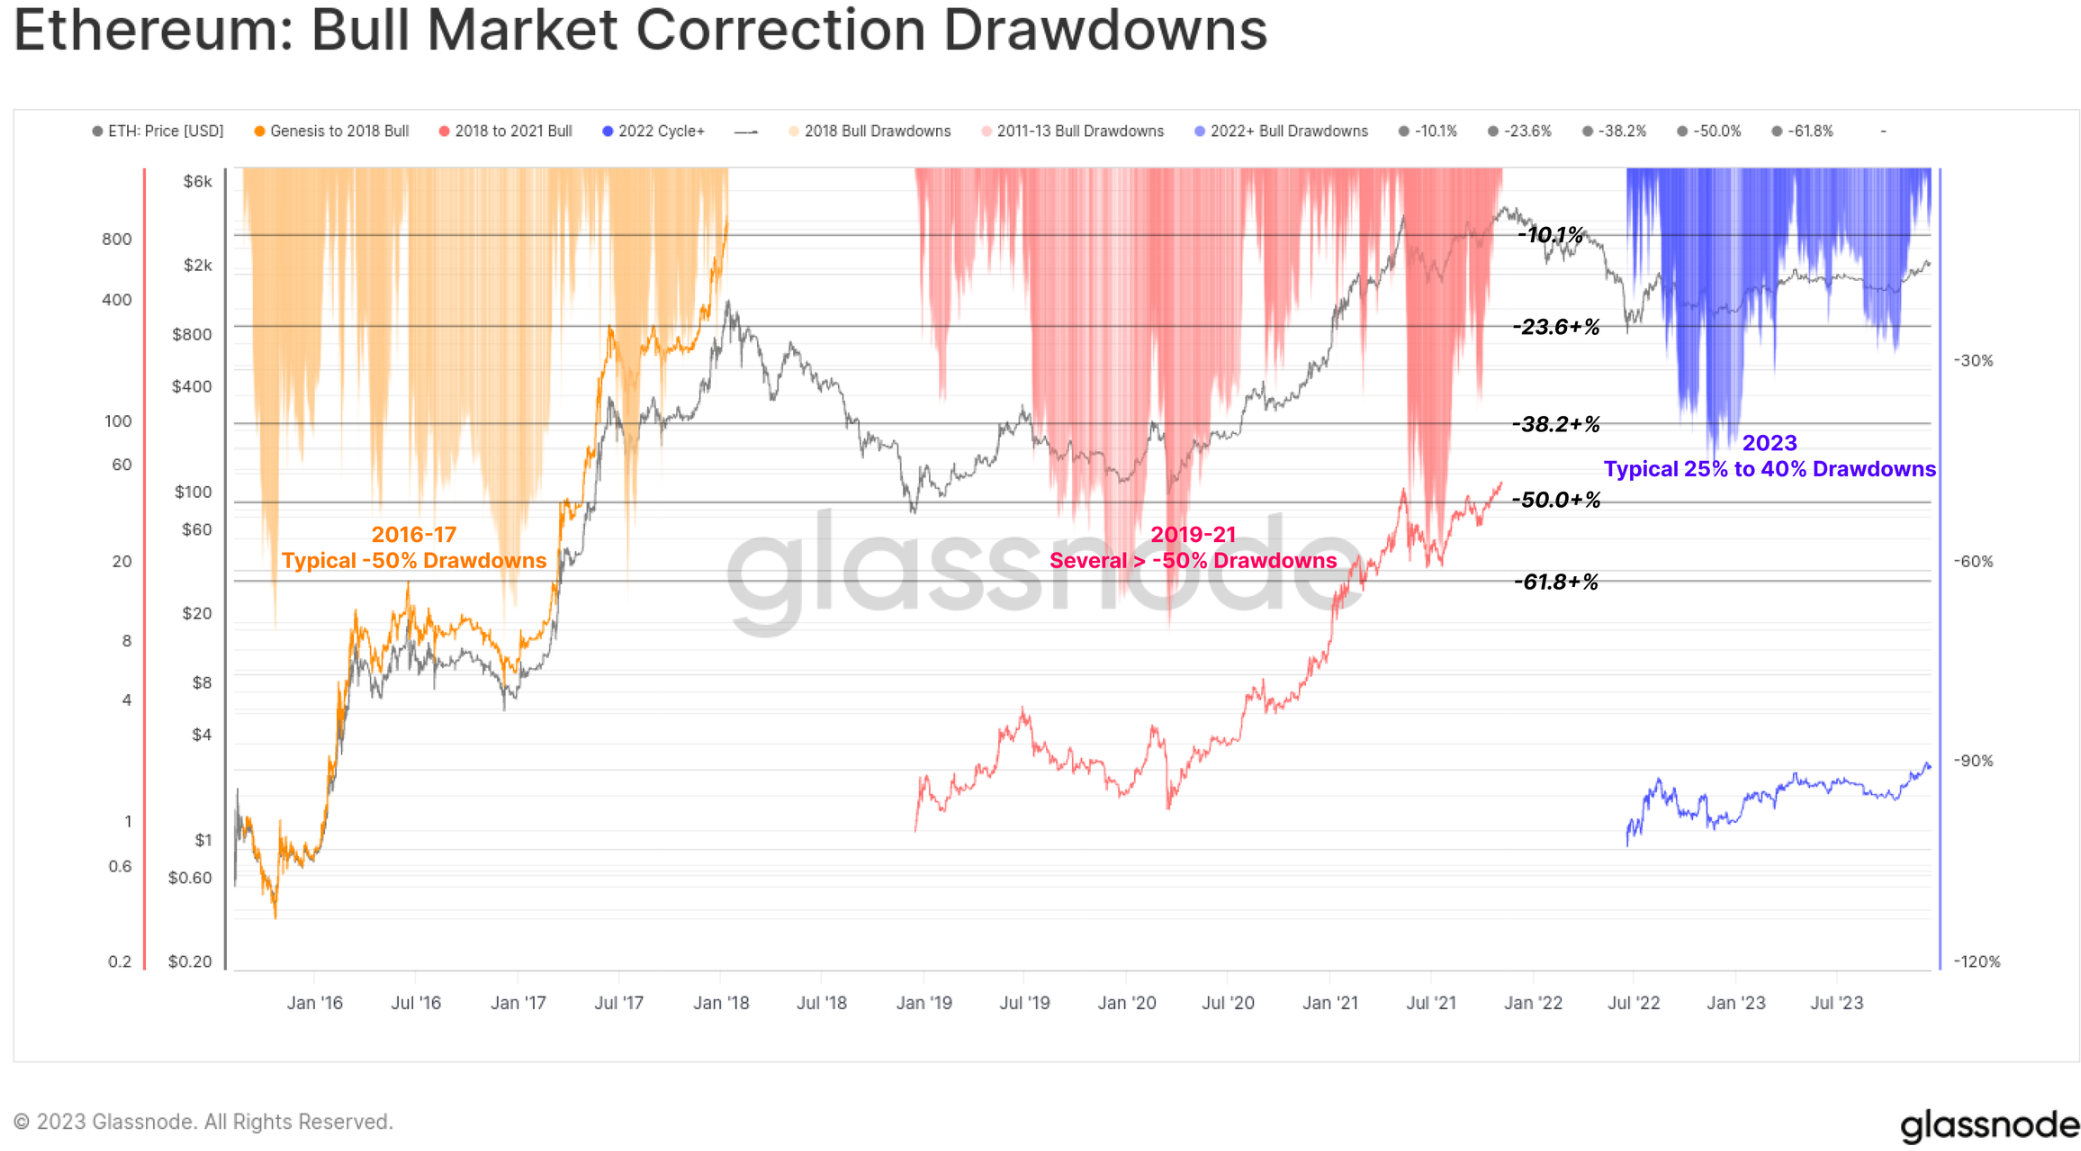
The drawdown of Ethereum has also been relatively shallow, with the deepest adjustment reaching -40% in early January. Although it has performed more weakly compared to BTC, this also paints a constructive picture that the reduction in supply due to consolidation is meeting relatively elastic demand.
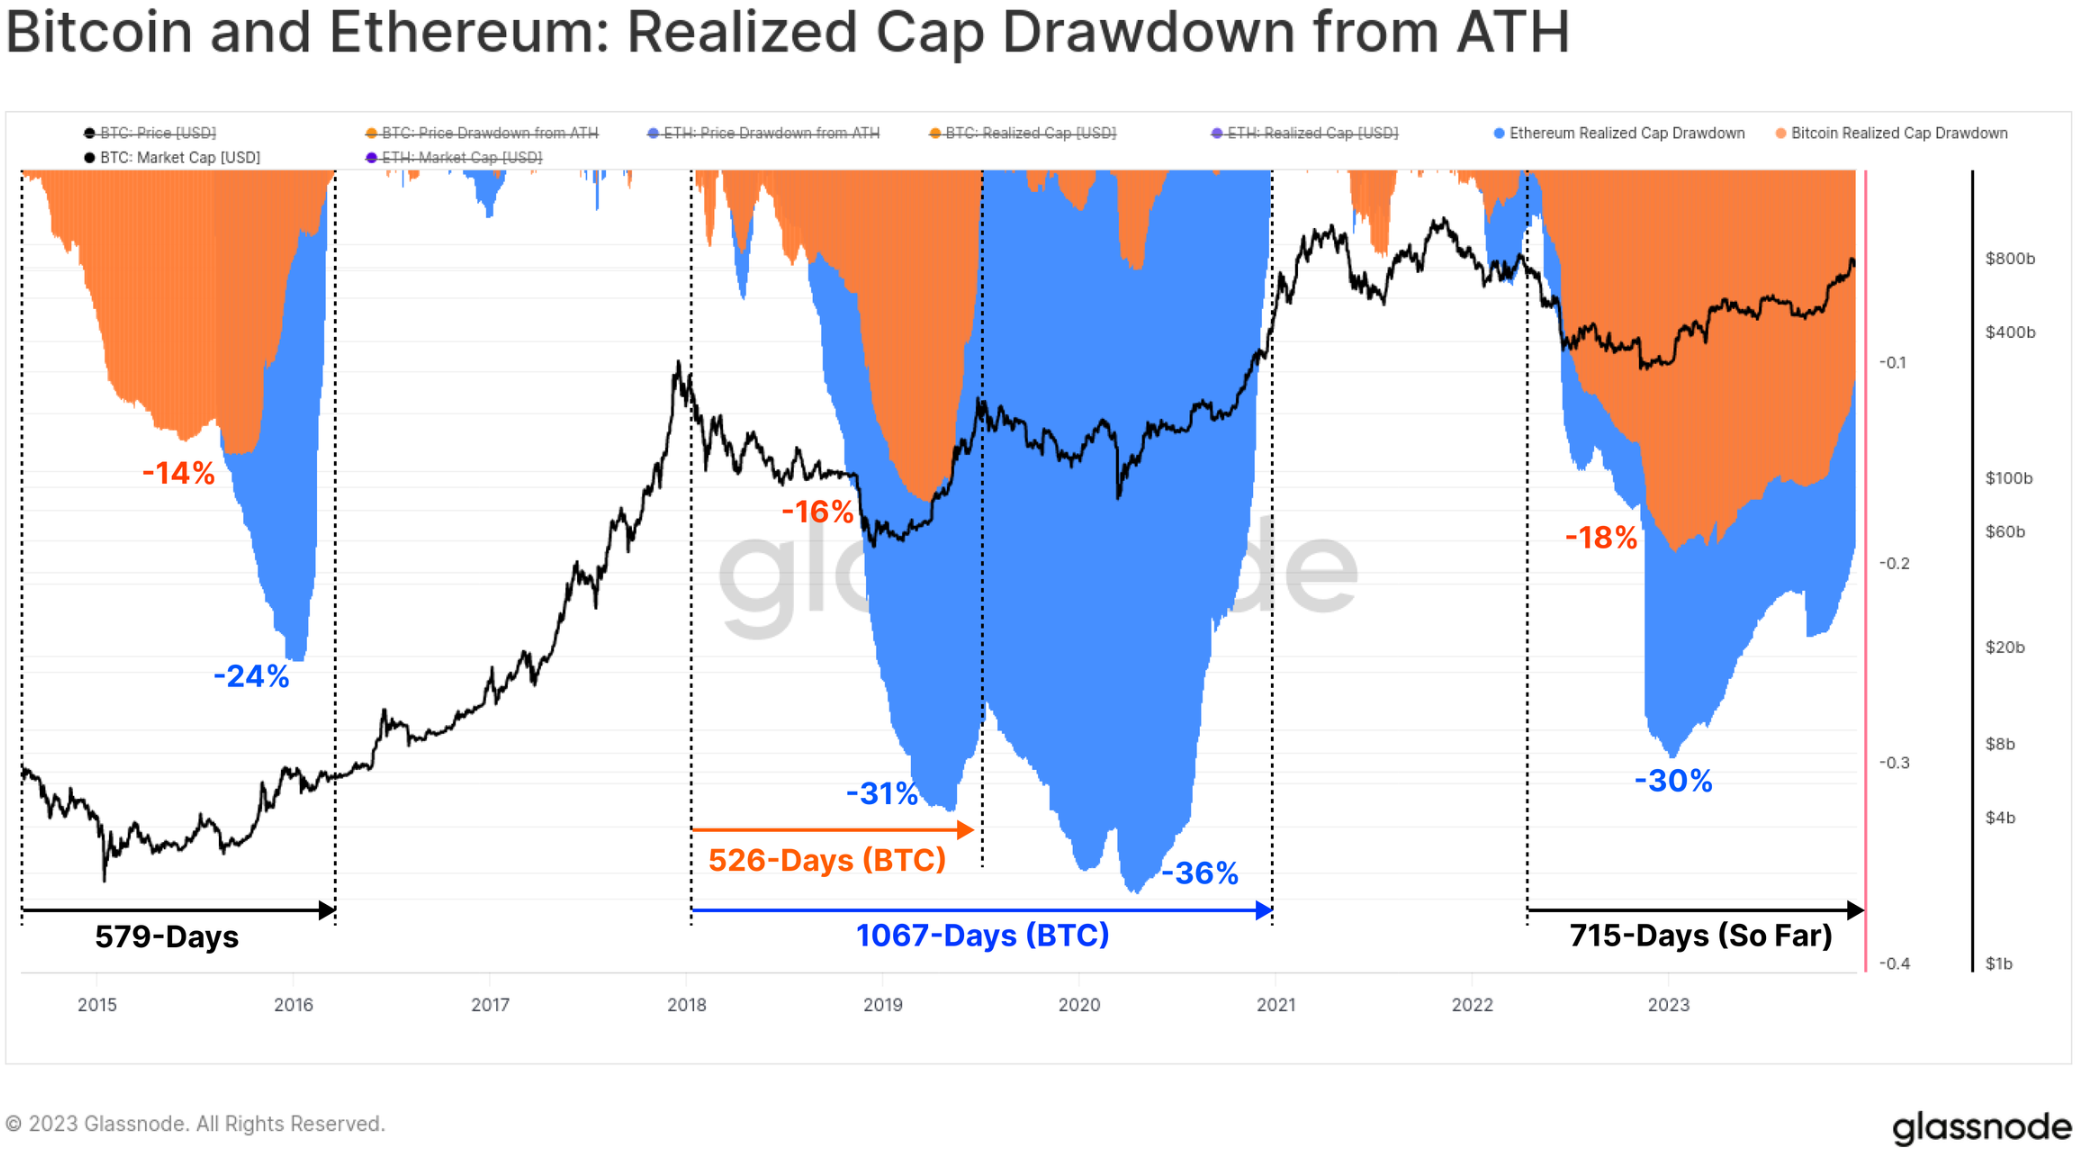
The severity of the bear market in 2022 was slightly lower than the bear market cycle of 2018-20, with most major digital assets starting from 2023 falling by -75% from their ATH (all-time high). The strong performance since the low point has made up for most of the losses. Major assets are currently trailing their ATH by -40% (BTC), -55% (ETH), -51% (altcoins, excluding ETH and stablecoins), and the supply of stablecoins by -24%.
From an on-chain perspective, the realized cap of BTC and ETH provides an excellent tool for tracking the recovery of capital flows for each asset. The total realized cap decline during the bear market period in 2022 reached levels similar to the previous cycle, reflecting a net capital outflow of -18% for BTC and -30% for ETH.
However, the recovery of capital inflows has been much slower, with BTC's realized cap reaching over 100% ATerH 715 days ago. In contrast, in the previous cycle, the complete recovery of the Realized Cap took about 550 days.
Breaking the $30,000 Resistance Level
This year, the Bitcoin market has broken numerous technical milestones and on-chain pricing models, all of which have helped us understand how strong its performance has been.
The year began with a short squeeze in January, pushing the market above the Realized Price 🟠, which had been a significant constraint on prices since June 2022. This rise also broke through the 200D-SMA 🔵, encountering resistance at the 200W-SMA 🔴 in March.
Until August, the Bitcoin price continued to range between the 200D-SMA 🔵 and the Realized Market Average Price 🟢, entering one of the periods of the smallest volatility in Bitcoin's history (see WoC-32 and WoC-33). Shortly after, a rapid deleveraging event caused the price to rise from $29,000 to $26,000 in a single day, falling below the two long-term technical price averages mentioned above.
The rebound in October truly changed the game, with all remaining price models being restored and breaking through the key psychological level of $30,000. Since then, Bitcoin has reached a yearly high of $44,500 and is currently consolidating around $42,000 at the time of writing.
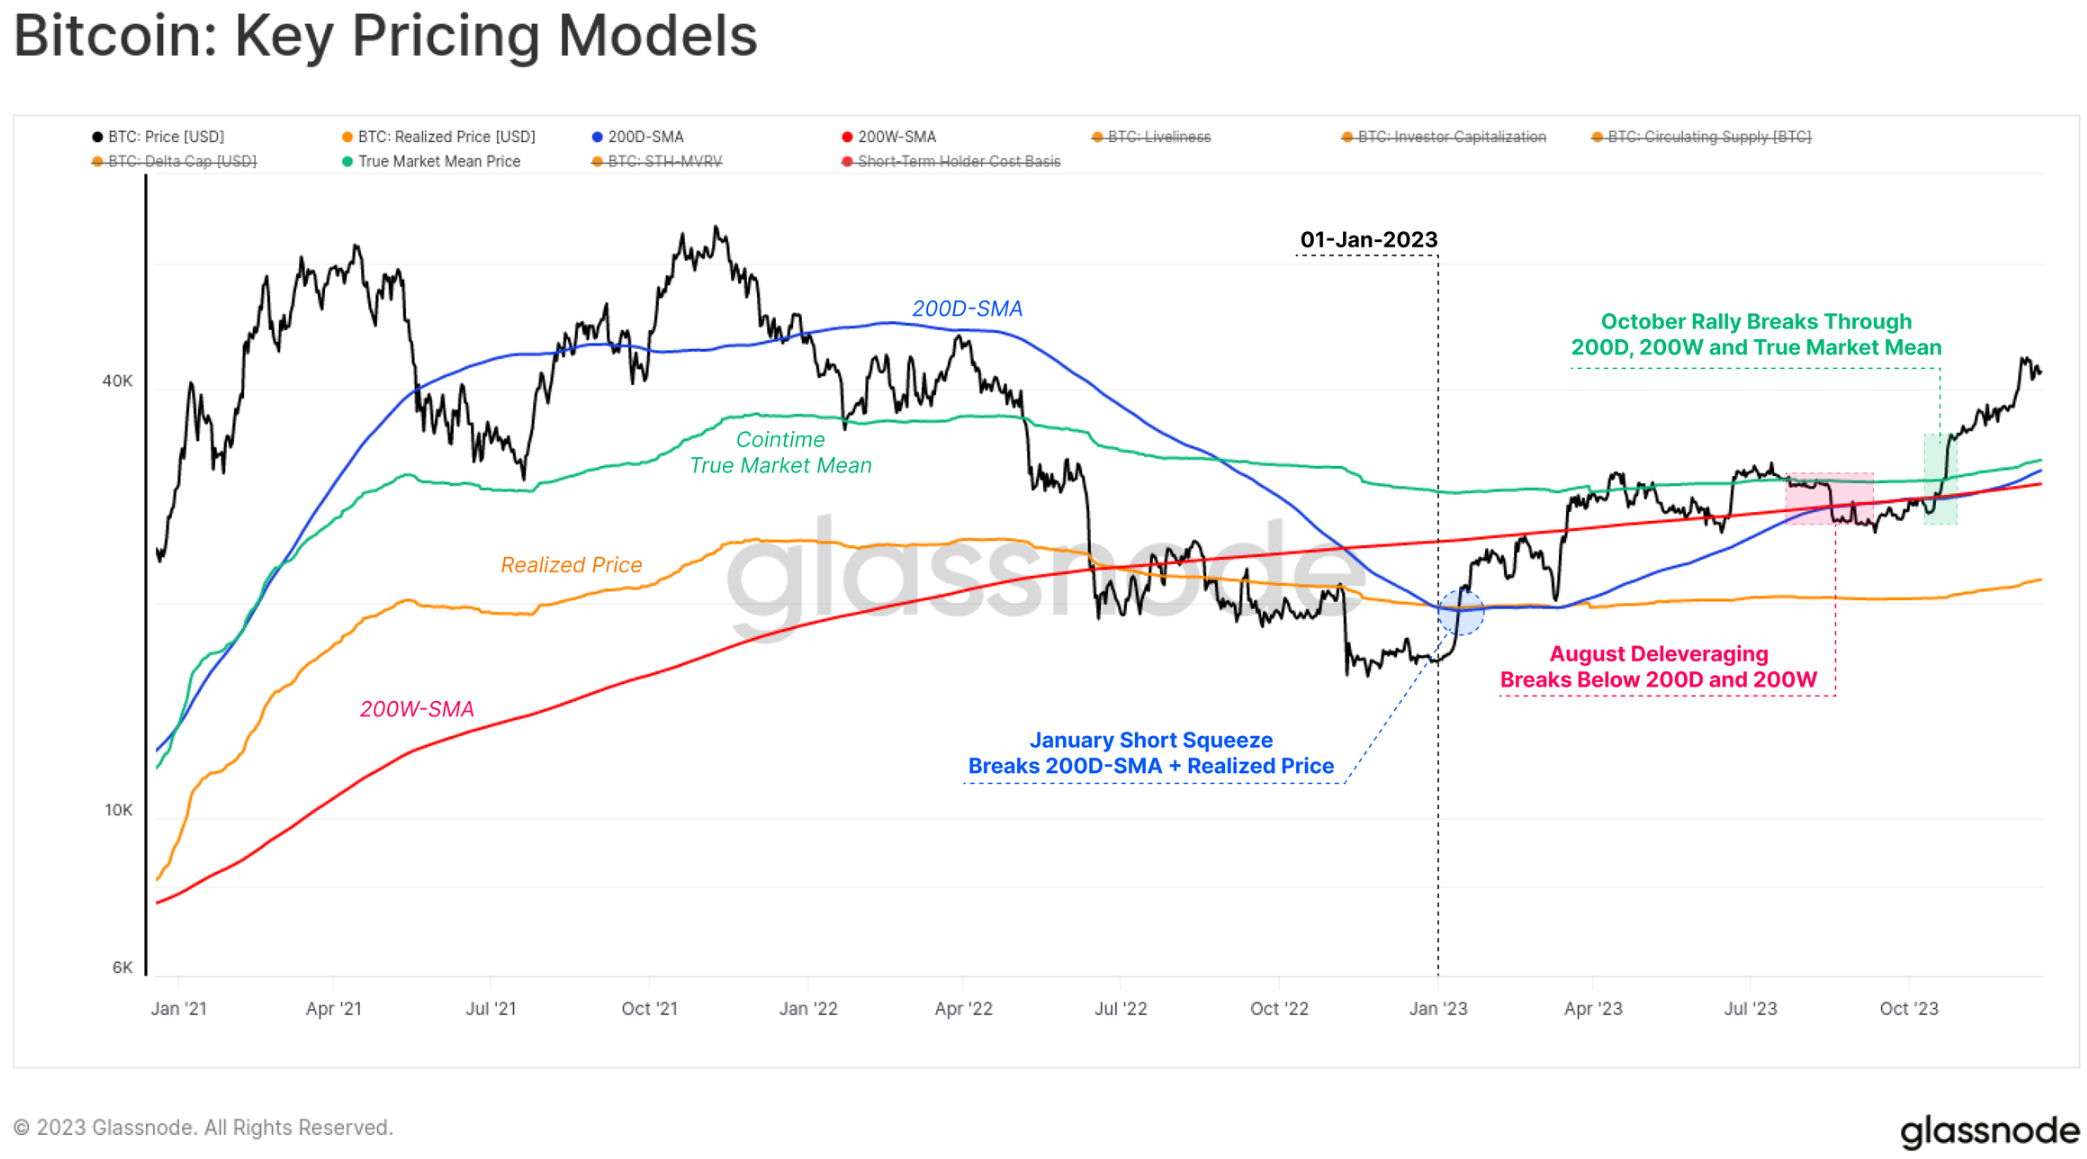
A common theme readers may notice in this article is how capital flows, market dynamics, and performance have accelerated since the end of October. In WoC-49, we discussed the relationship between this and the BTC price breaking the $30,000 level, describing it as a transition from the "uncertain recovery" phase to the "enthusiastic upward trend."
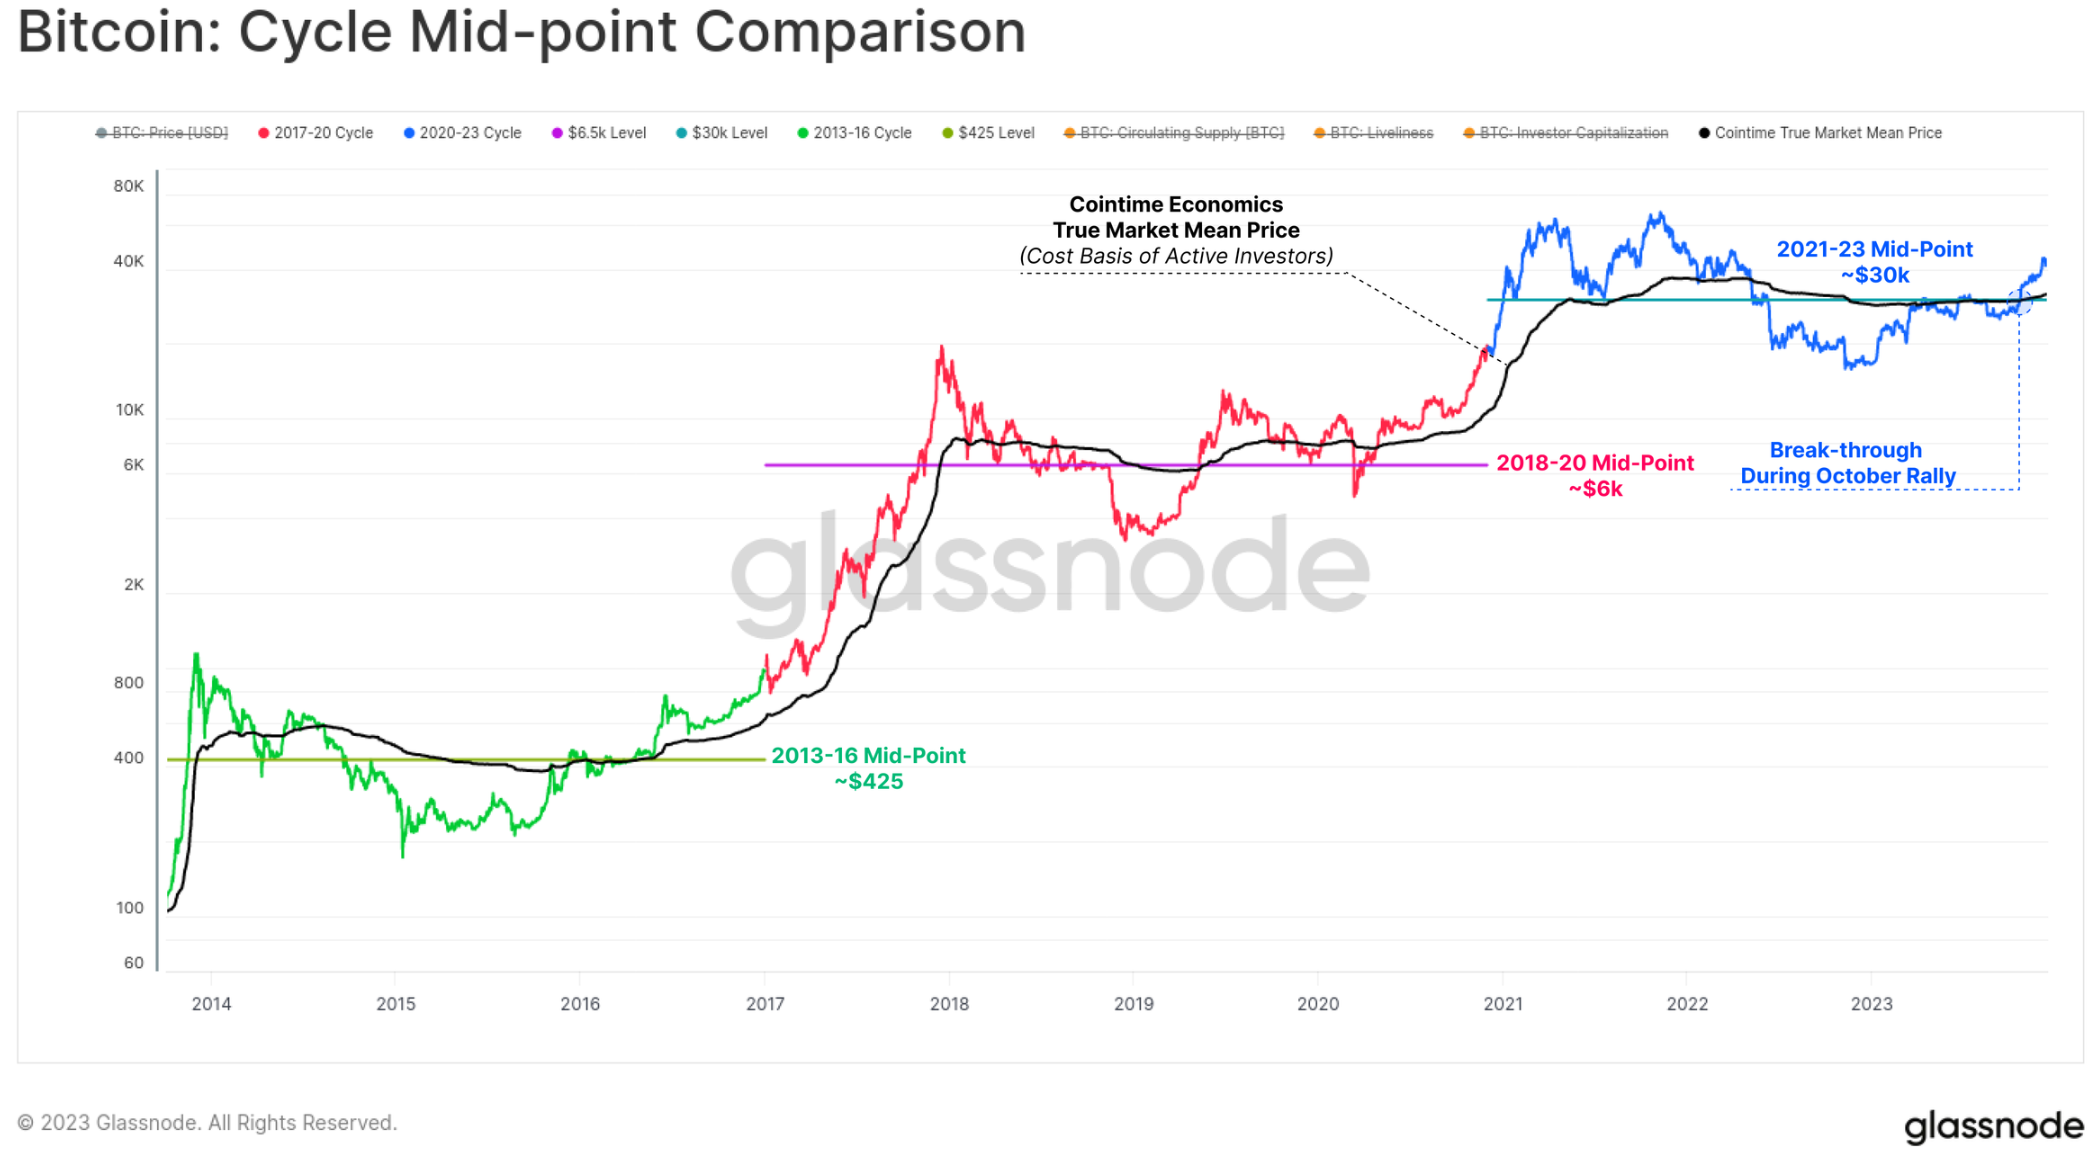
It is worth noting that the rebound in October broke through two important levels that depicted this transition in previous cycles:
1. Technical Market Midpoint: A broad price level that serves as support in the early stages of a bear market and resistance in the later stages. In this cycle, $30,000 was the last major support area before a series of capitulative sell-offs, ultimately leading to the collapse of FTX.
2. Cointime Realized Market Average Price: Reflects the cost basis of active investors. This model was developed in collaboration with ARK Invest in Cointime Economics research.
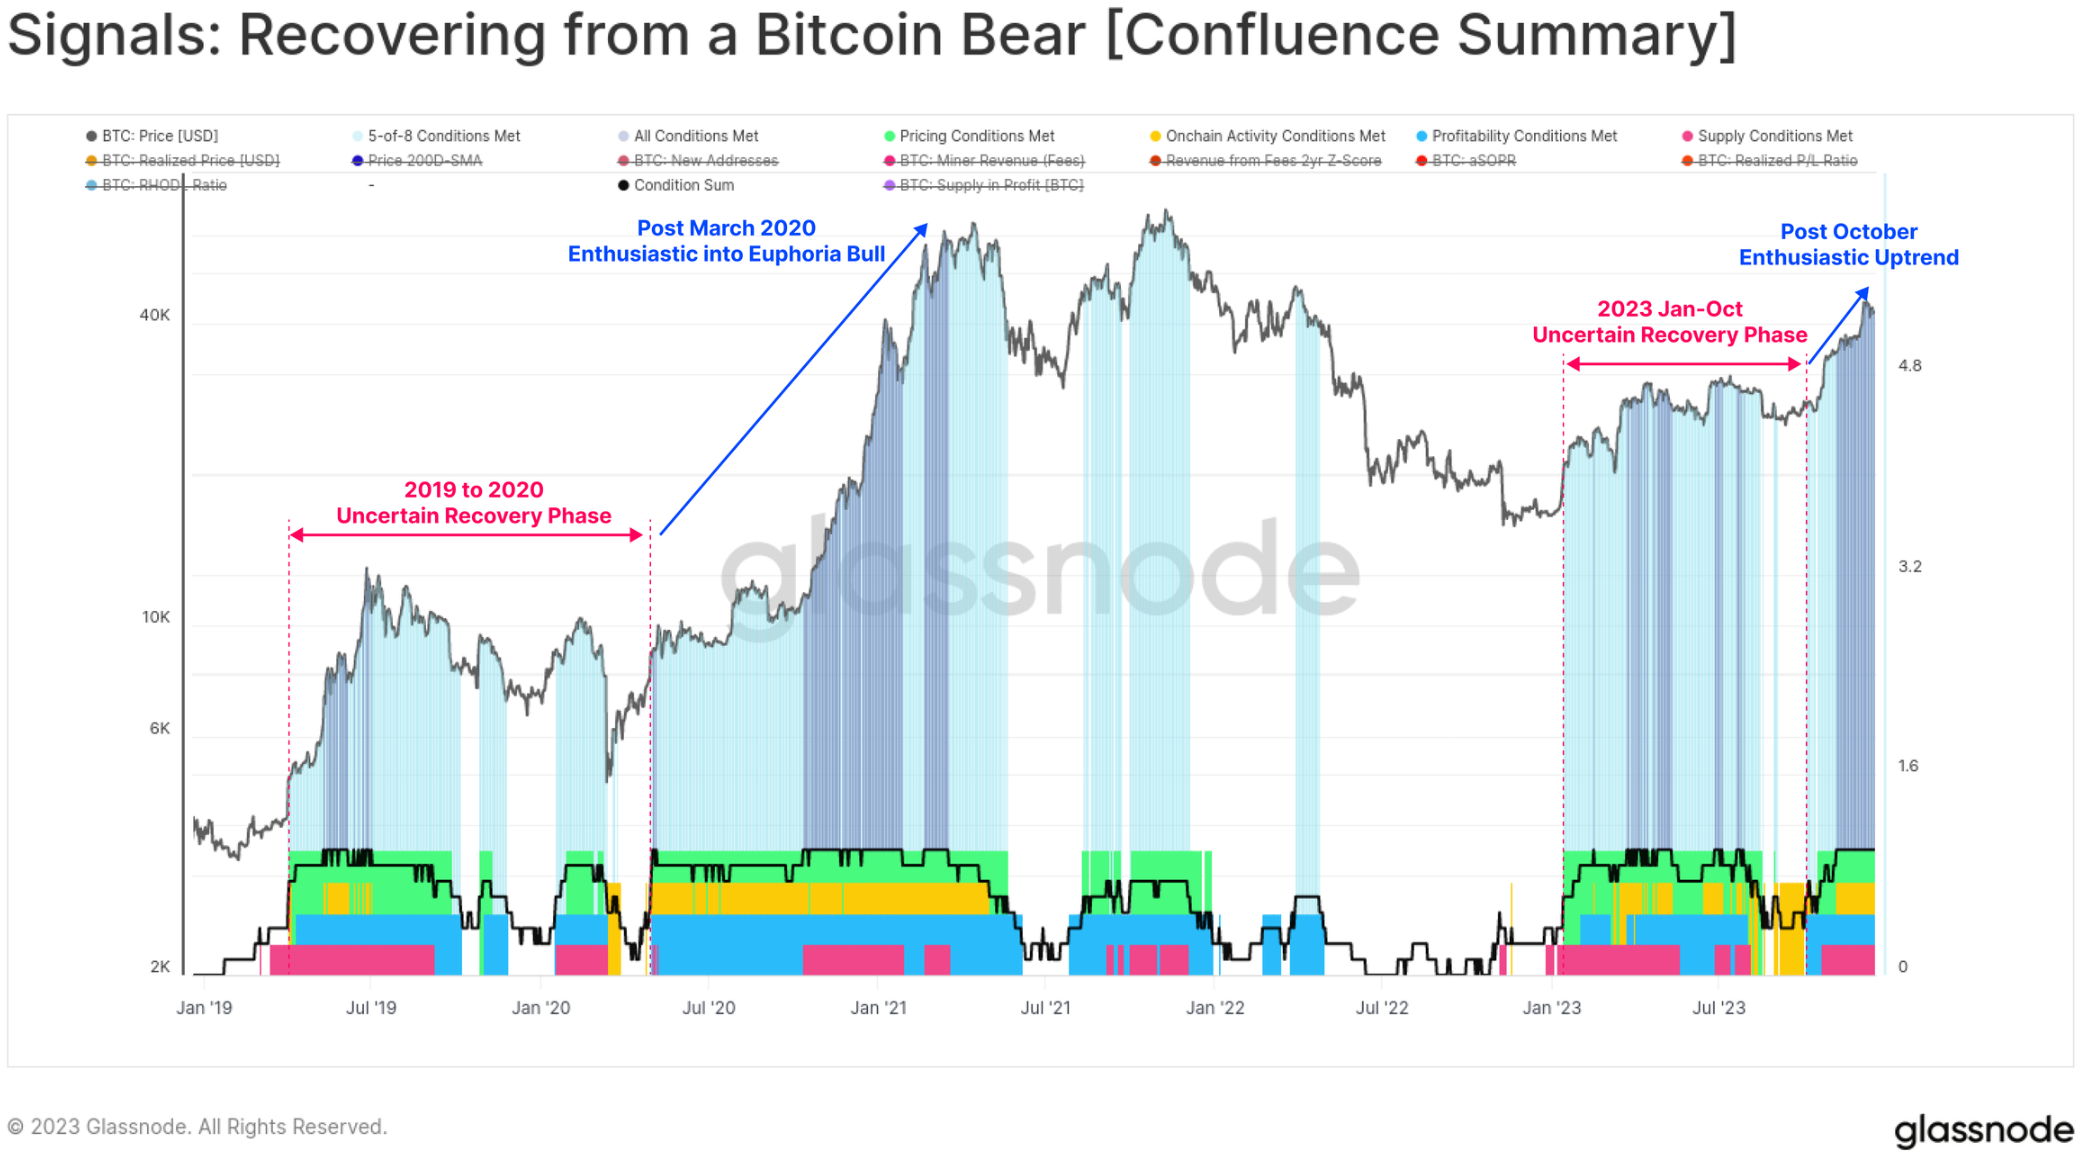
We can also see significant changes in the recovery characteristics from Bitcoin bear market signals, as all eight indicators have entered positive territory since October. Throughout most of 2023, the readings have been mixed, exhibiting characteristics very similar to those of the 2019-20 period.
With all eight indicators now in play, this indicates that the market has entered a positive zone typically associated with a resilient upward trend in multiple indicators and areas of the Bitcoin market structure.
Increase in Quantity, Fees, and Inscriptions
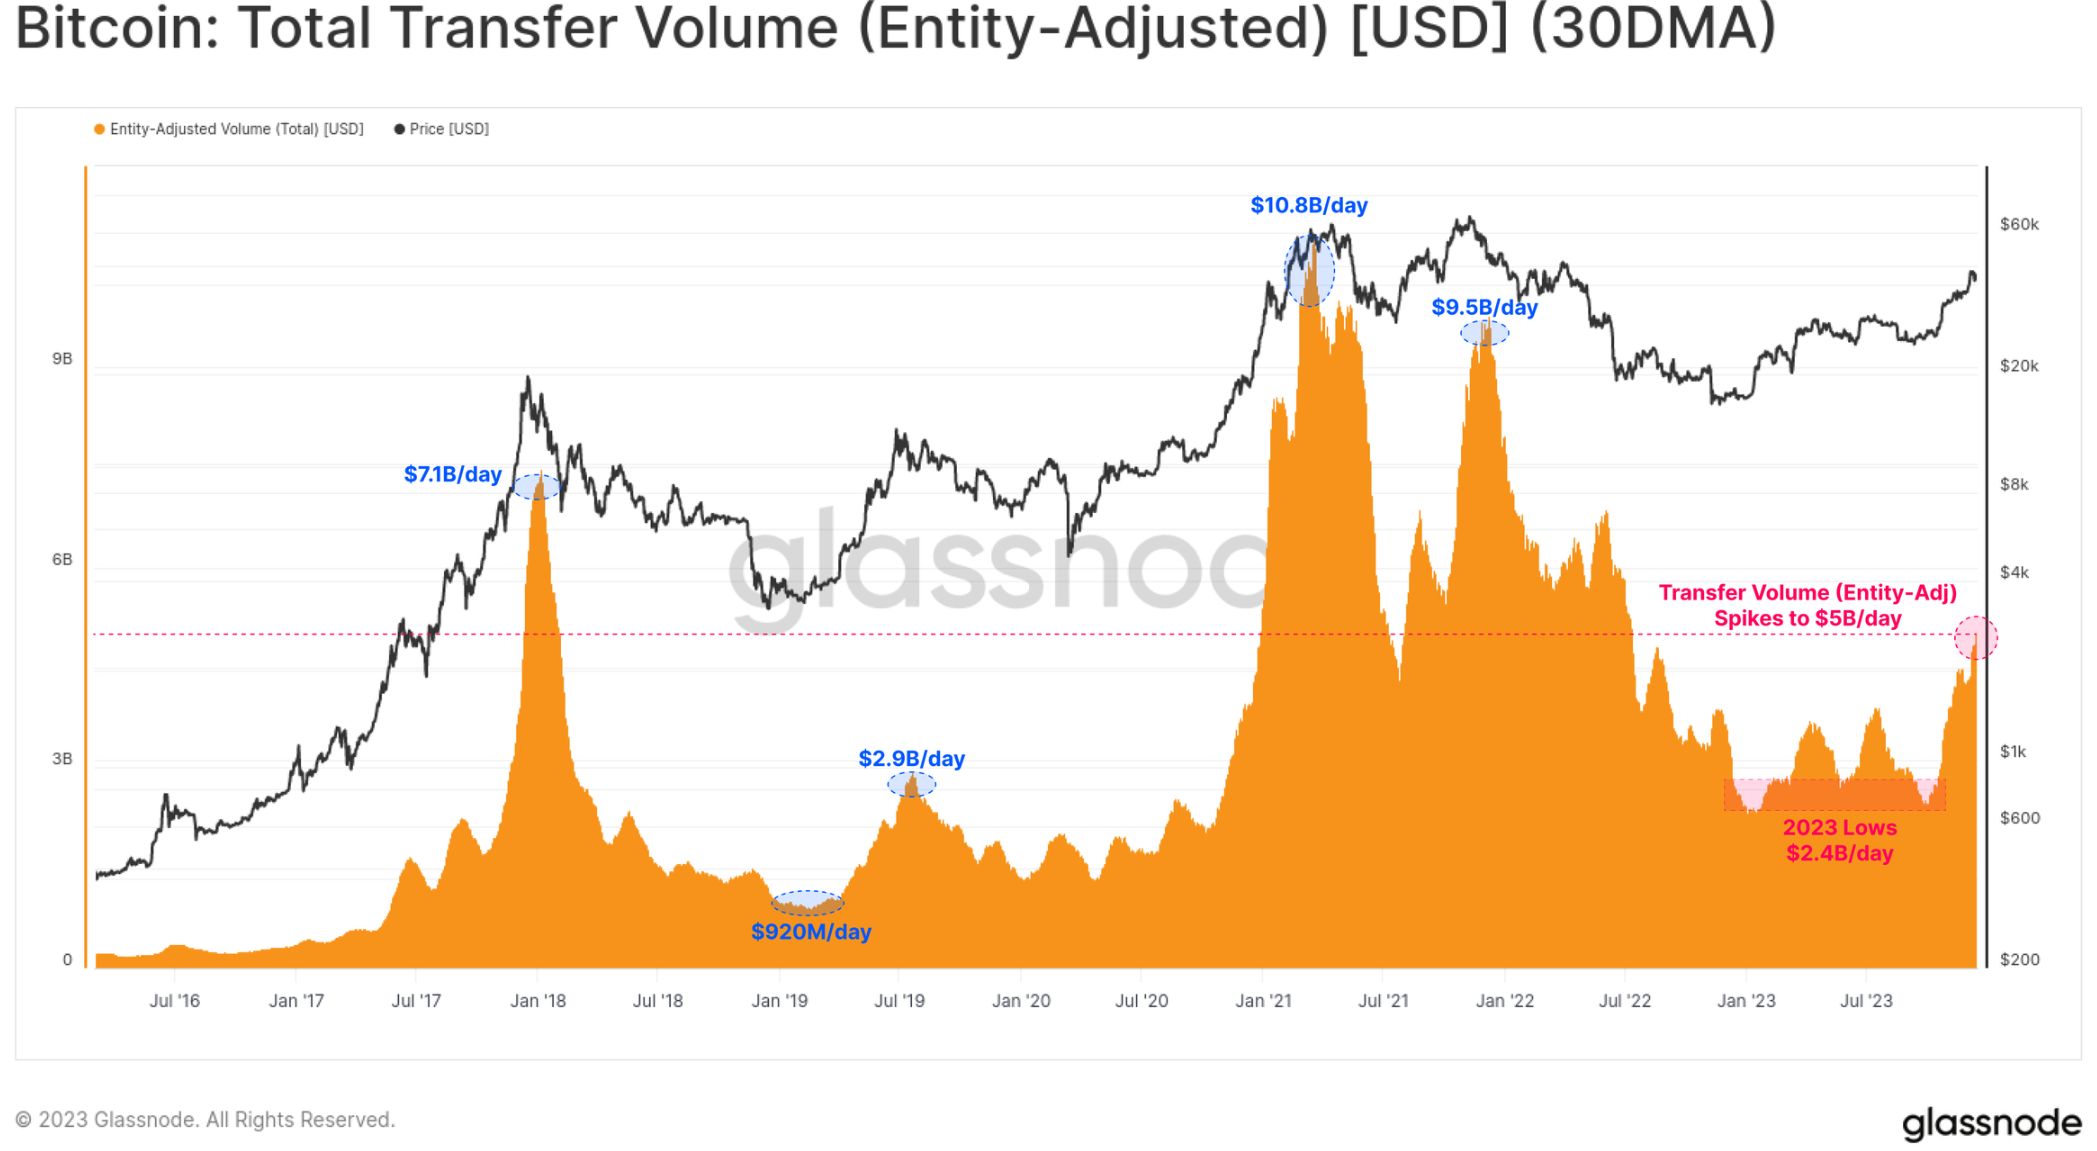
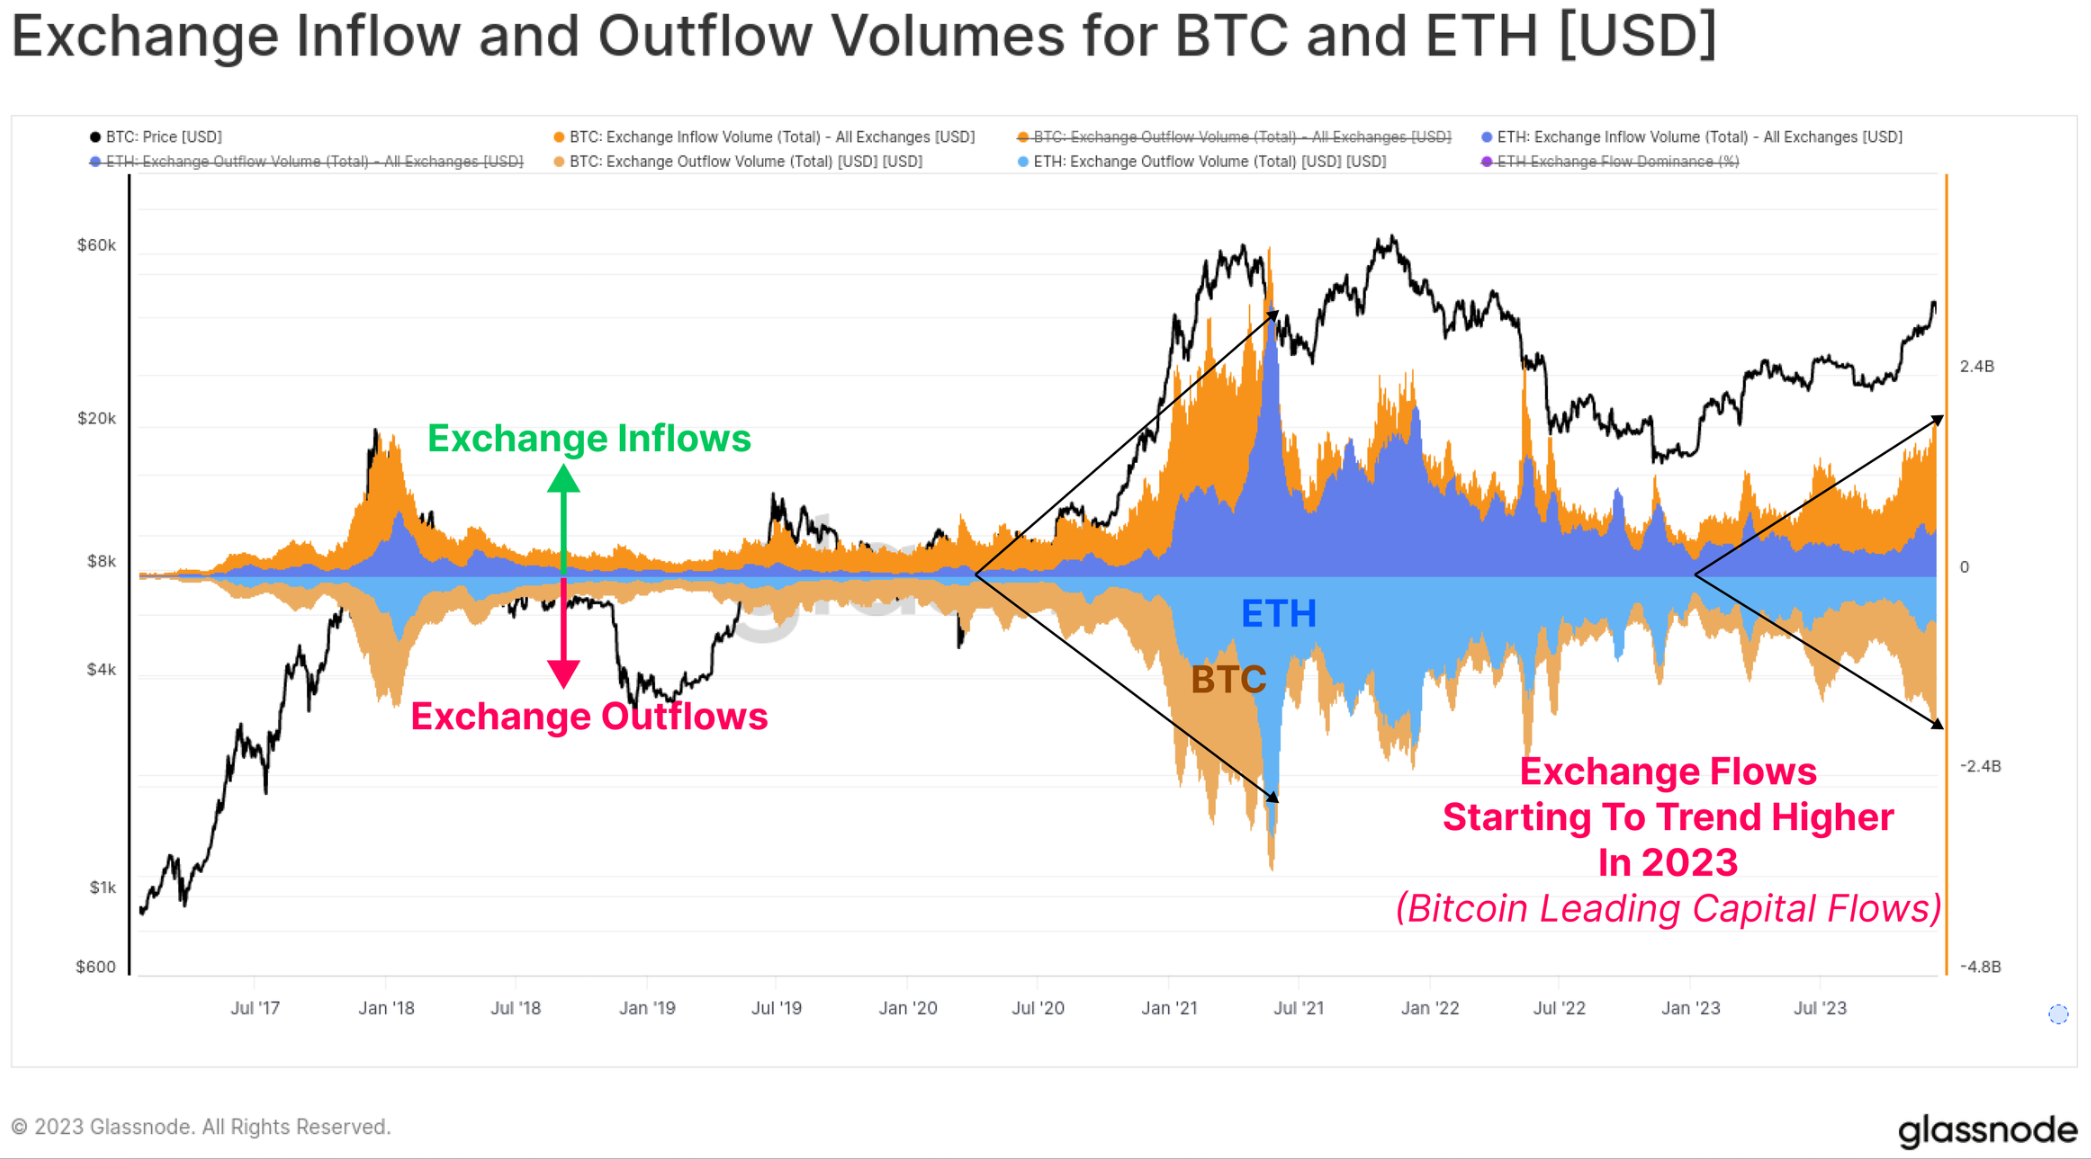
We can see that prior to this, Bitcoin's trading volume was relatively stagnant, supporting the view that "October was to some extent a phase shift in the market." The October surge doubled Bitcoin's transfer volume, increasing from $2.4 billion per day to over $5.0 billion per day, the highest level since June 2022.
We can also see that the exchange inflows and outflows of BTC and ETH have increased throughout the year, indicating a widespread expansion of spot trading interest. It is noteworthy that the growth rate of BTC trading volume is significantly faster than that of ETH, consistent with the observation of Bitcoin's continued dominance. It is common for Bitcoin to lead investors out of the doldrums after a long bear market, and this chart helps to visually illustrate this phenomenon.
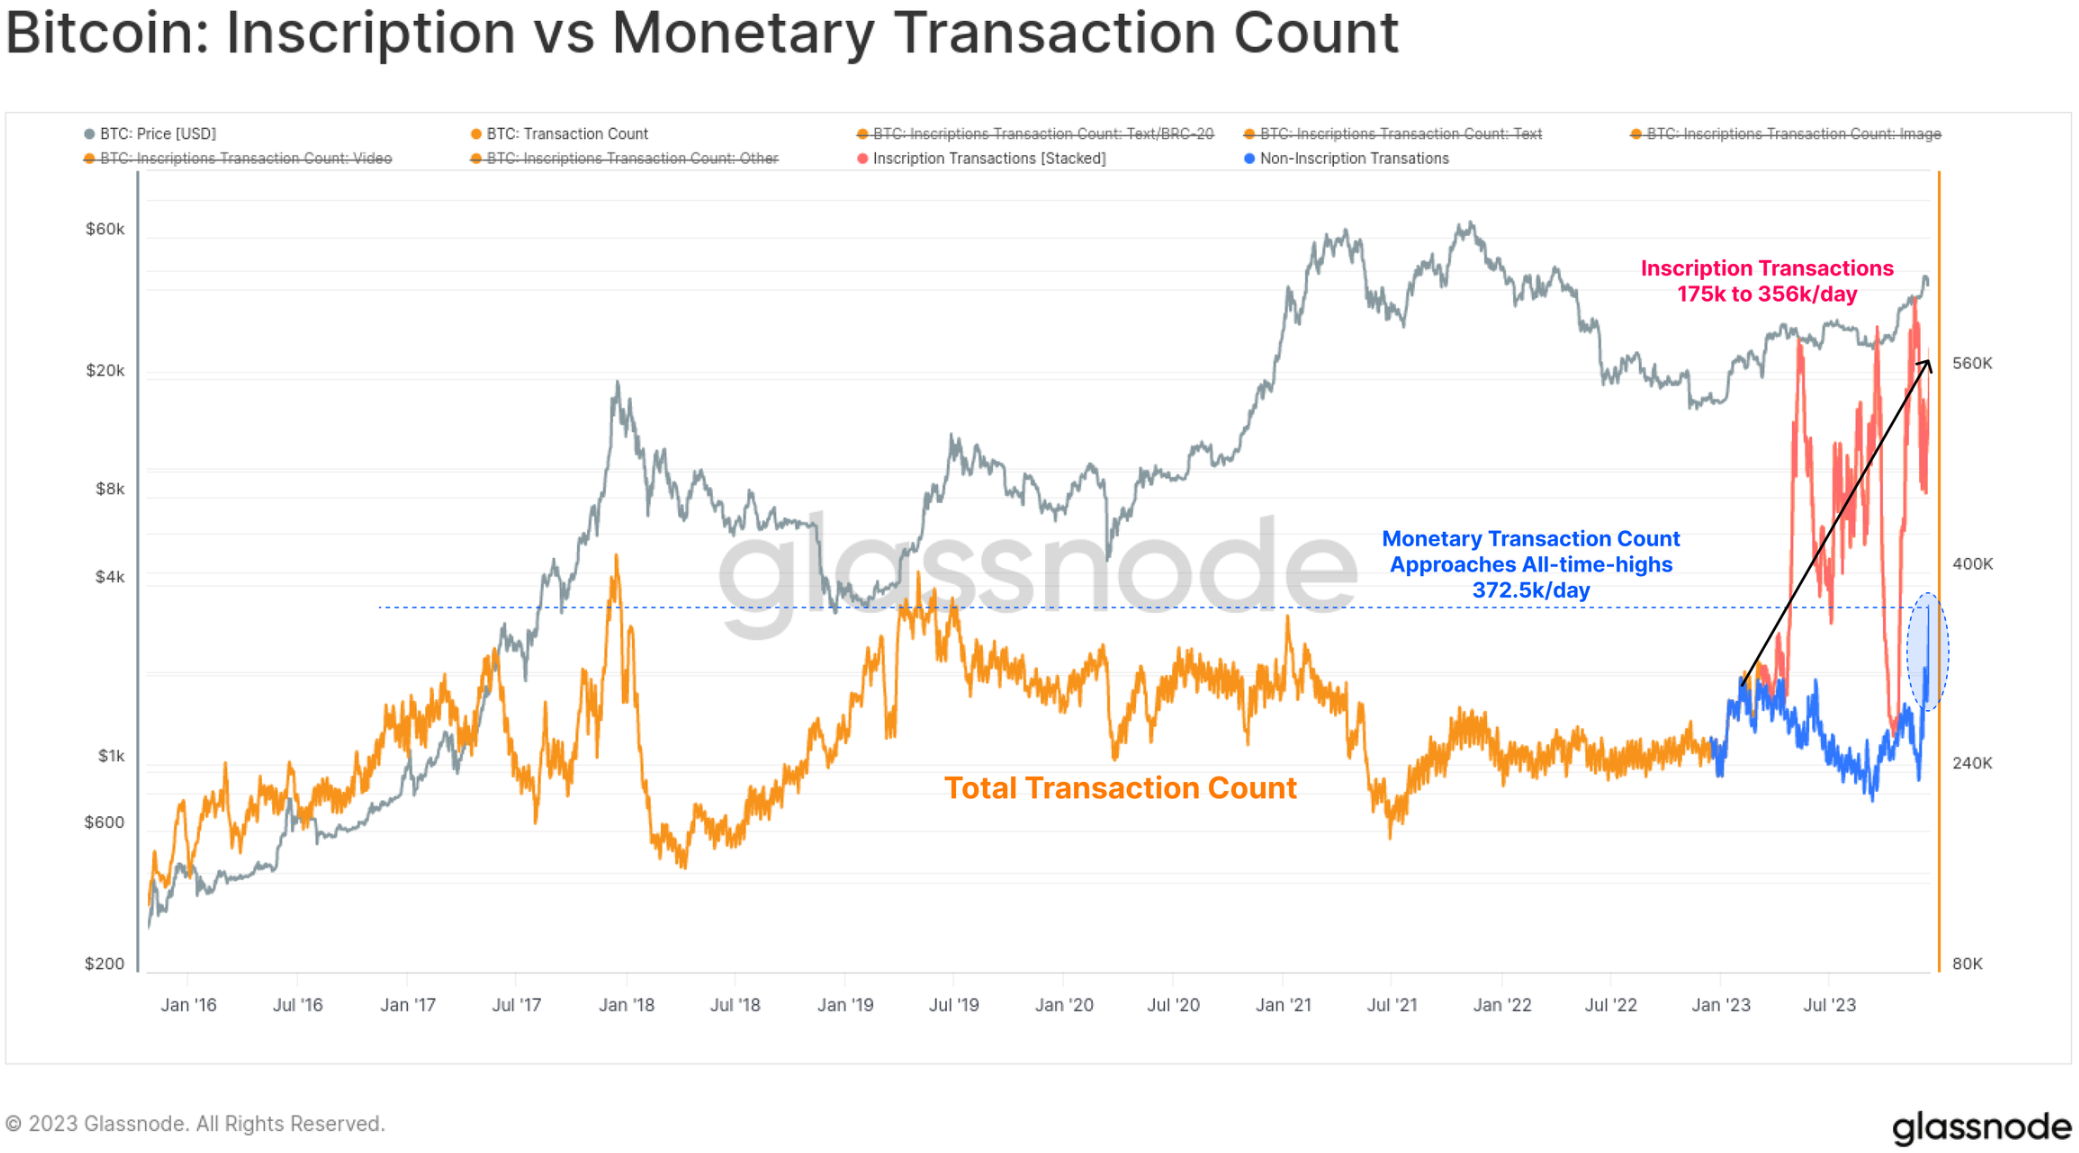
This year, Bitcoin's transaction count reached a historical high, primarily due to the unexpected growth in inscriptions and ordinals. These transactions embed data such as text files and images into the signature part of the transaction.
As a result, we can now assess two types of Bitcoin transactions:
🟠 Total Transaction Count (unfiltered)
🔵 The currency transaction volume reached a multi-year high, almost reaching the historical peak of 372.5k per day.
🔴 Inscription Transactions added an additional 175,000 to 356,000 transactions per day on top of classic currency transactions.
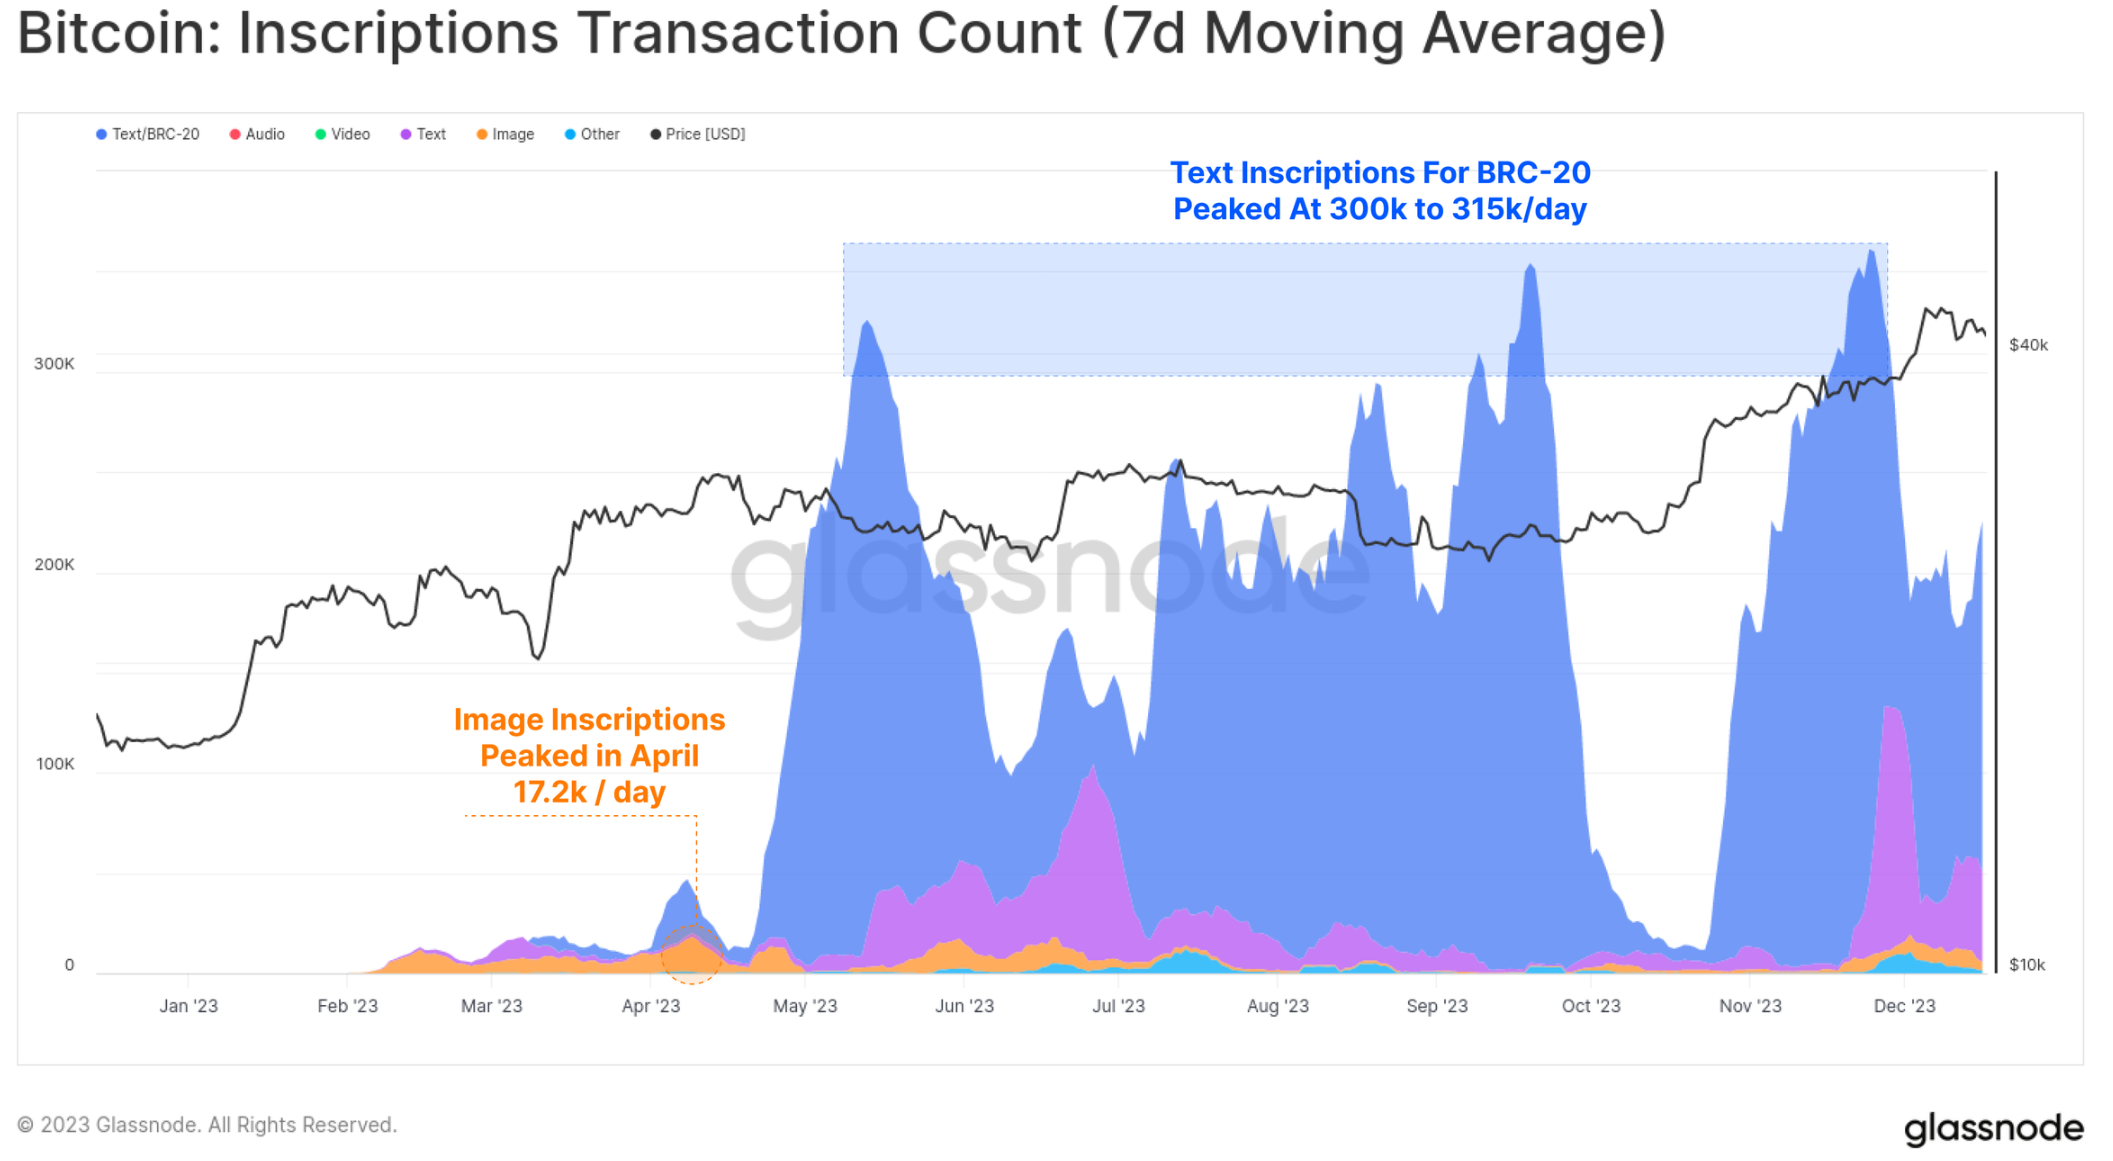
Most inscriptions are text-based and are associated with a novel token standard called BRC-20 🔵. At its peak, the Bitcoin network saw over 300,000 inscriptions per day, far exceeding the peak of image-based inscriptions 🟠 of 172,000 per day in April (images are larger, so inscription costs are higher as fees increase).
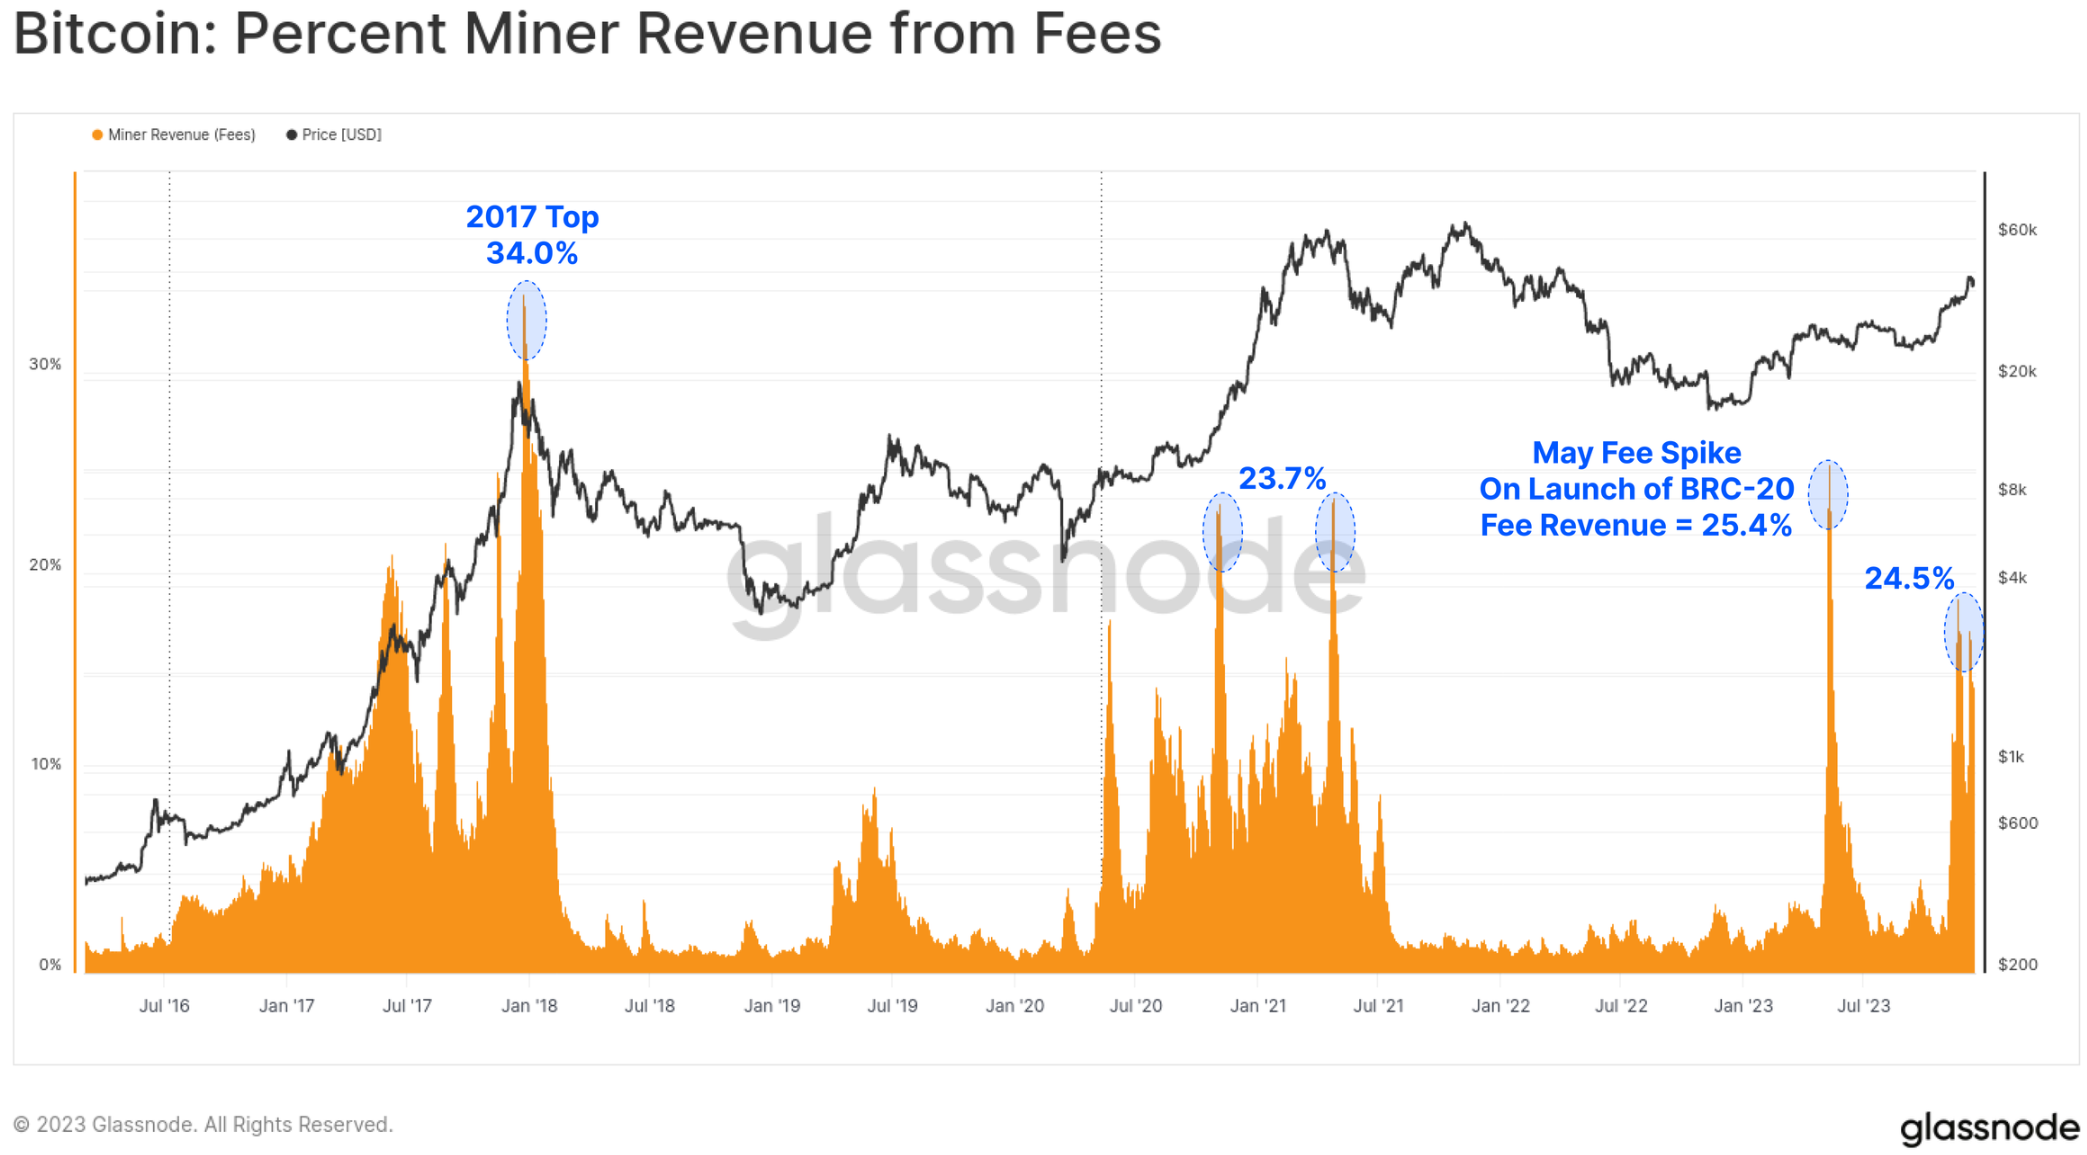
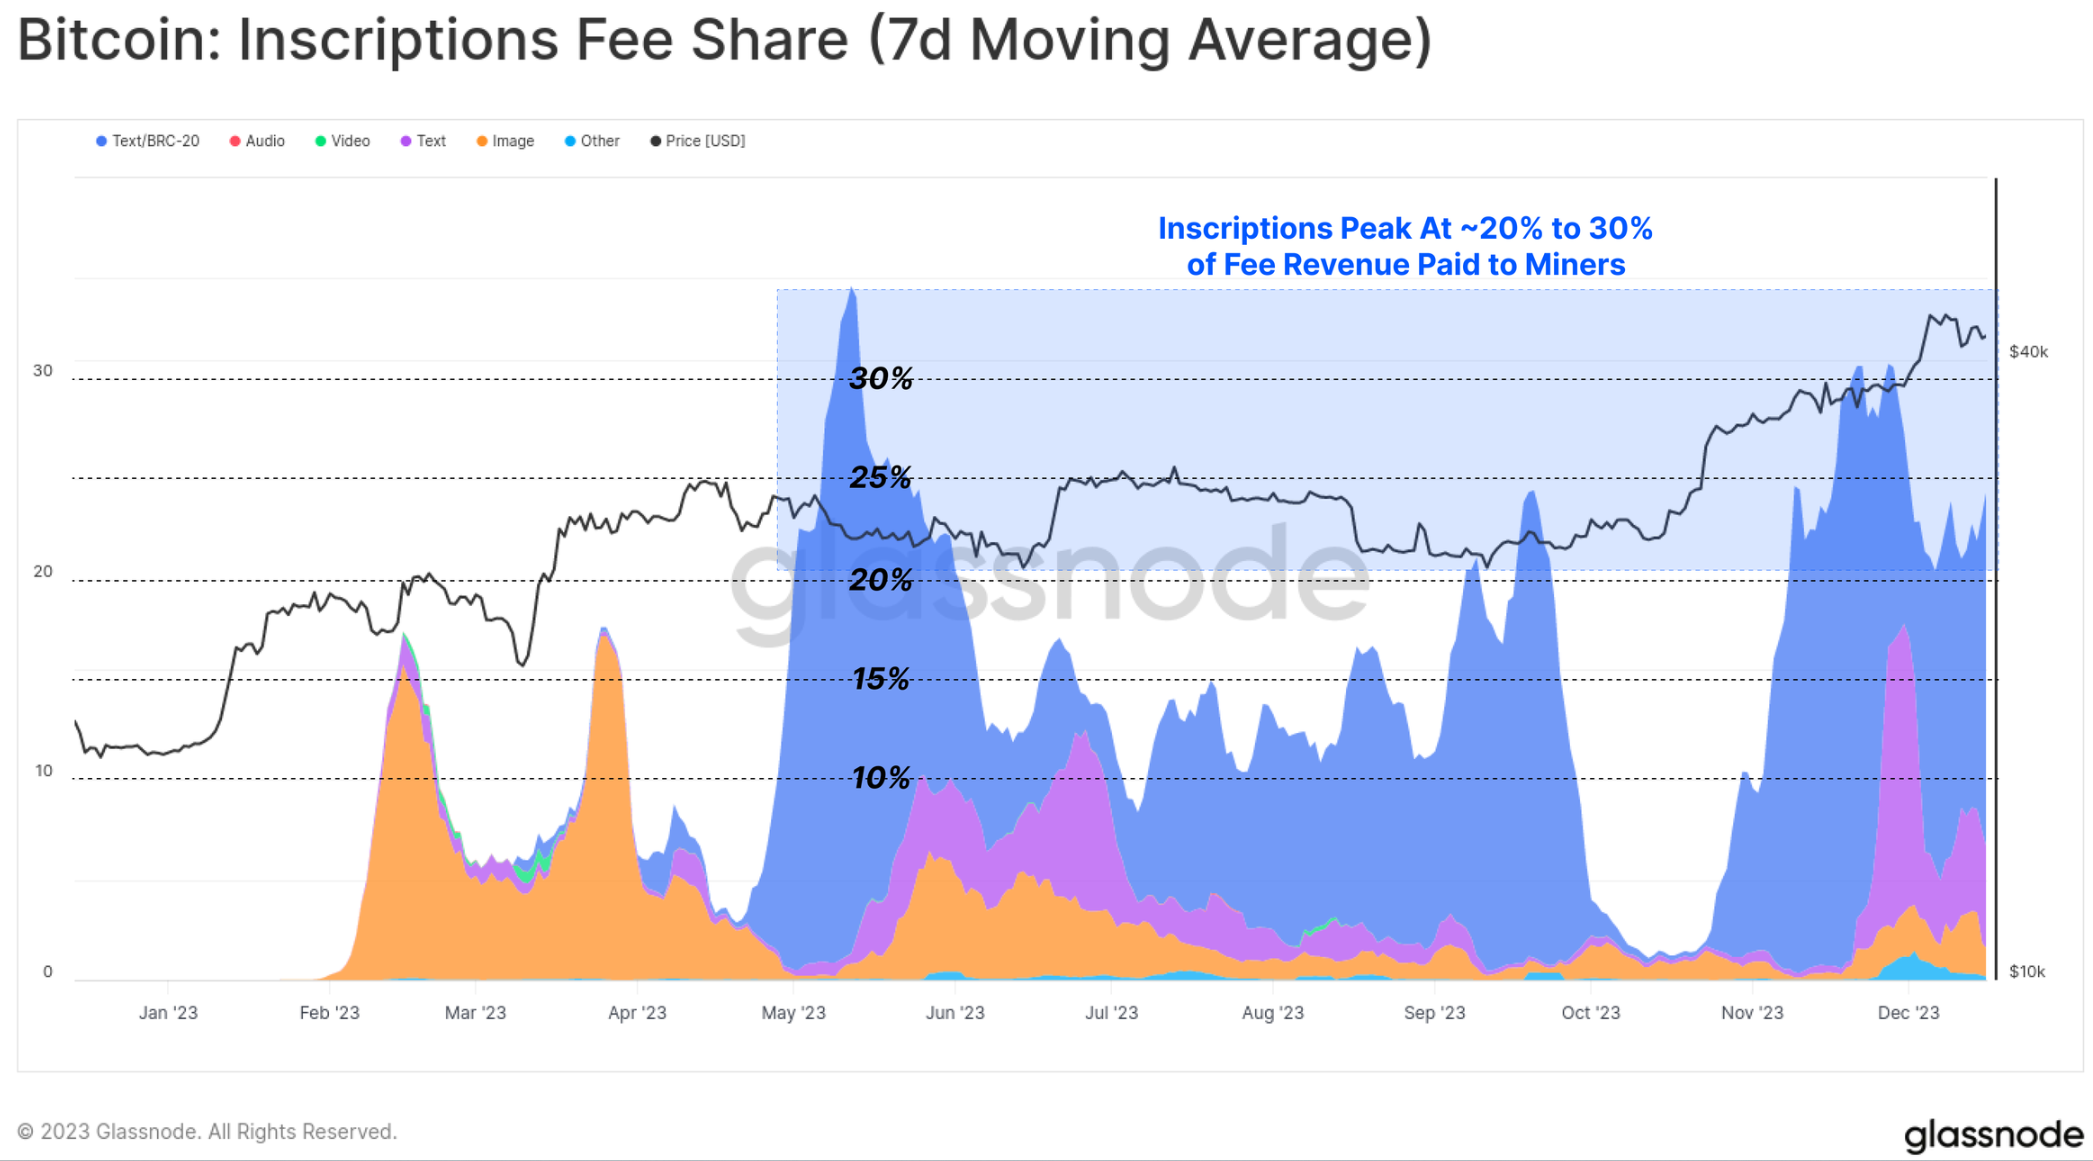
With this new demand for Bitcoin block space, miners' fee income has increased significantly, with several blocks in 2023 paying fees exceeding the 6.25 BTC subsidy. There have been two significant fee spikes this year, with fees currently accounting for about a quarter of miner income. This is comparable to the euphoric stages of the bull markets in 2017 and 2021.
Interestingly, while inscriptions account for about 50% of confirmed transactions, they surprisingly only occupy about 10% to 15% of block space. This is the result of the smaller size of text files and subtle differences related to SegWit data discounts (a topic we introduced in WoC-39).
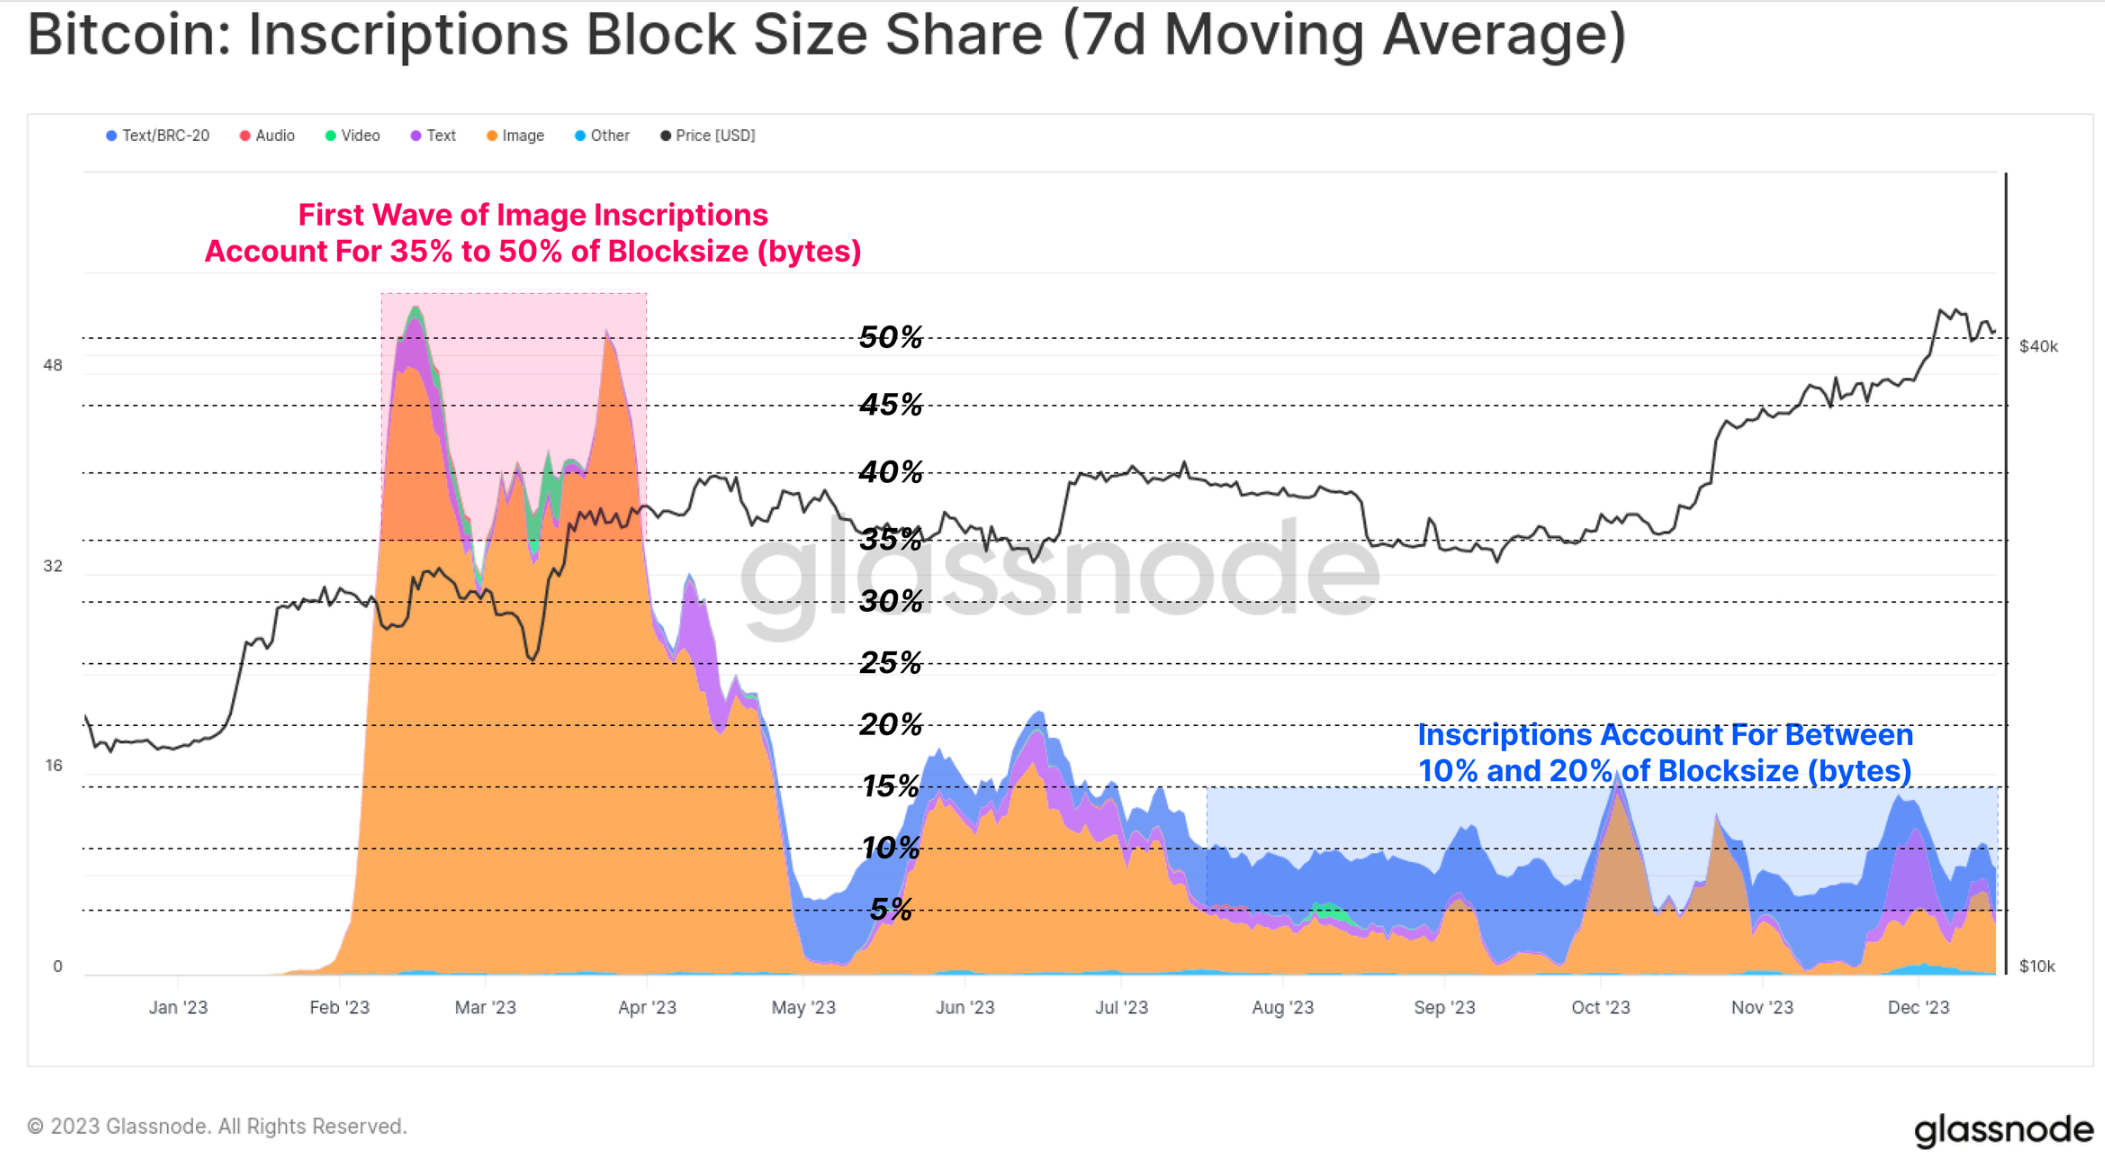
Inscriptions have contributed 15% to 30% of total miner transaction fee income this year. This highlights the non-intuitive nature of SegWit discounts, where inscription transactions consume a small portion of block space (in bytes) but pay a relatively large proportion of fees, while also accounting for about half of all confirmed transactions.
In fact, Inscriptions and SegWit data discounts allow miners to include more transactions in the same maximum size block, resulting in higher fee payments. If the demand for inscriptions continues, the impact on miner income could significantly improve miners' economics, especially with the fourth halving approaching.
Cross-Chain Bridges, Staking, and the Shanghai Upgrade
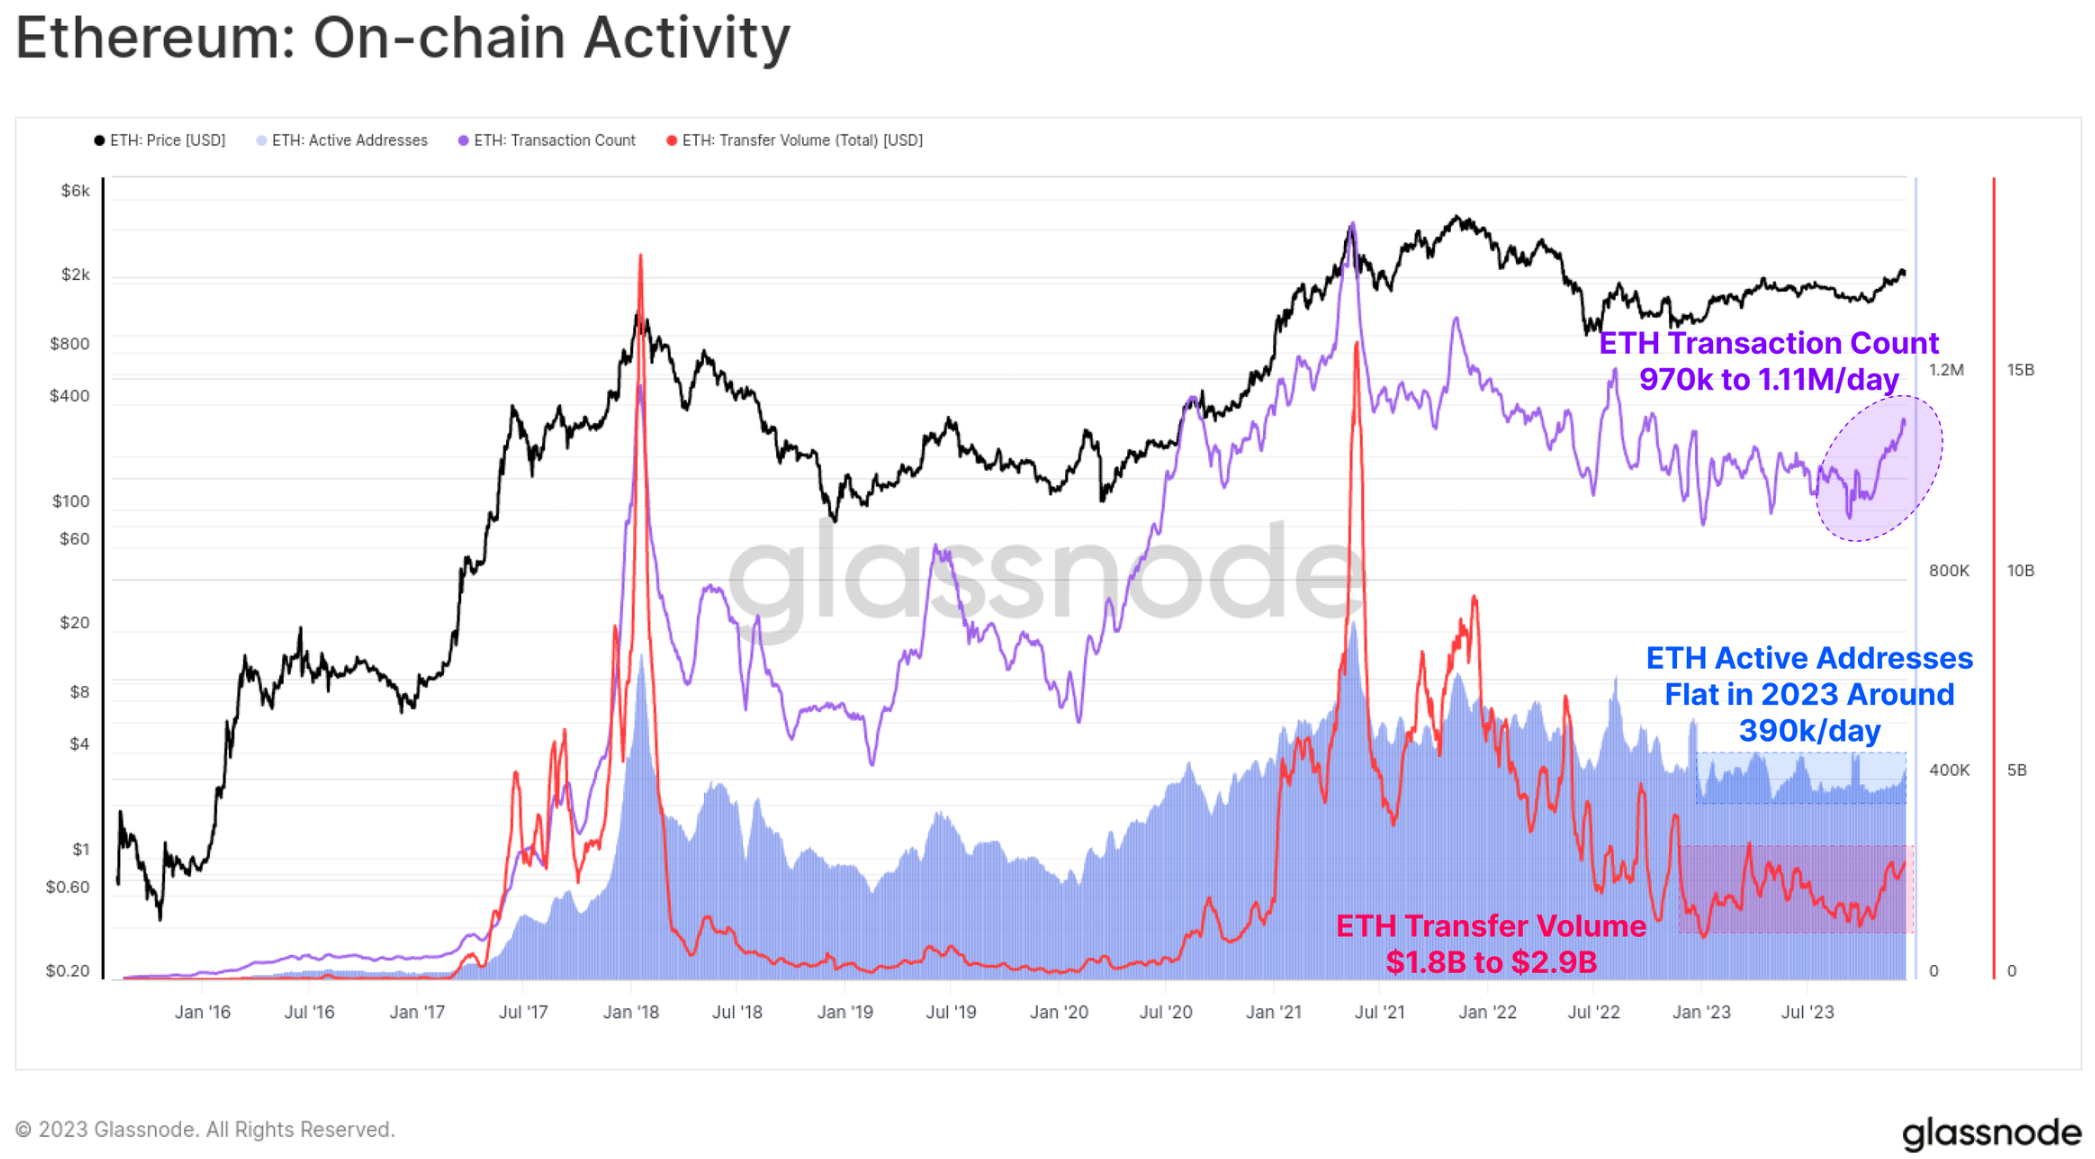
For Ethereum, on-chain activity has been somewhat subdued this year, with October once again being a significant turning point.
- Active addresses have remained relatively stable, at around 390,000 per day
- Transaction volume has recently increased from 970,000 per day to 1.11 million per day
- ETH transfer volume has increased from $1.8 billion per day to $2.9 billion per day
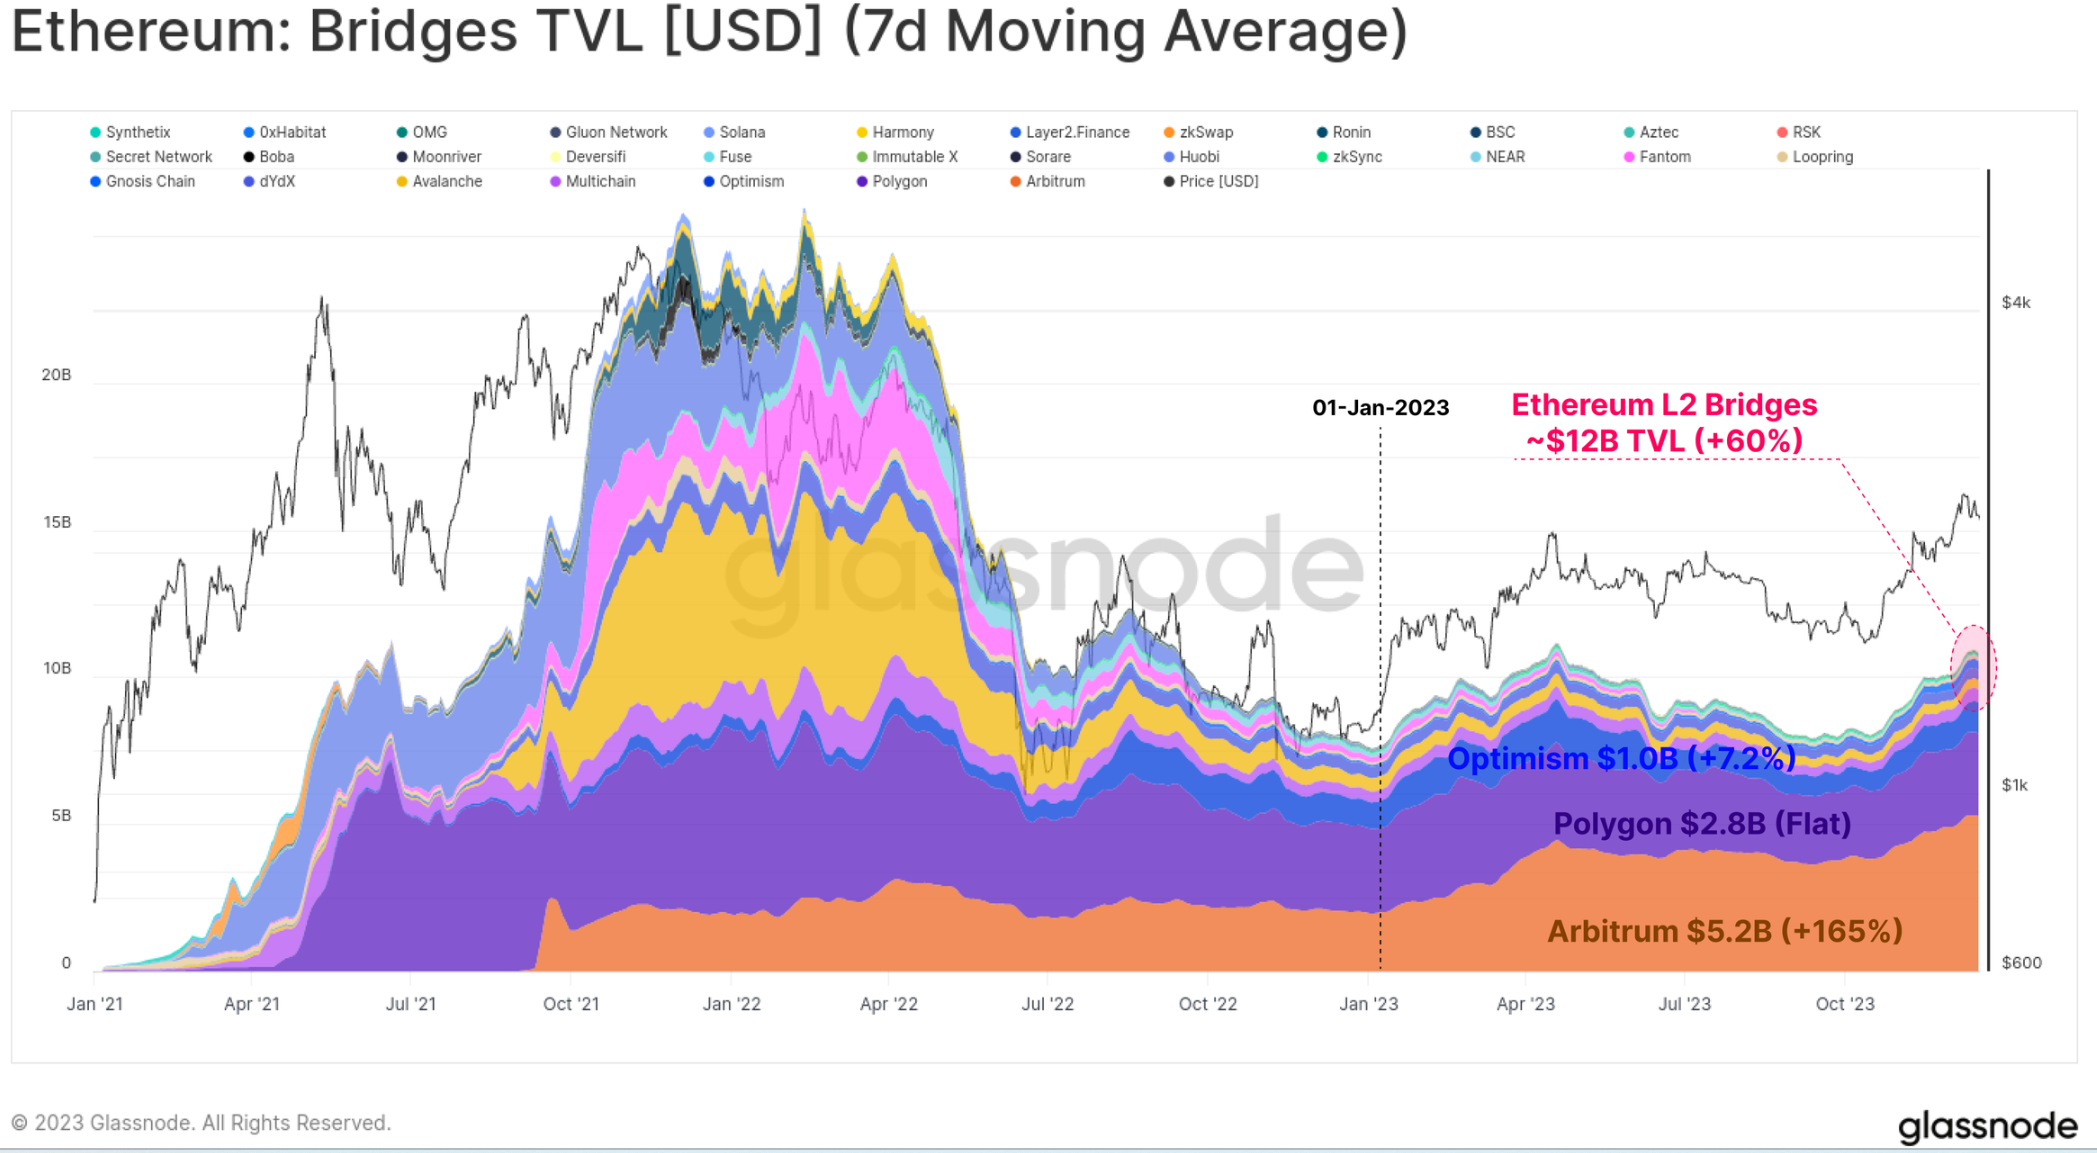
While ETH's market price performance has lagged behind the broader digital asset space, its ecosystem continues to expand, mature, and develop. In particular, the total value locked in the expanding Layer-2 blockchains has increased by 60%, with over $12 billion now locked in bridges.
These L2 chains are seeking to expand and extend Ethereum block space while anchoring their data and finality to the Ethereum main chain to maintain its security.
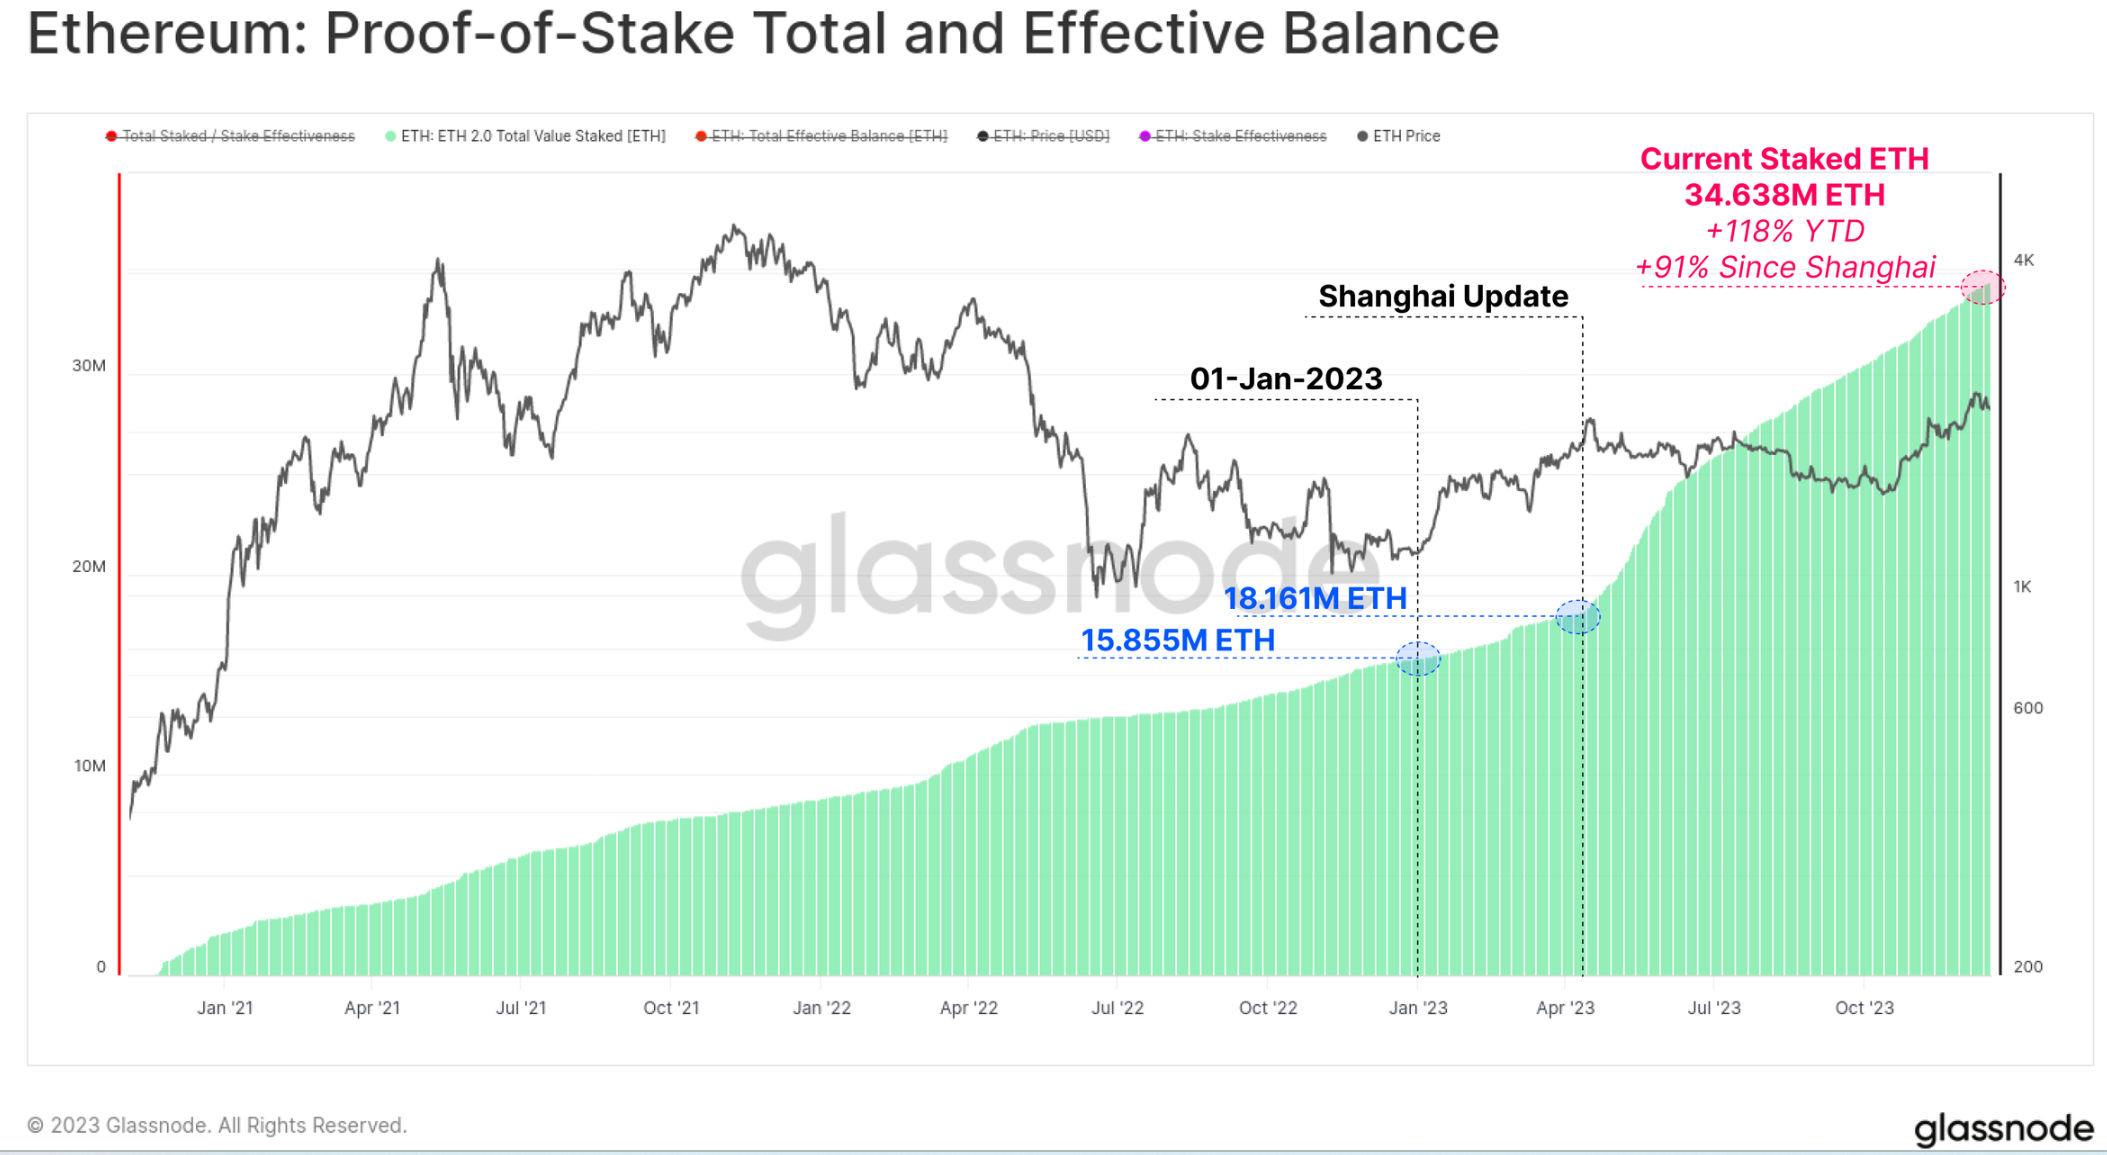
Another key growth area for Ethereum is the total amount of ETH staked through the new proof-of-stake consensus mechanism. The amount of staked ETH has grown by 119% this year, with over 34.638 million ETH currently locked in staking protocols. The Shanghai upgrade also successfully launched in April, allowing stakers to complete withdrawals for the first time since the launch of the Beacon chain in December 2020, reshuffling staking providers and settings.
Looking Ahead
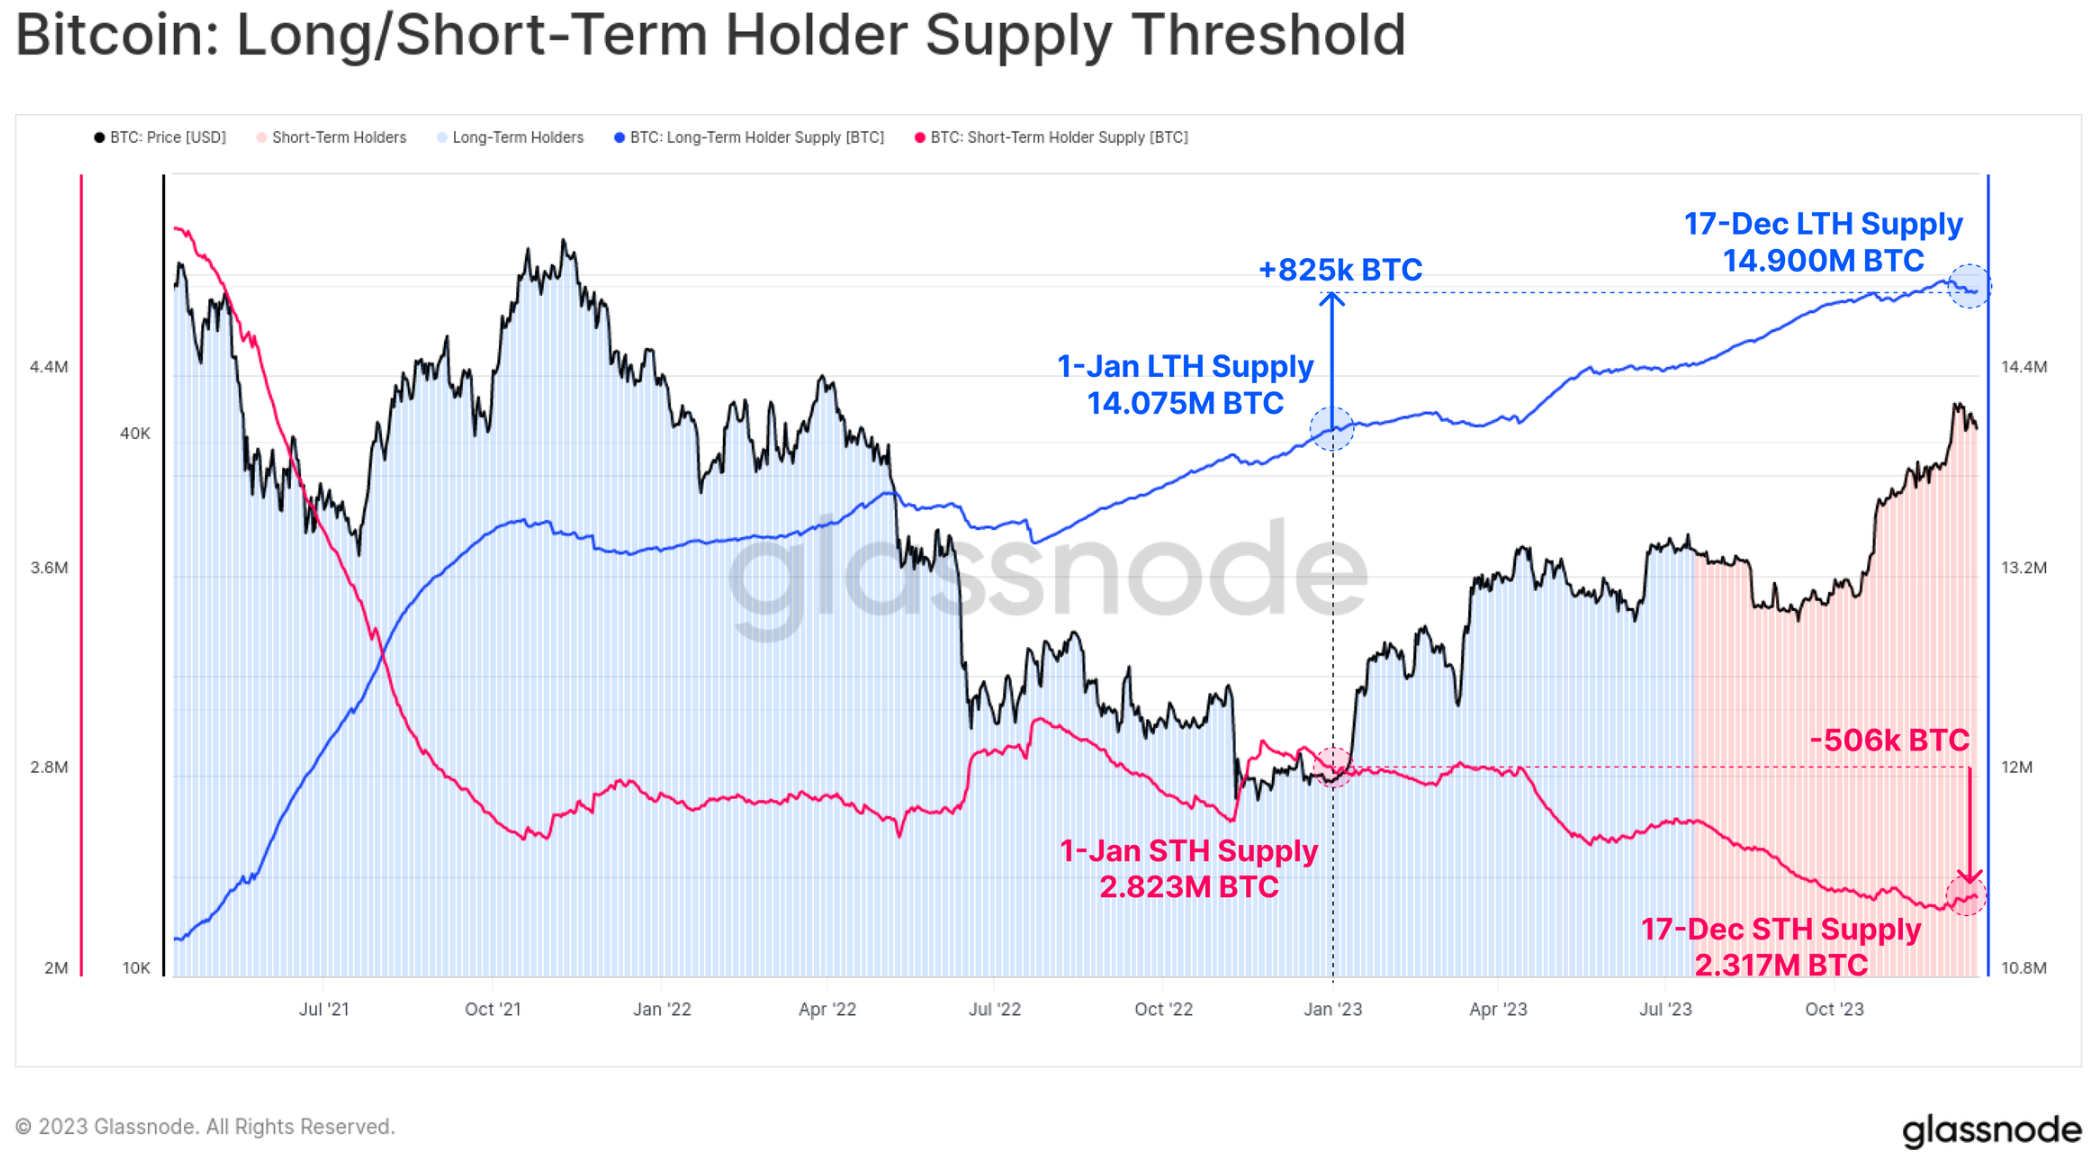
Despite the incredible price performance of Bitcoin, a large portion of Bitcoin remains dormant and has reached the status of long-term holders in investor wallets. Out of the total circulating supply of 195.74 million BTC, over 149 million (76.1%) are held outside of exchanges and have not moved for over 155 days, adding 825,000 BTC so far this year. This has also brought the supply of short-term holders to a historical low of 2.317 million BTC.
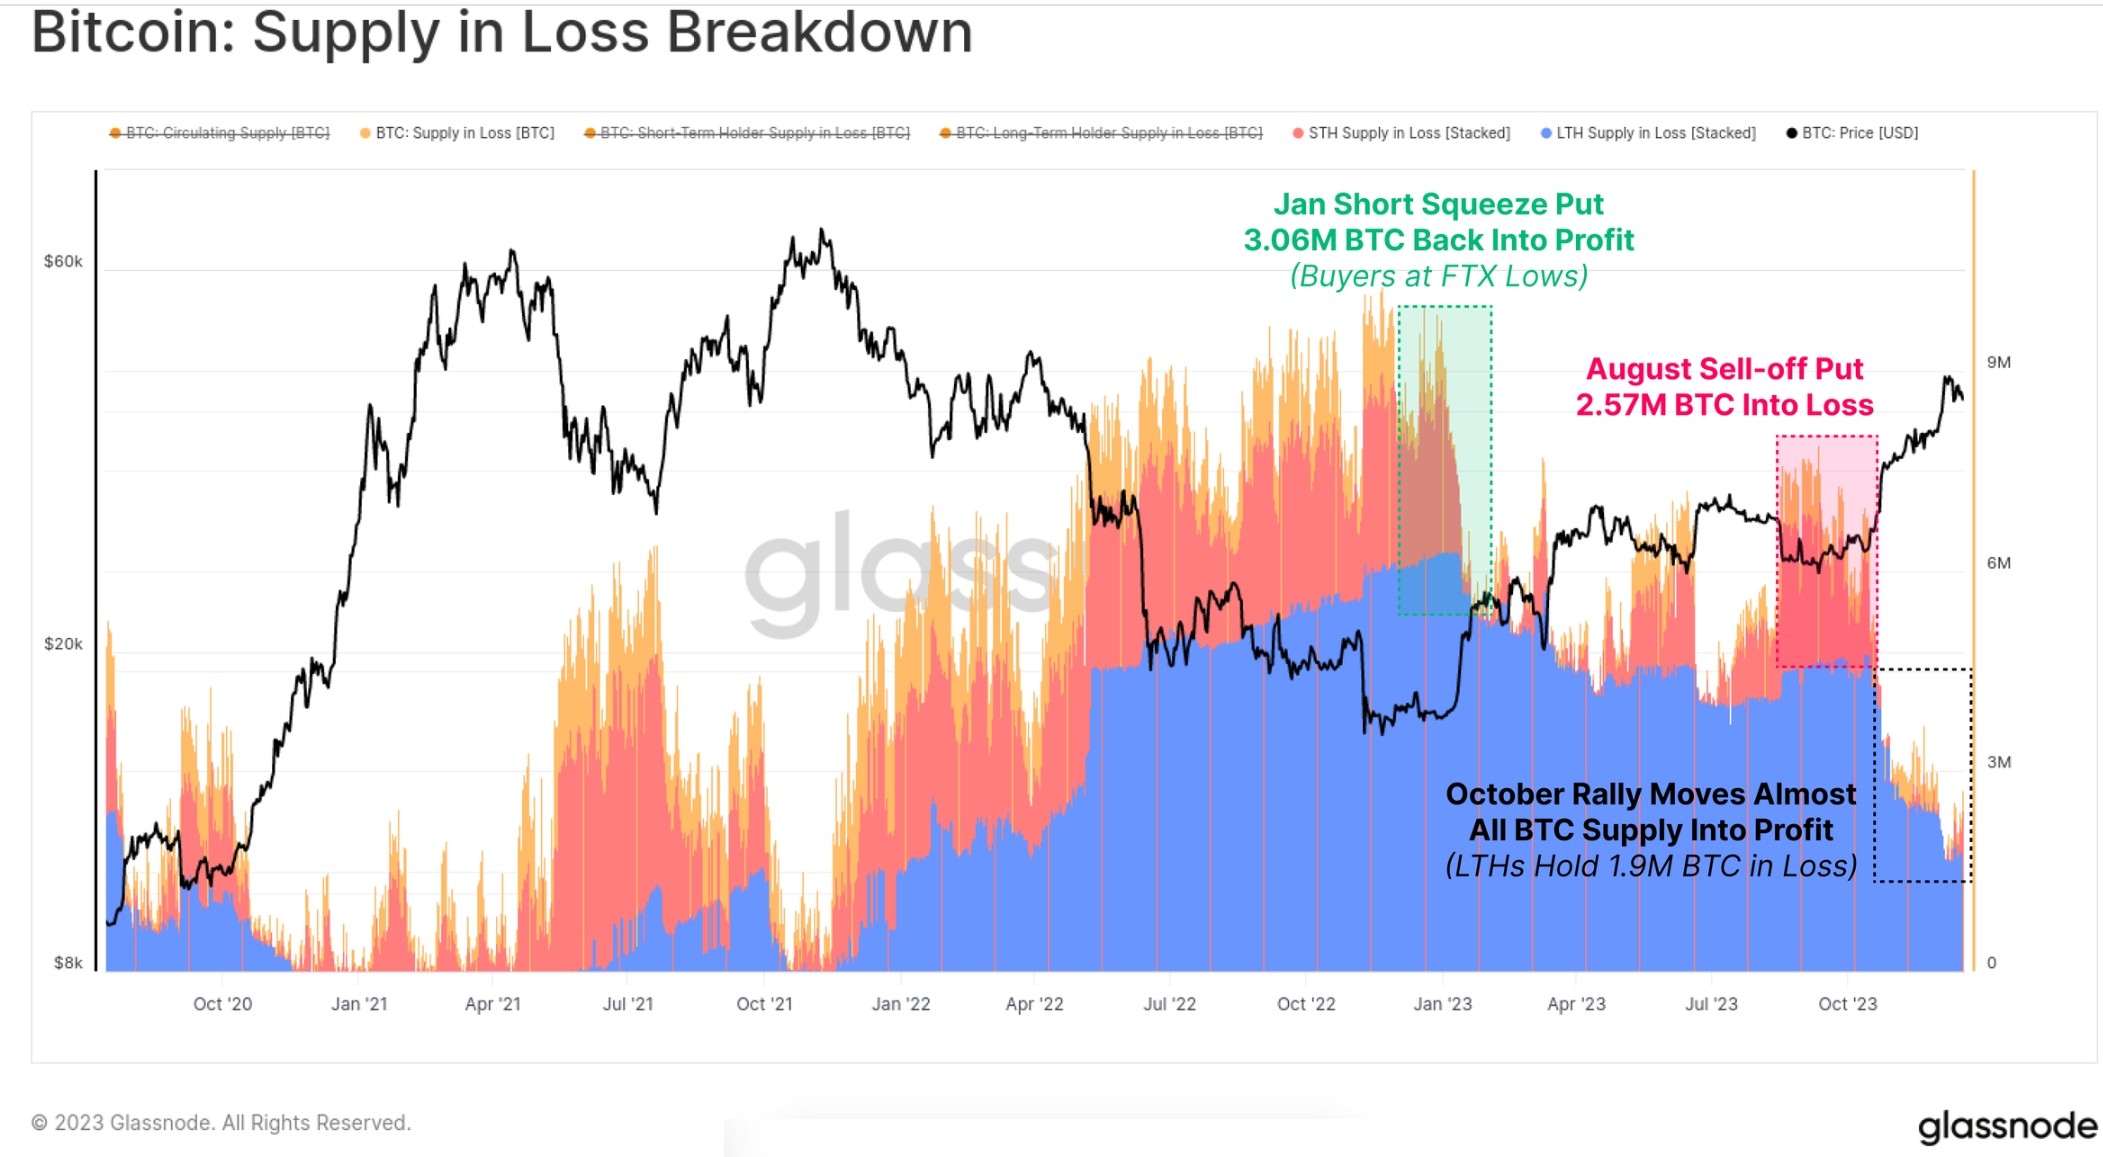
As the market rebounds, the majority of investors' tokens have now recovered to a "profitable" state, either due to changing hands or rising prices above the cost basis. The chart below shows how the total amount of "loss-making" tokens has decreased to around 1.9 million BTC, most of which are held by long-term holders who bought near the 2021 peak.
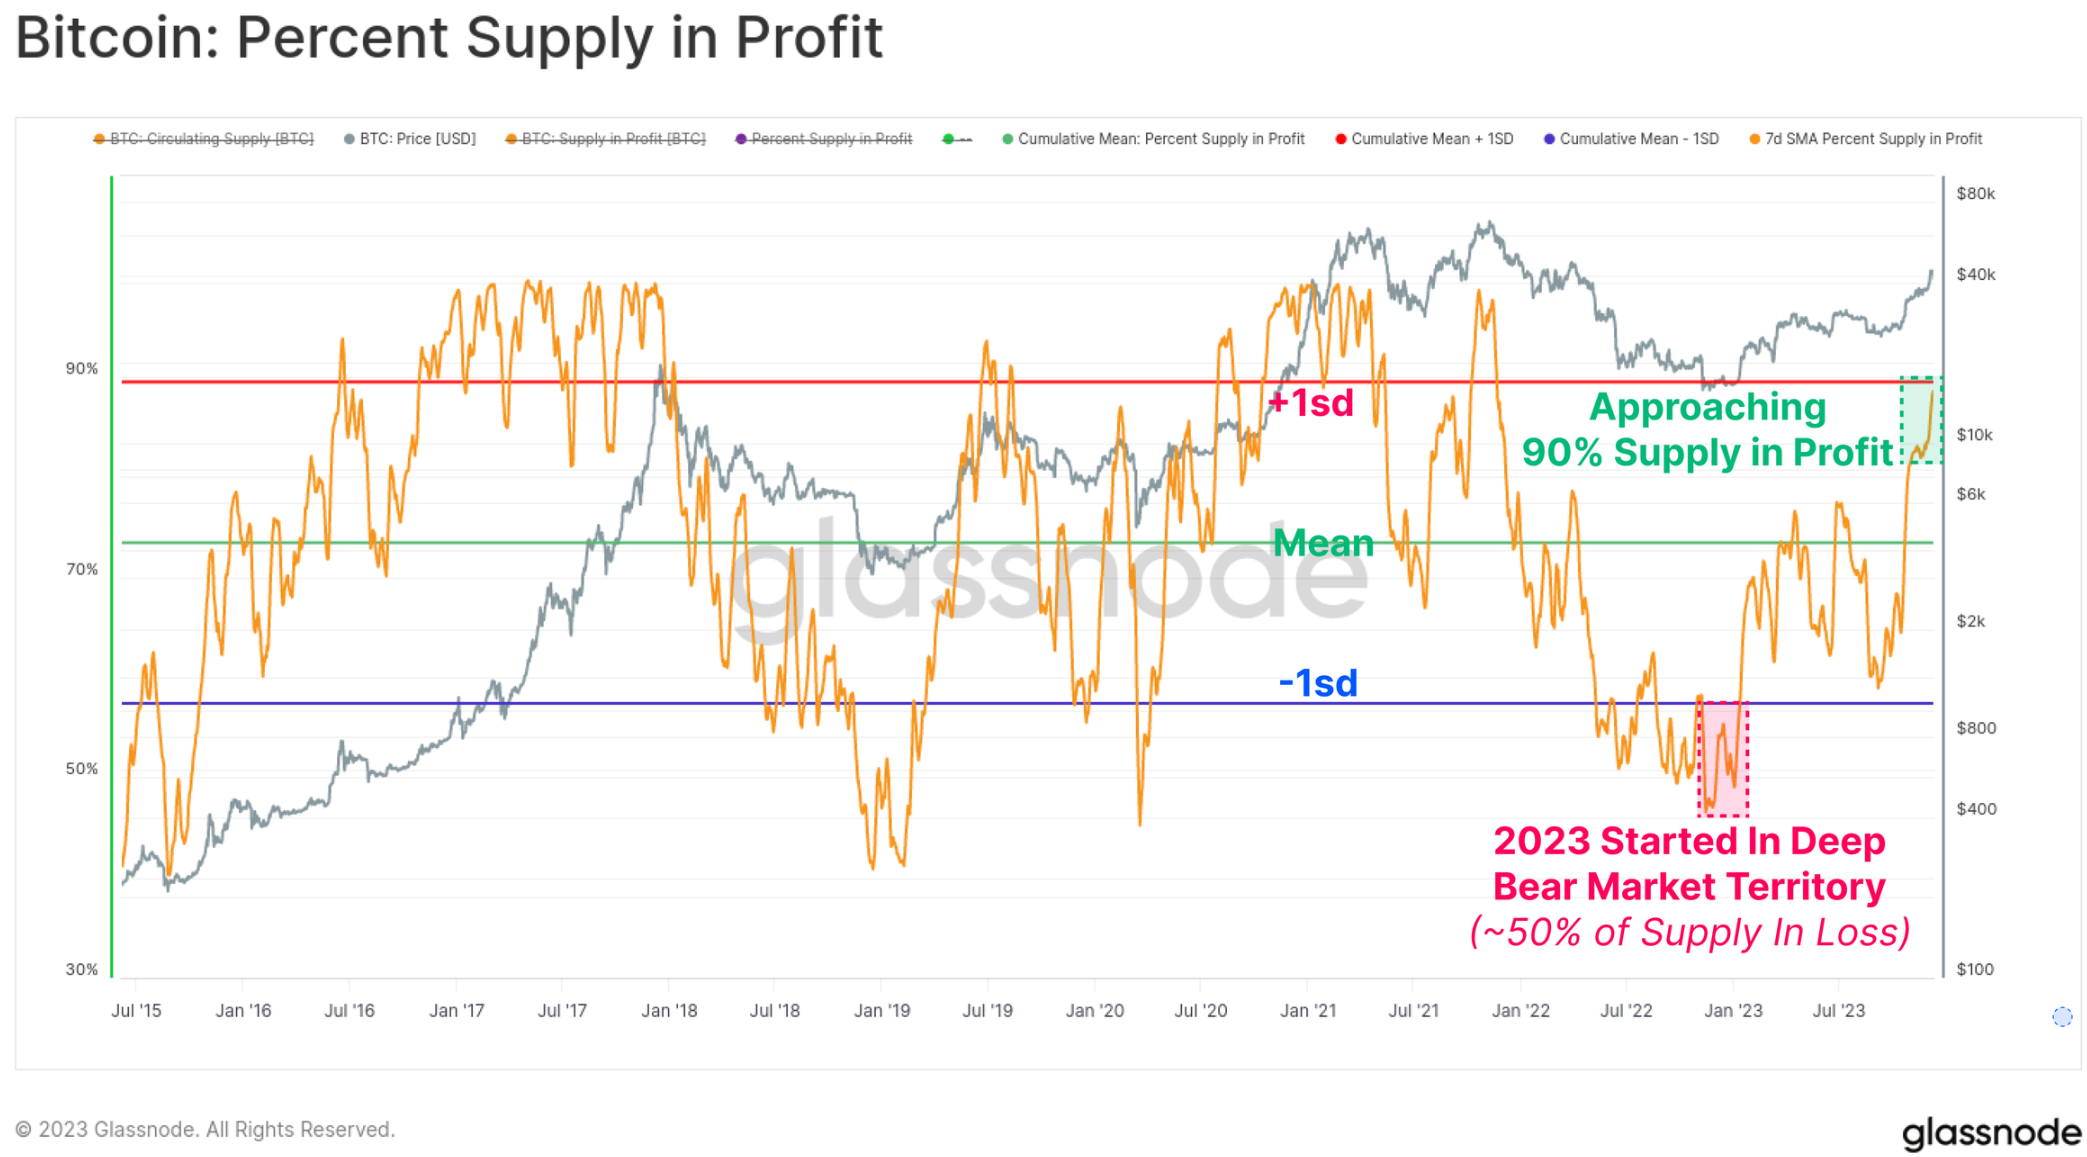
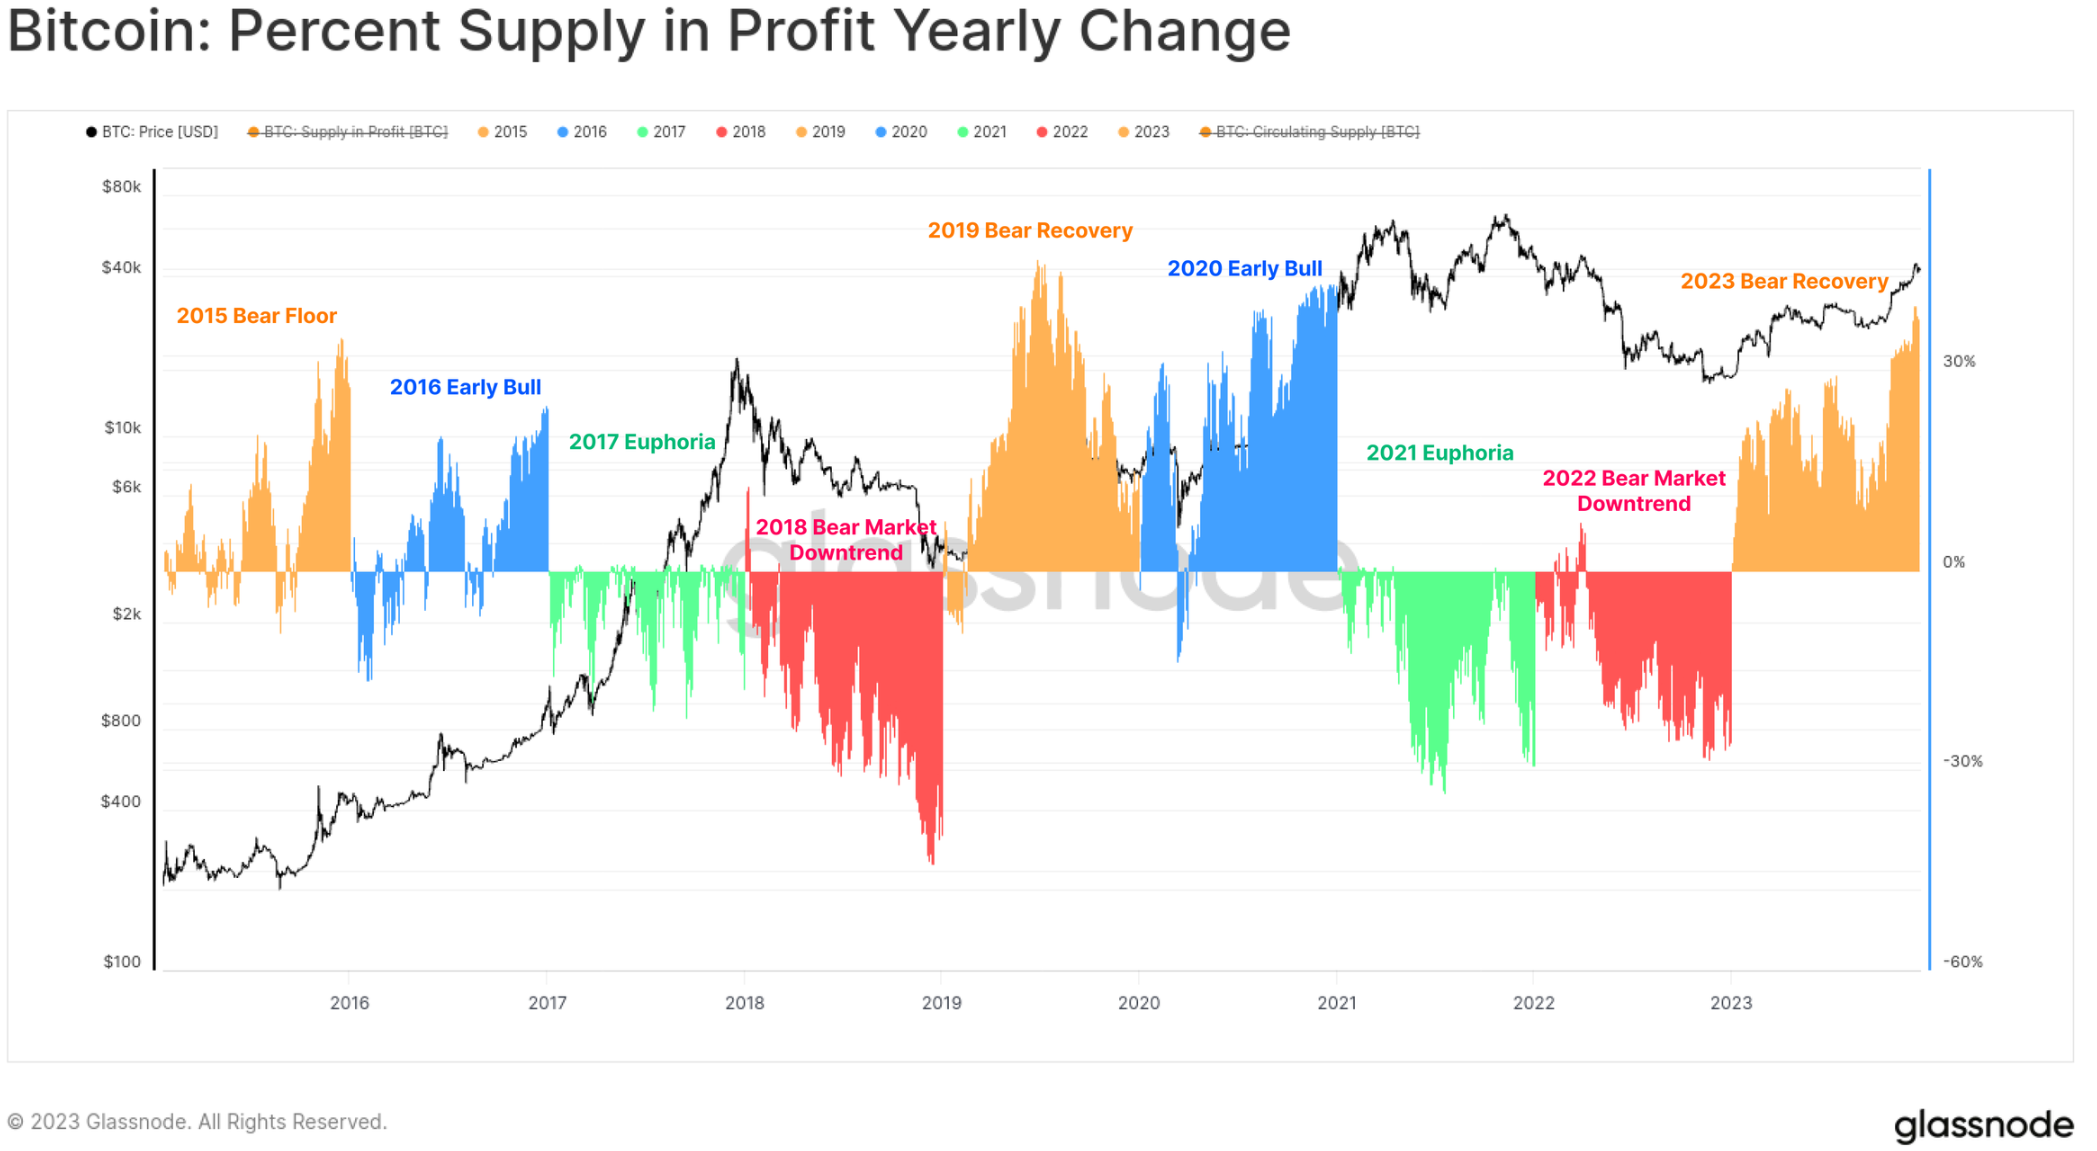
On the other hand, the "profitable" supply currently accounts for over 90% of the circulating supply, with the October rebound putting it above historical average levels. With over 50% of the supply underwater at the start of 2023, this is one of the fastest recoveries in history (second only to the rebound in 2019).
The chart below intuitively shows the percentage change in profit supply for each calendar year since 2015. While the division by year is not perfect, the classic four-year Bitcoin cycle allows us to identify some interesting patterns:
🟠 Bear Market/Recovery Phase - the largest increase in profit supply occurs as tokens surrender near the low point and return to the profitable zone.
🔵 Early Bull Market - the overall upward trend results in most tokens being profitable and rebounding to new highs.
🟢 Late Bull Market - the market is at ATH levels, leading to small positive to negative readings as all tokens are already profitable, and the market is nearing exhaustion.
🔴 Major Bear Market after Market Peak - a large number of tokens fall into a loss-making state.
While the structure is simple, this framework does highlight similarities between the progress made in 2015-16, 2019-20, and 2023 to date.
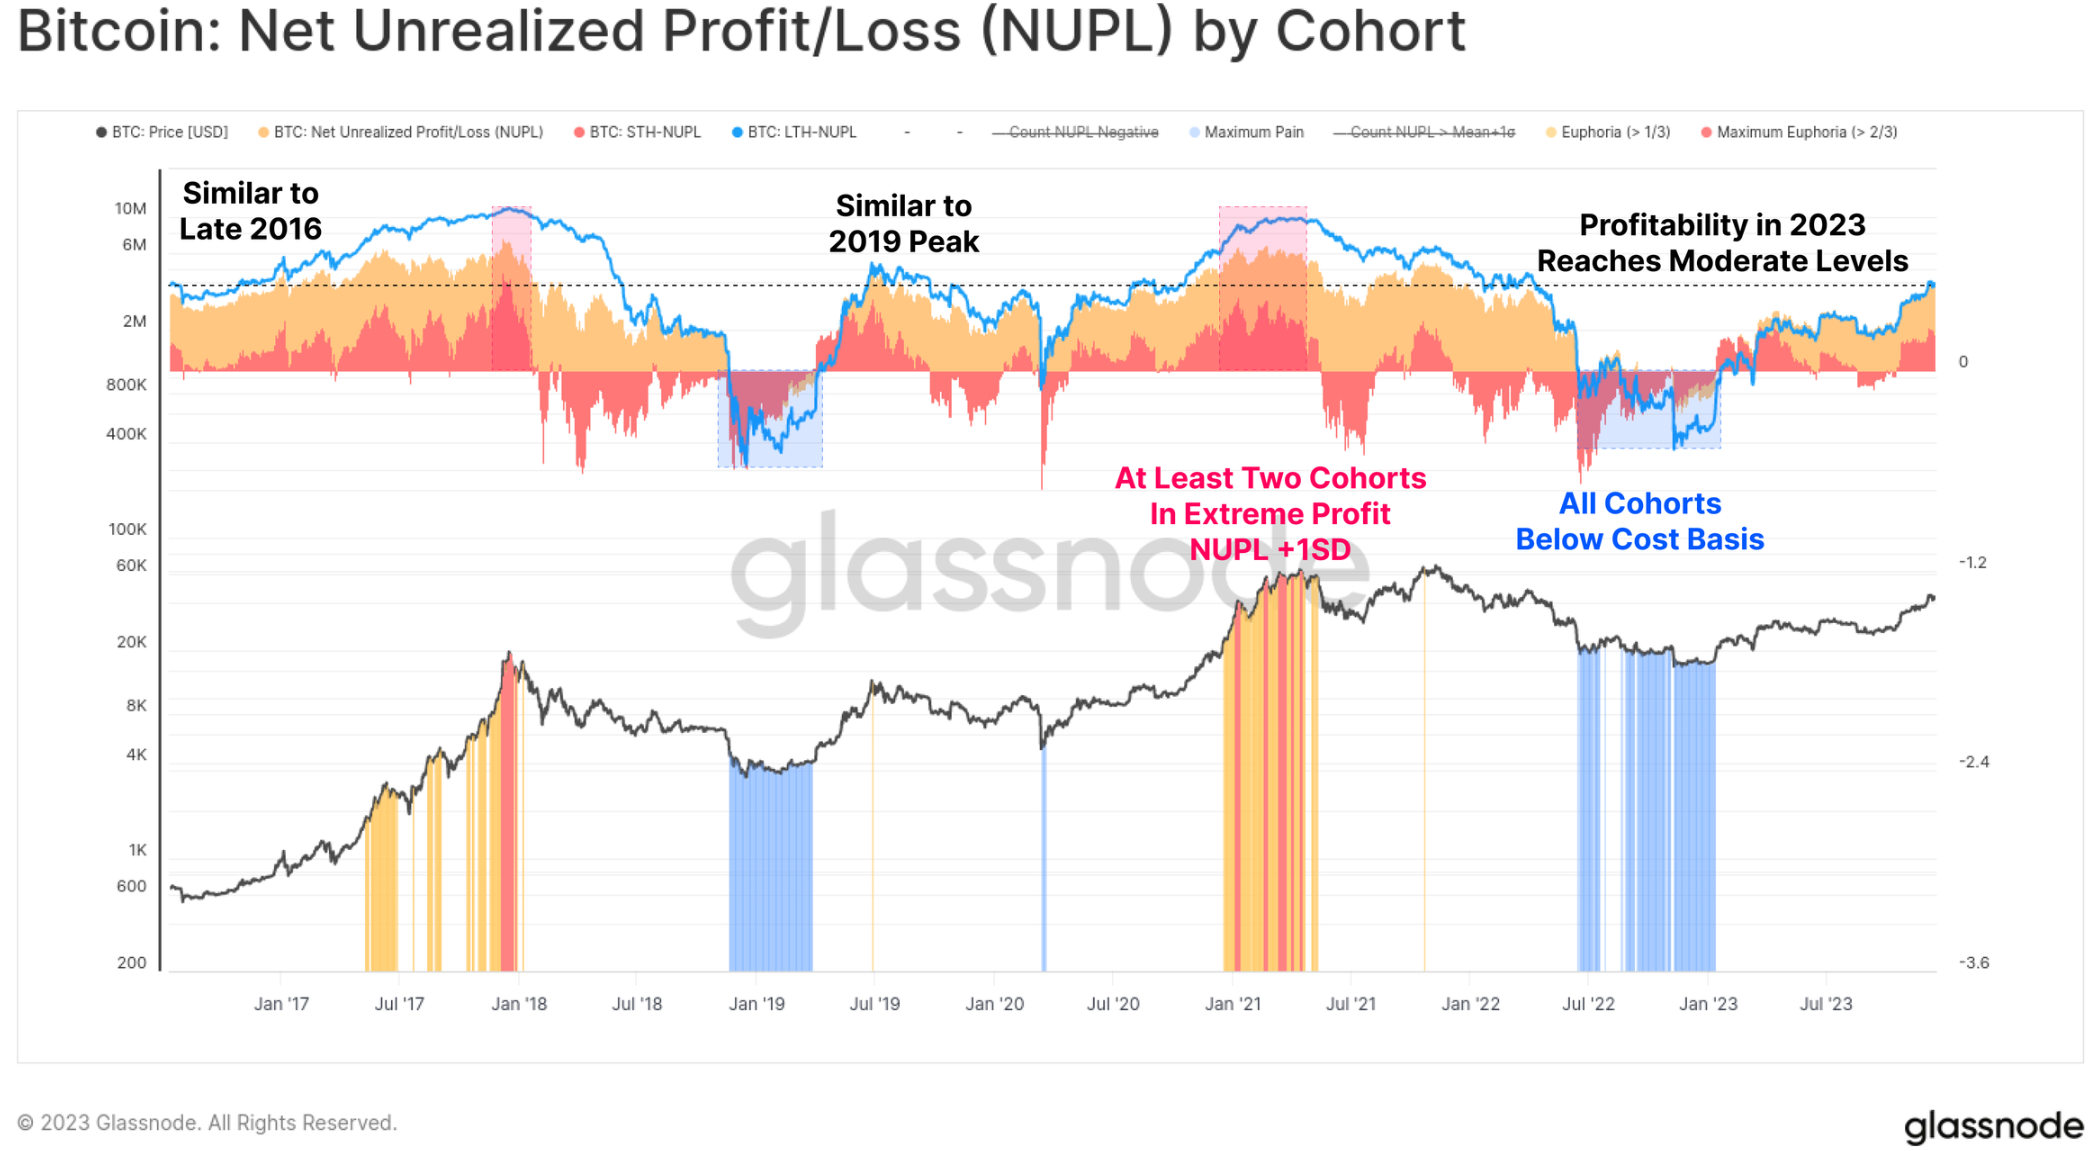
Finally, on the topic of investor profitability, 2023 has seen long-term holders, short-term holders, and regular holders transition from unprofitable to moderately profitable states. The NUPL indicator for each cohort has not reached exciting highs, but is significantly higher than the breakeven levels for each cohort.
Maturing Derivatives Market
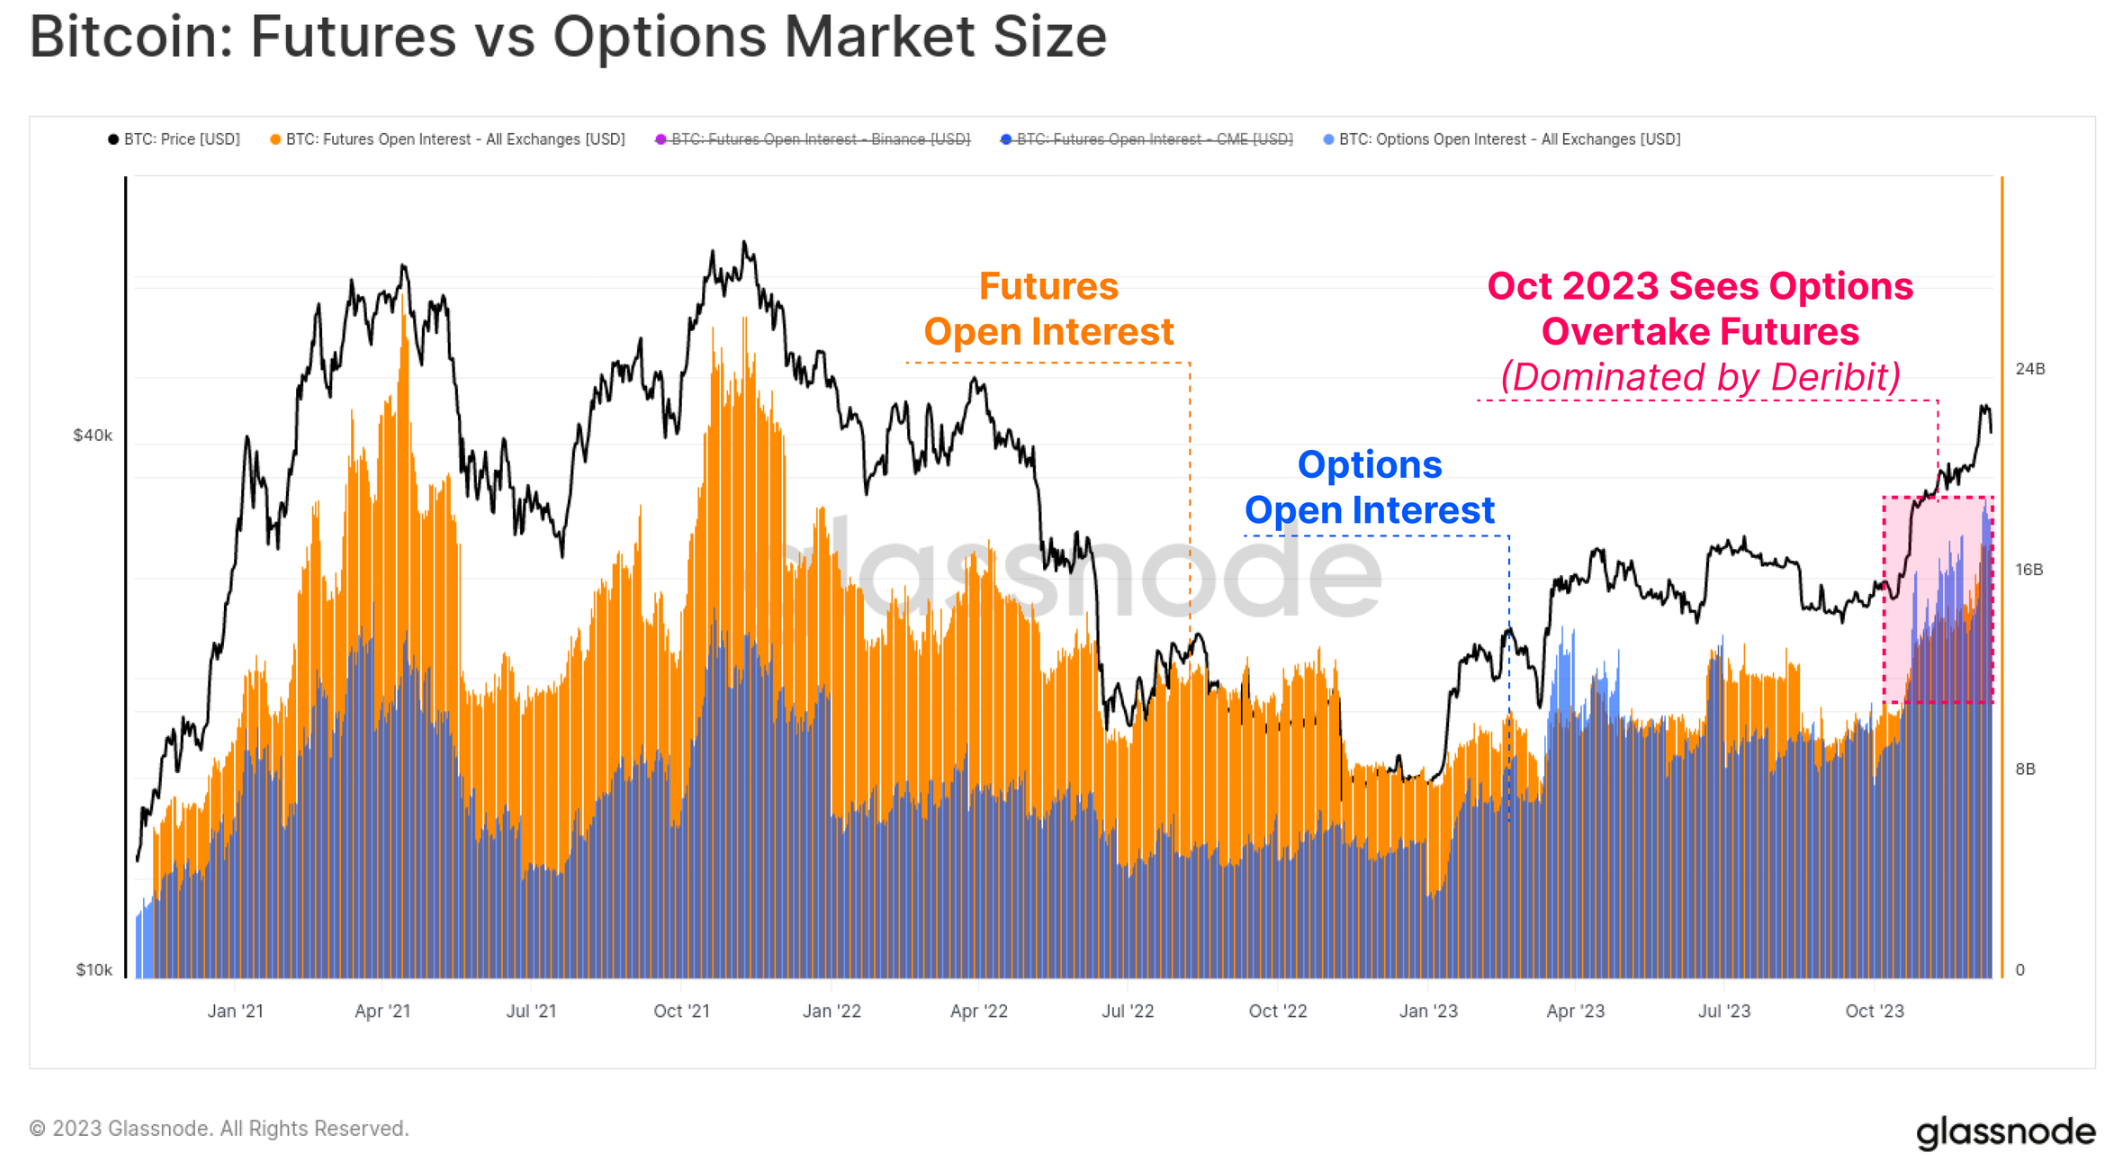
A significant feature of the 2020-23 cycle is the emergence of the futures and options markets as the preferred venues for price exposure and liquidity. 2023 has proven to be an important year in this maturation process, as the open interest in the options market has grown to be comparable to, or even surpass, that of the futures market.
Currently, the open interest for both is between $16 billion and $20 billion, with Deribit continuing to dominate the options space (90%+). This implies a growing institutional interest in Bitcoin, as traders and positions utilize the options market for more complex trading, risk management, and hedging strategies.
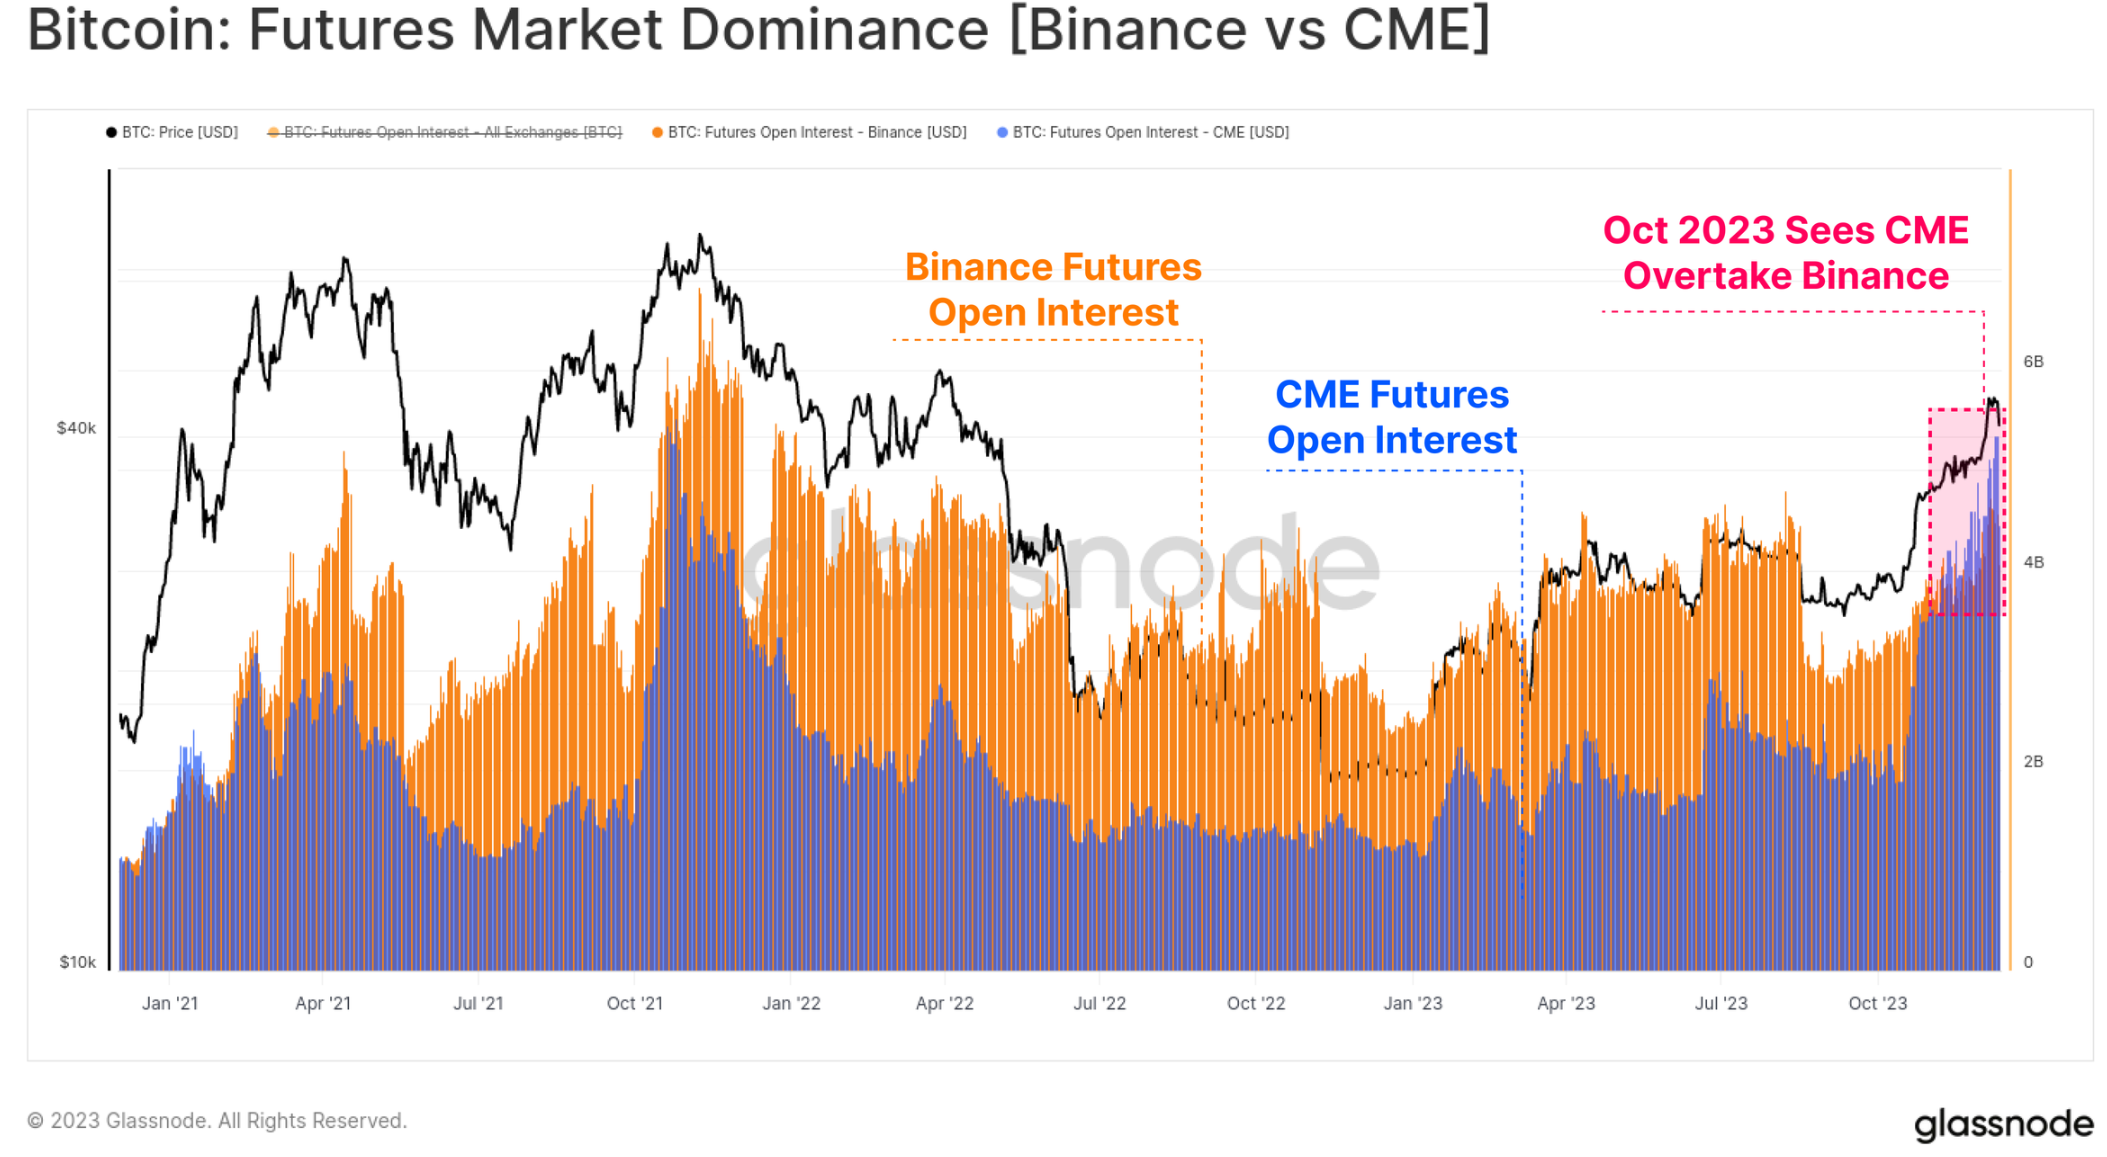
Within the futures market, there has also been a notable shift in dominance, with the regulated Chicago Mercantile Exchange (CME) holding historically more open interest than offshore exchange Binance for the first time. October seems to be another important moment in this transition, indicating an influx of institutional capital.
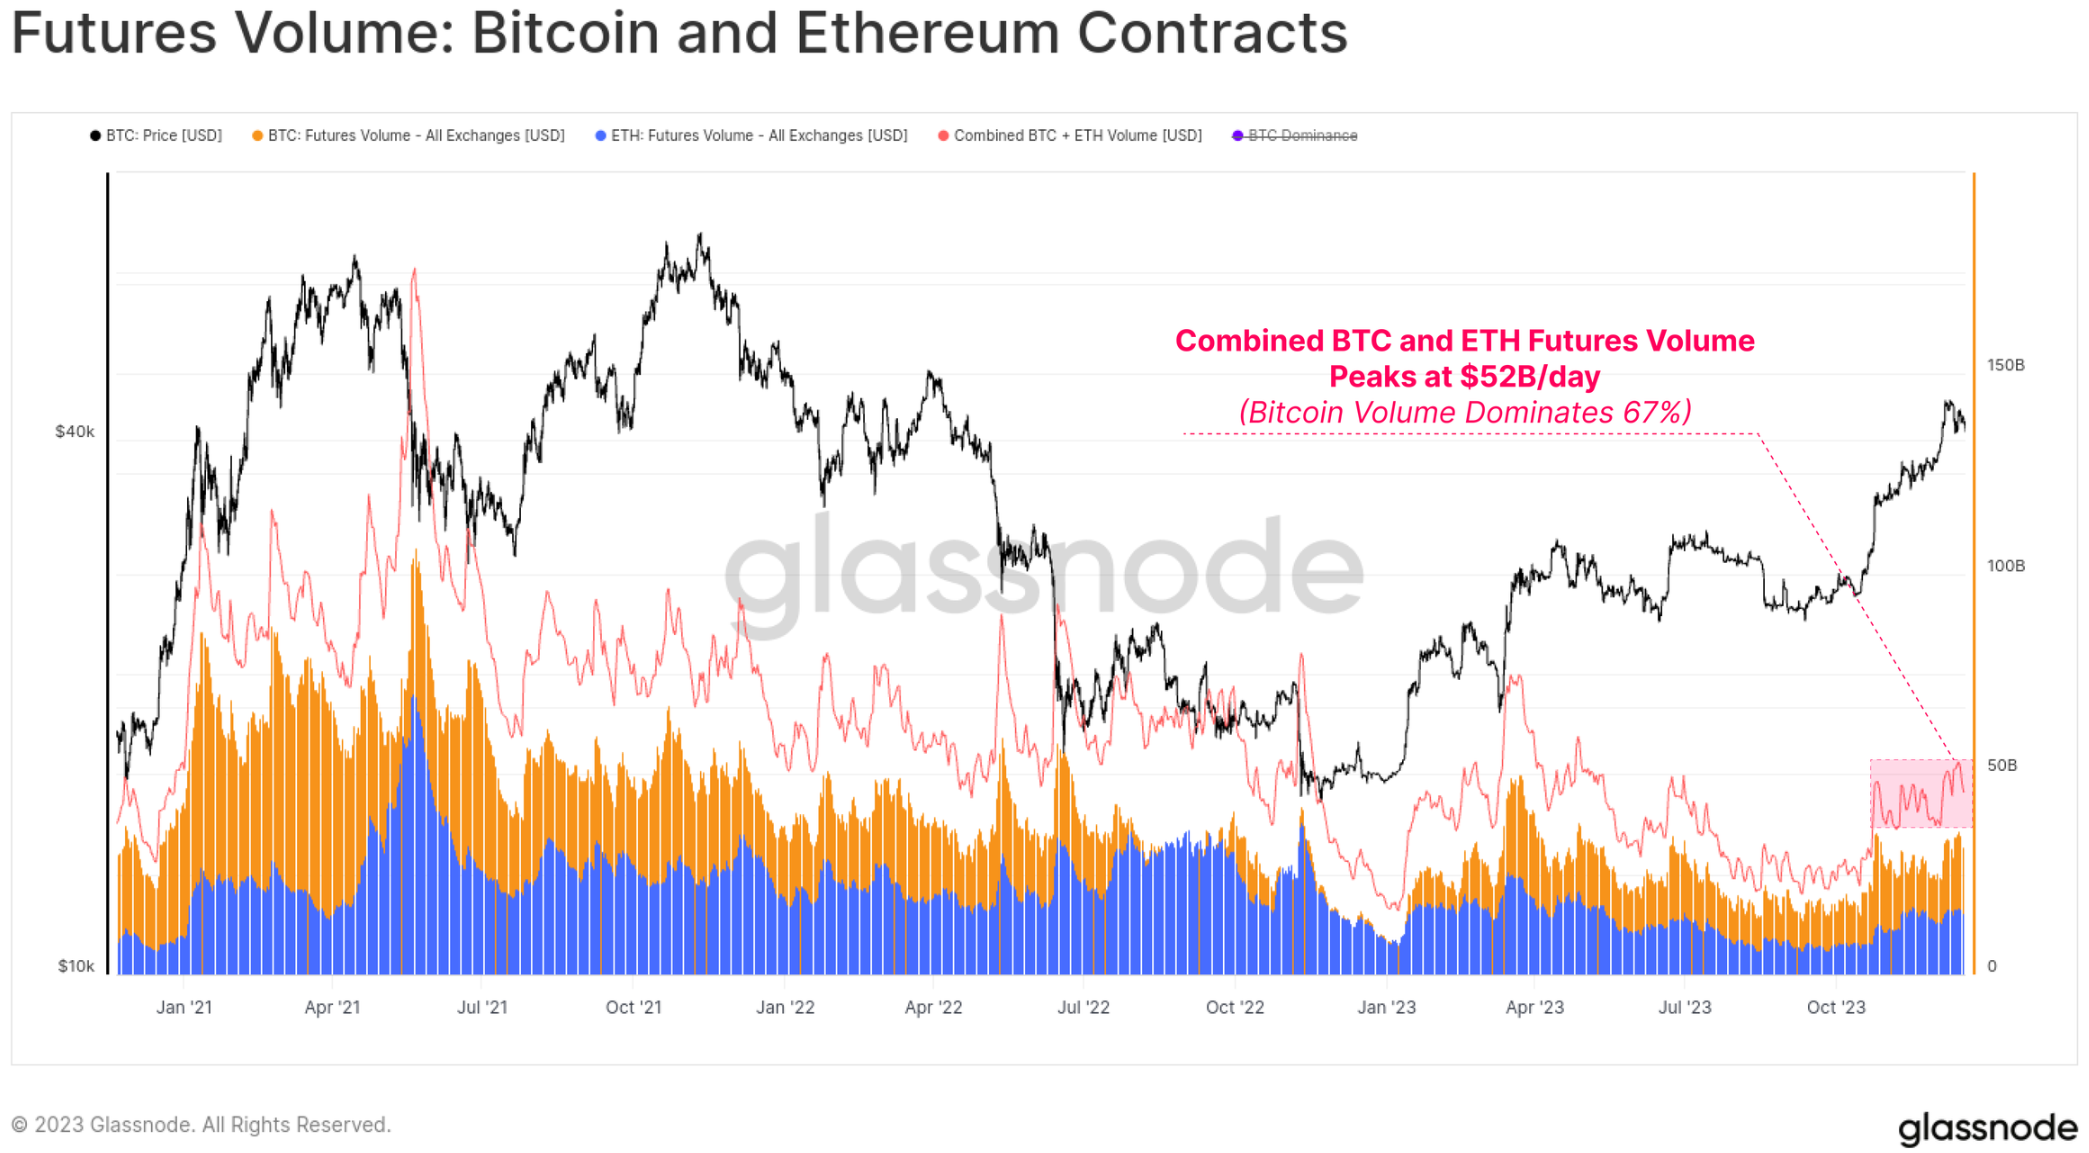
The futures trading volume for BTC and ETH saw an increase in October, with a total daily trading volume of $52 billion. Bitcoin contracts accounted for around 67% of the volume, while Ethereum contracts accounted for 33%.
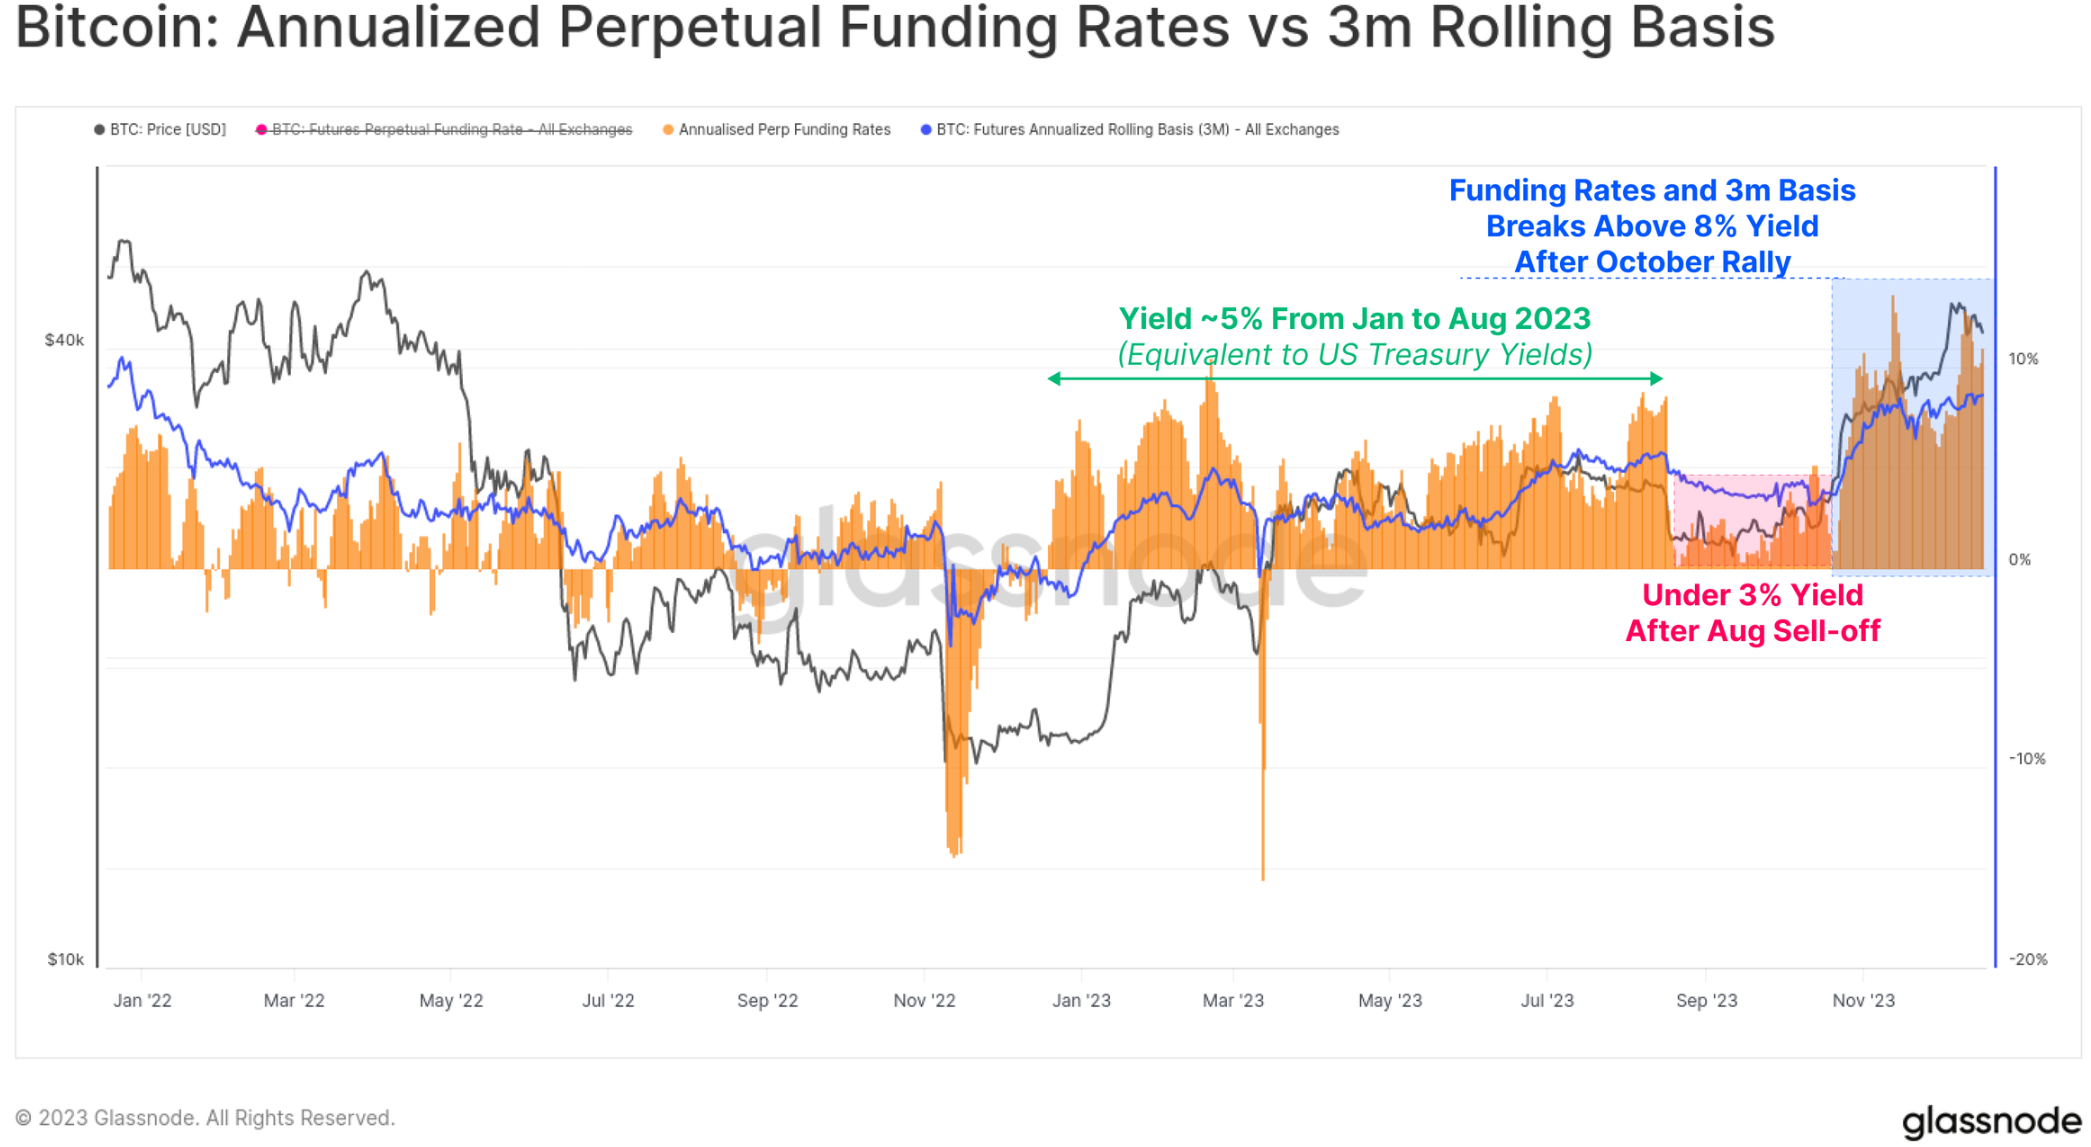
The cash and carry yield in the futures market has gone through three different phases over the year, telling the story of capital inflows into the space:
- January to August - yield fluctuated around 5%. This largely aligns with short-term US Treasury yields, making it relatively unattractive considering the additional risks and complexities of trading.
- August to October - after the sell-off to $26,000, the yield dropped below 3%, and the volatility environment unexpectedly remained low.
- From October - the yield broke 8%. With the futures basis currently maintained at a level 300 basis points above US Treasuries, market makers now have an incentive to re-enter the digital asset space.
Stablecoin Supply
A relatively new phenomenon in the previous cycle is the significant role stablecoins play in the market structure, becoming the preferred quoting currency for traders and the primary source of market liquidity.
Since March 2022, the total supply of stablecoins has been declining, decreasing by -26% from the peak, becoming a major resistance to market liquidity. This is due to a combination of regulatory pressure (SEC charges BUSD as a security), capital rotation (preference for US Treasuries over interest-free stablecoins), and waning investor interest in the bear market.
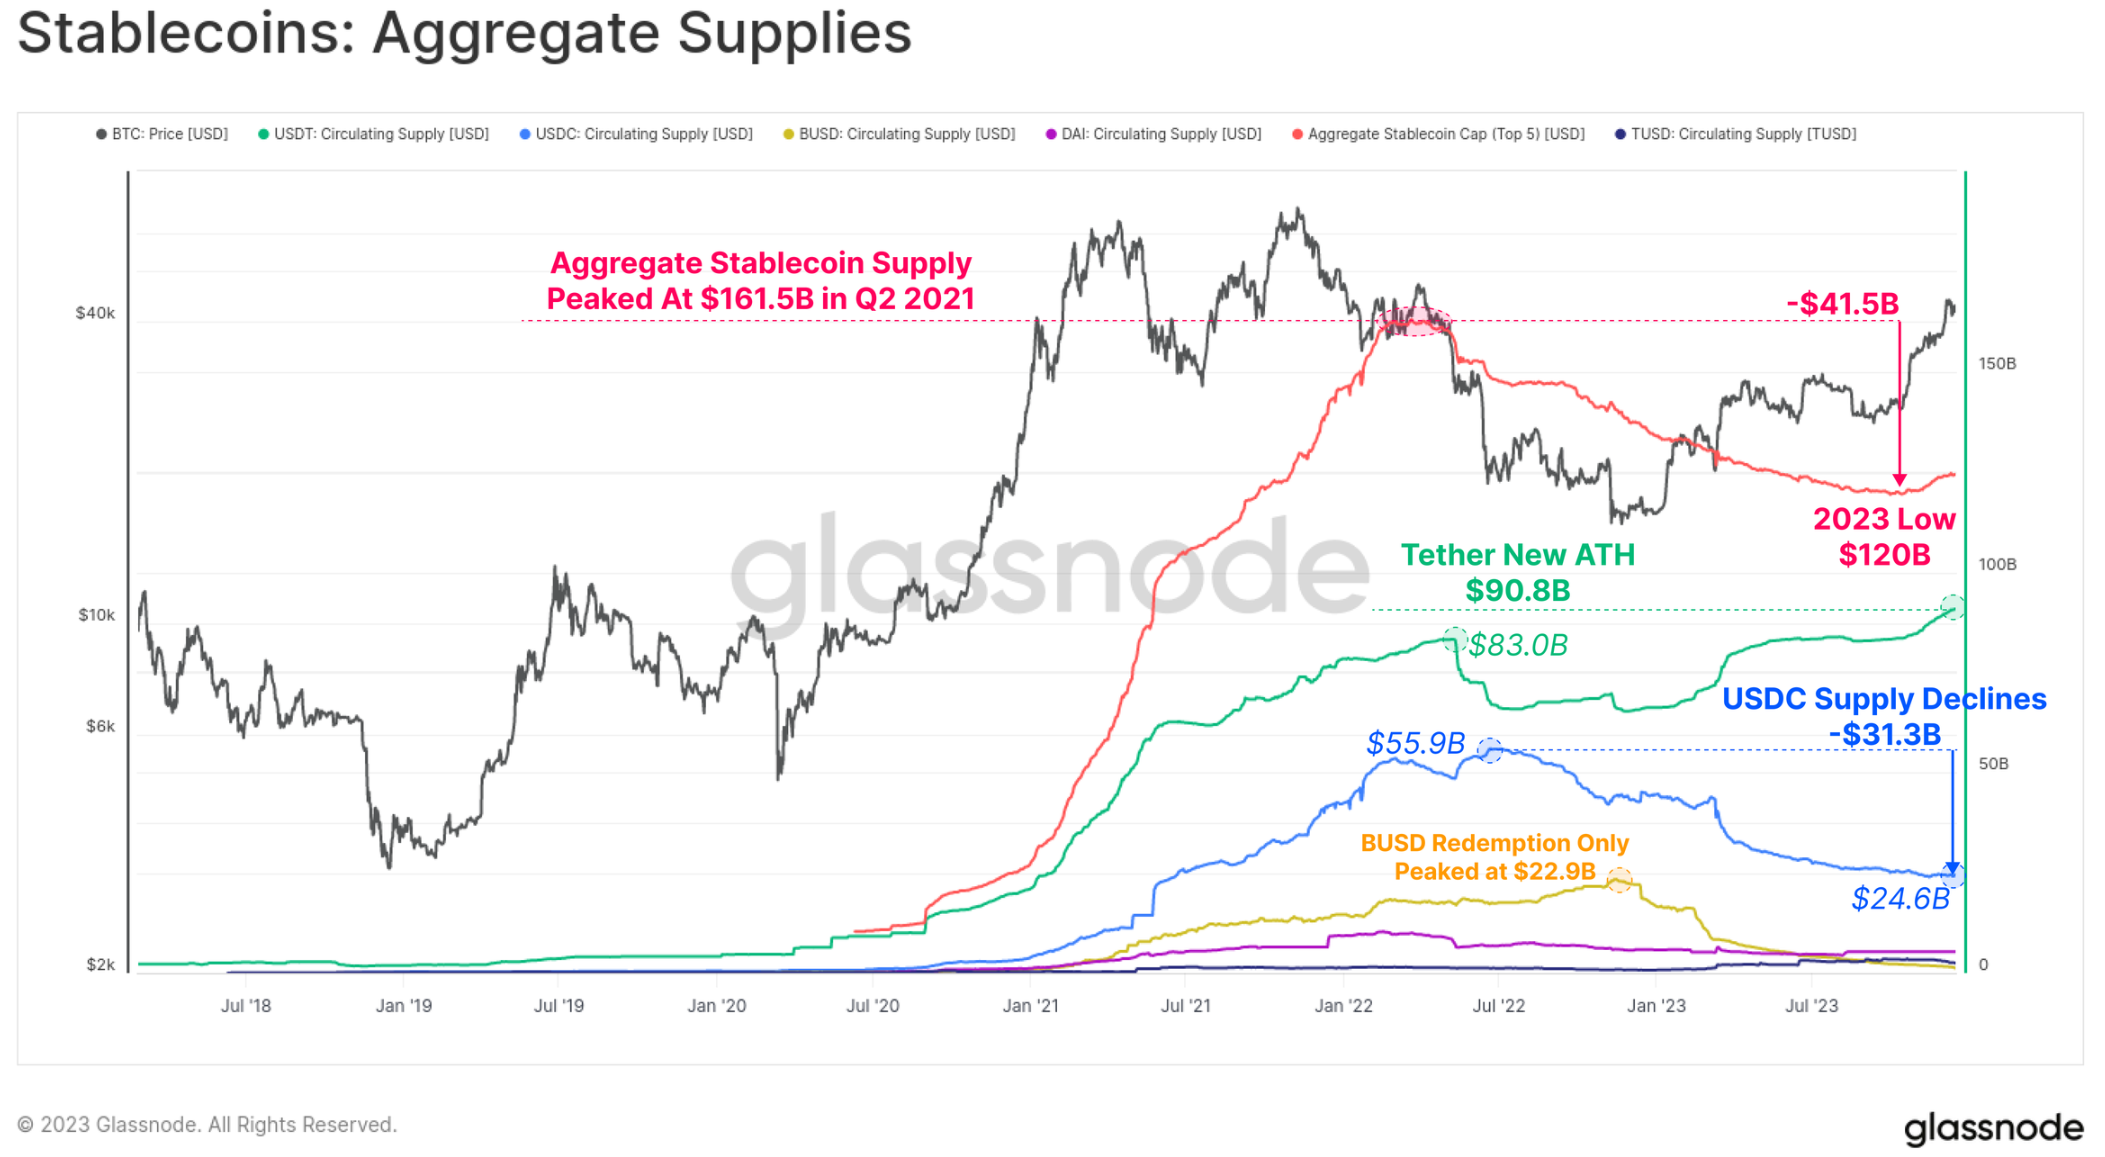
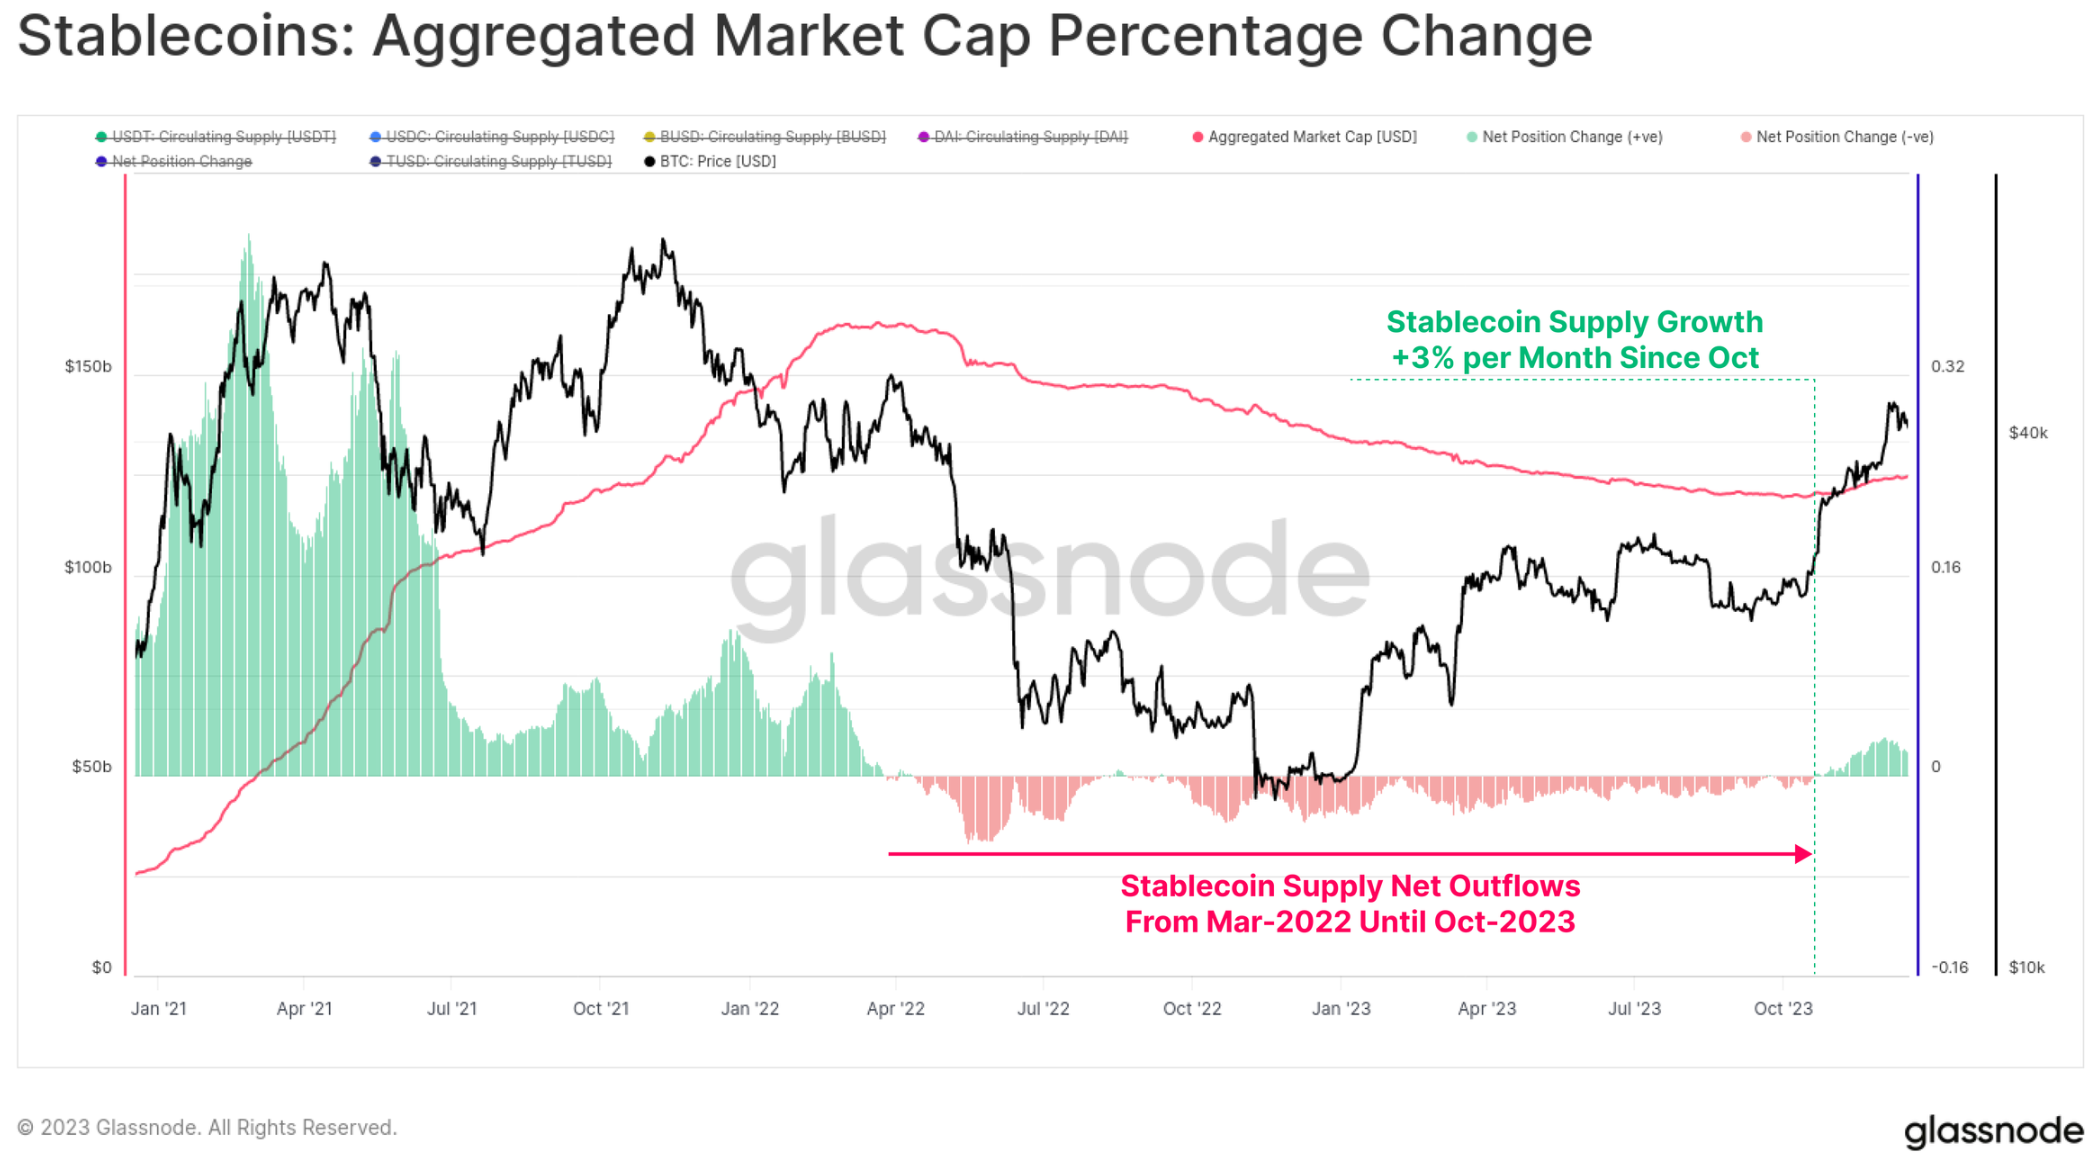
However, October marks a key point, as the total supply of stablecoins bottomed out at $120 billion, and the supply is now growing at a rate of up to 3% per month. This is the first expansion of stablecoin supply since March 2022 and may be a sign of renewed investor interest.
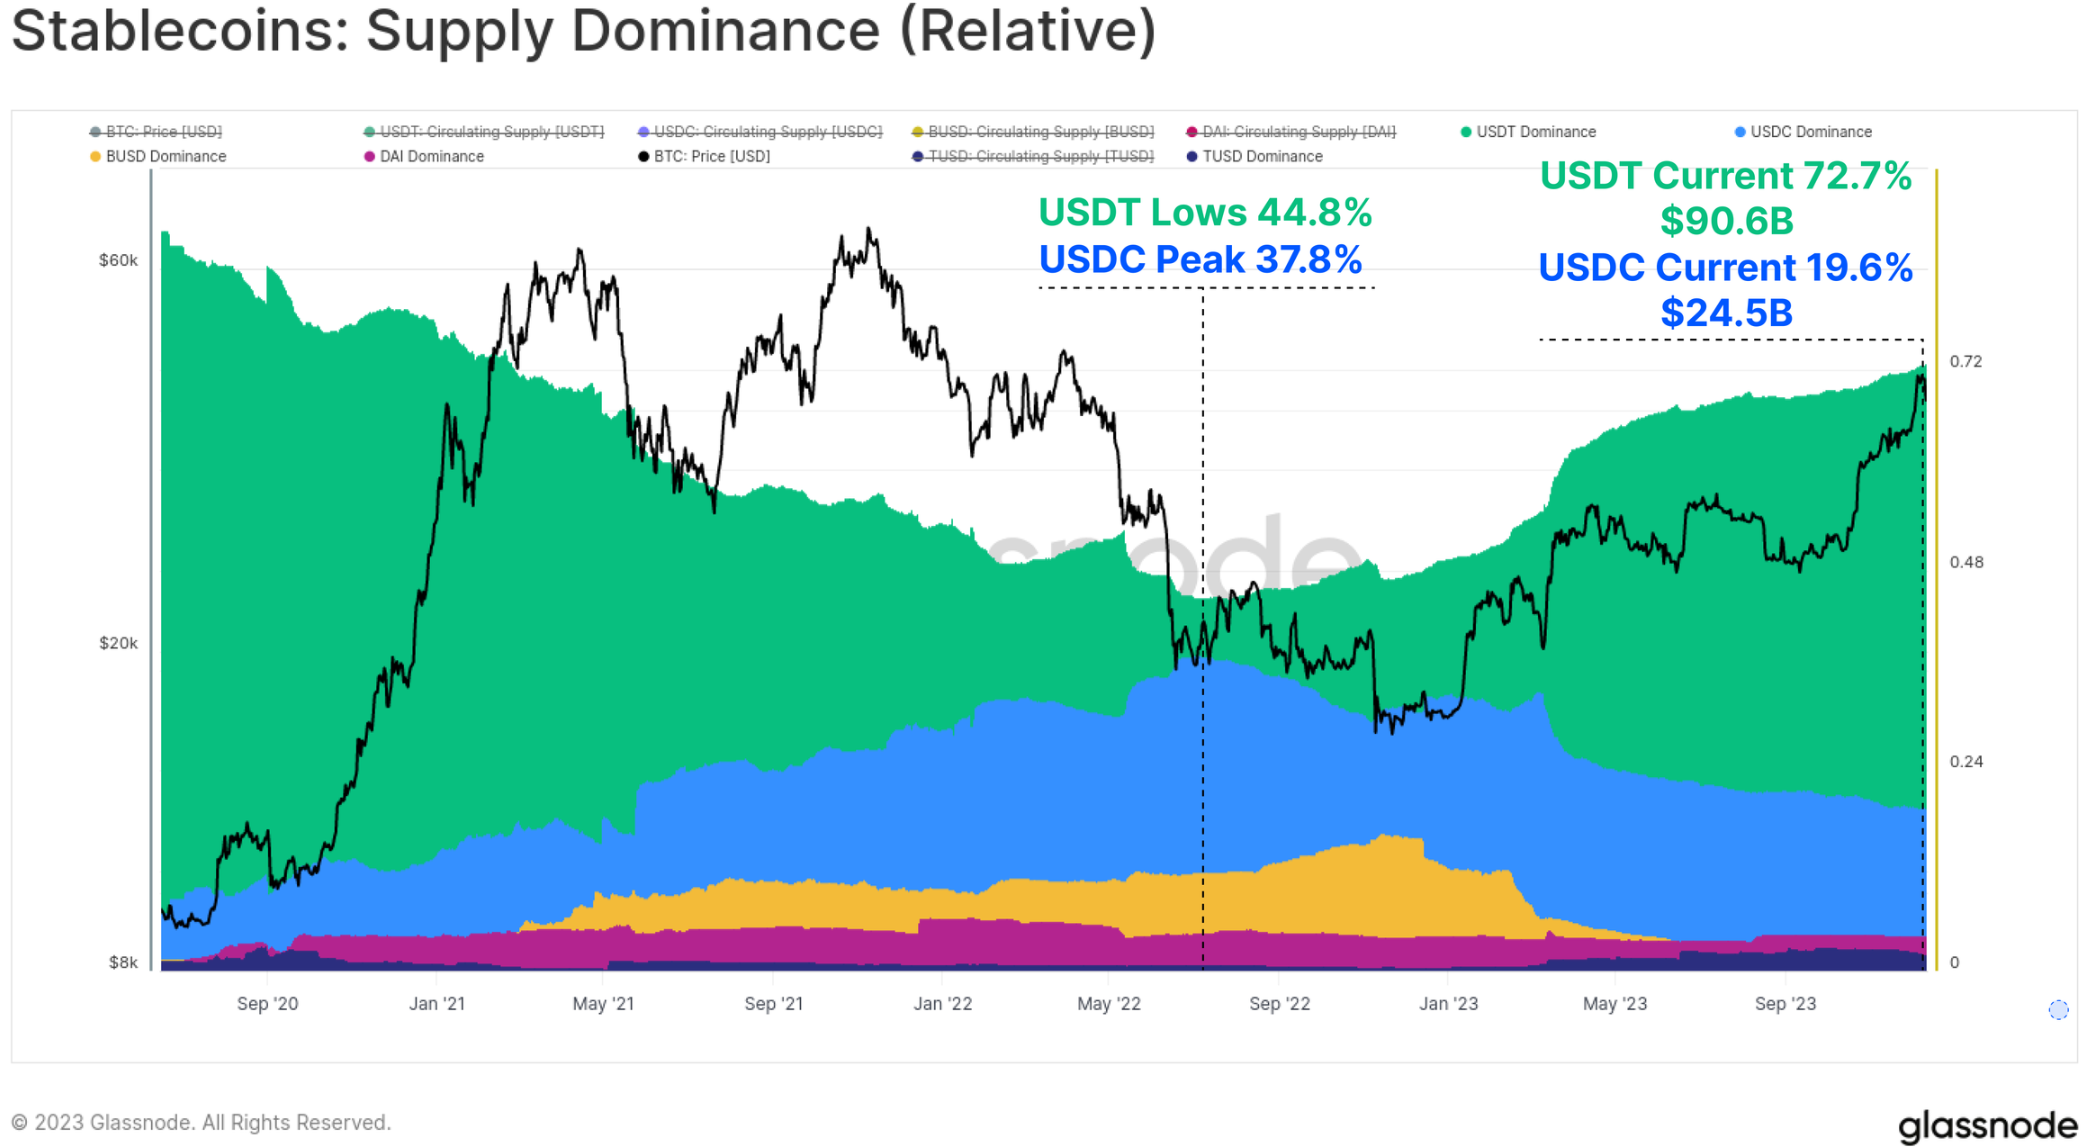
There has also been a significant shift in the relative dominance among various stablecoins between 2022 and 2023. Previously rising stablecoins such as USDC and BUSD have seen their dominance greatly shrink, with BUSD entering a redemption-only mode, and USDC's dominance dropping from 37.8% in June 2022 to 19.6%.
Tether (USDT) has once again become the largest stablecoin, with a total supply exceeding $90.6 billion, occupying 72.7% of the market share.
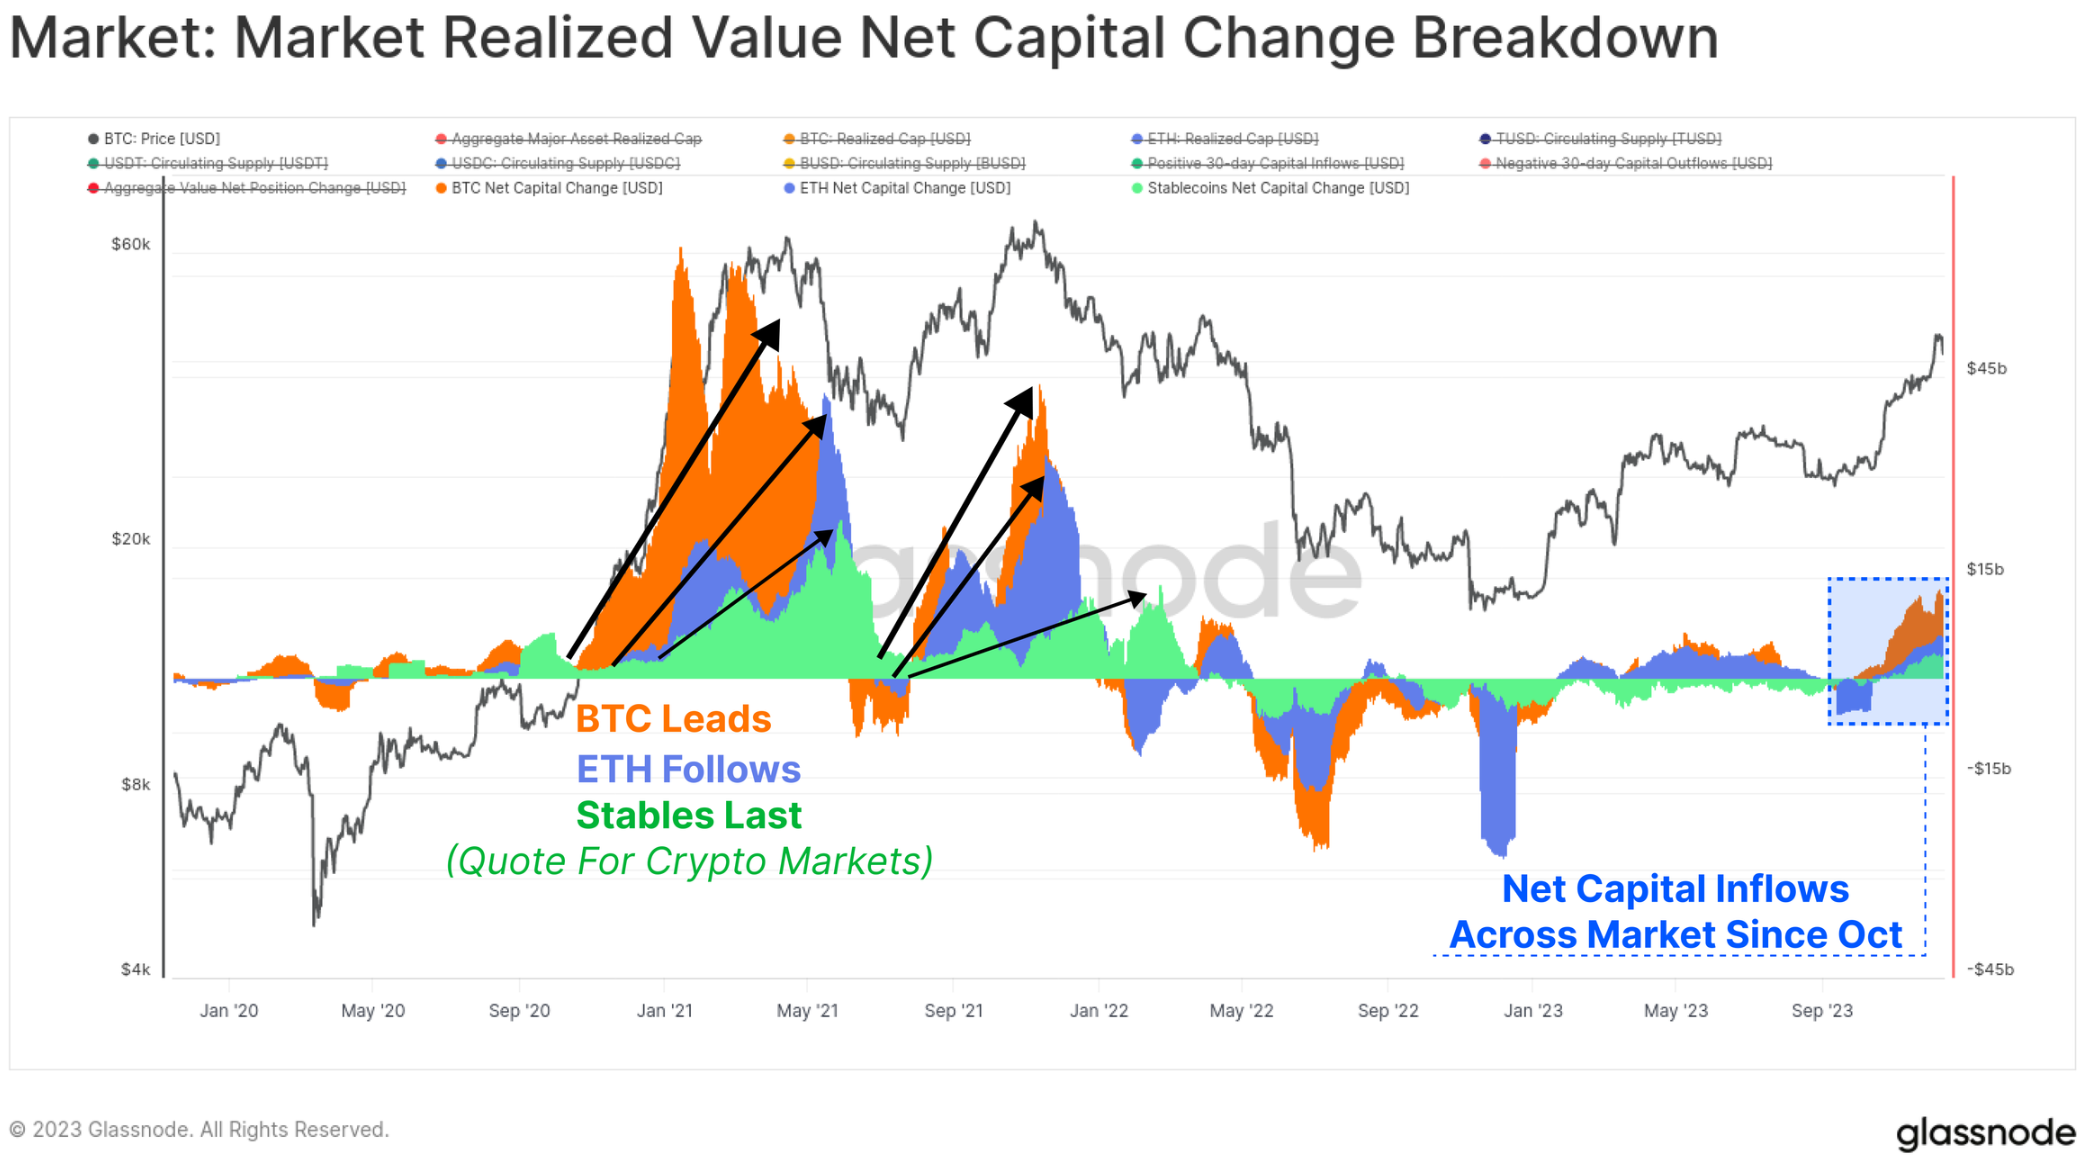
Finally, we can compare the 30-day realized market value changes of BTC and ETH with the changes in stablecoin total supply. These three indicators help visualize and measure relative capital flows and rotations between sectors.
October once again became a key moment, with positive net capital inflows for all three major assets, consistent with the market breaking the key level of $30,000, increased institutional interest in the derivatives market, and positive net capital inflows for the three major digital assets.
Summary and Conclusion
2023 is starkly different from the destructive deleveraging and market downturn trend of 2022. Instead, this year has seen a renewed interest in digital assets, with impressive performances and the emergence of new on-chain artifacts in the form of Bitcoin inscriptions.
Bitcoin supply is currently tightly held by long-term holders, and most investors now hold profitable Bitcoin. With the increasing likelihood of the launch of a US ETF in early 2024 and the Bitcoin halving coming in April, an exciting year ahead is already in the making.
免责声明:本文章仅代表作者个人观点,不代表本平台的立场和观点。本文章仅供信息分享,不构成对任何人的任何投资建议。用户与作者之间的任何争议,与本平台无关。如网页中刊载的文章或图片涉及侵权,请提供相关的权利证明和身份证明发送邮件到support@aicoin.com,本平台相关工作人员将会进行核查。


