Click to watch the video: Master Chen's 11.29 Video: Analysis of the Relationship between the Stock Market and the US Dollar Index, Main Force Clearing Retail Investors' Virtual and Real Ideas
Today's video will discuss the likelihood of the US dollar index breaking below 100 USD, so the long-term outlook for Bitcoin remains bullish. Additionally, there are predictions from institutions about Bitcoin reaching new highs in 2024, as well as an analysis of the virtual and real actions of Bitcoin's main force.

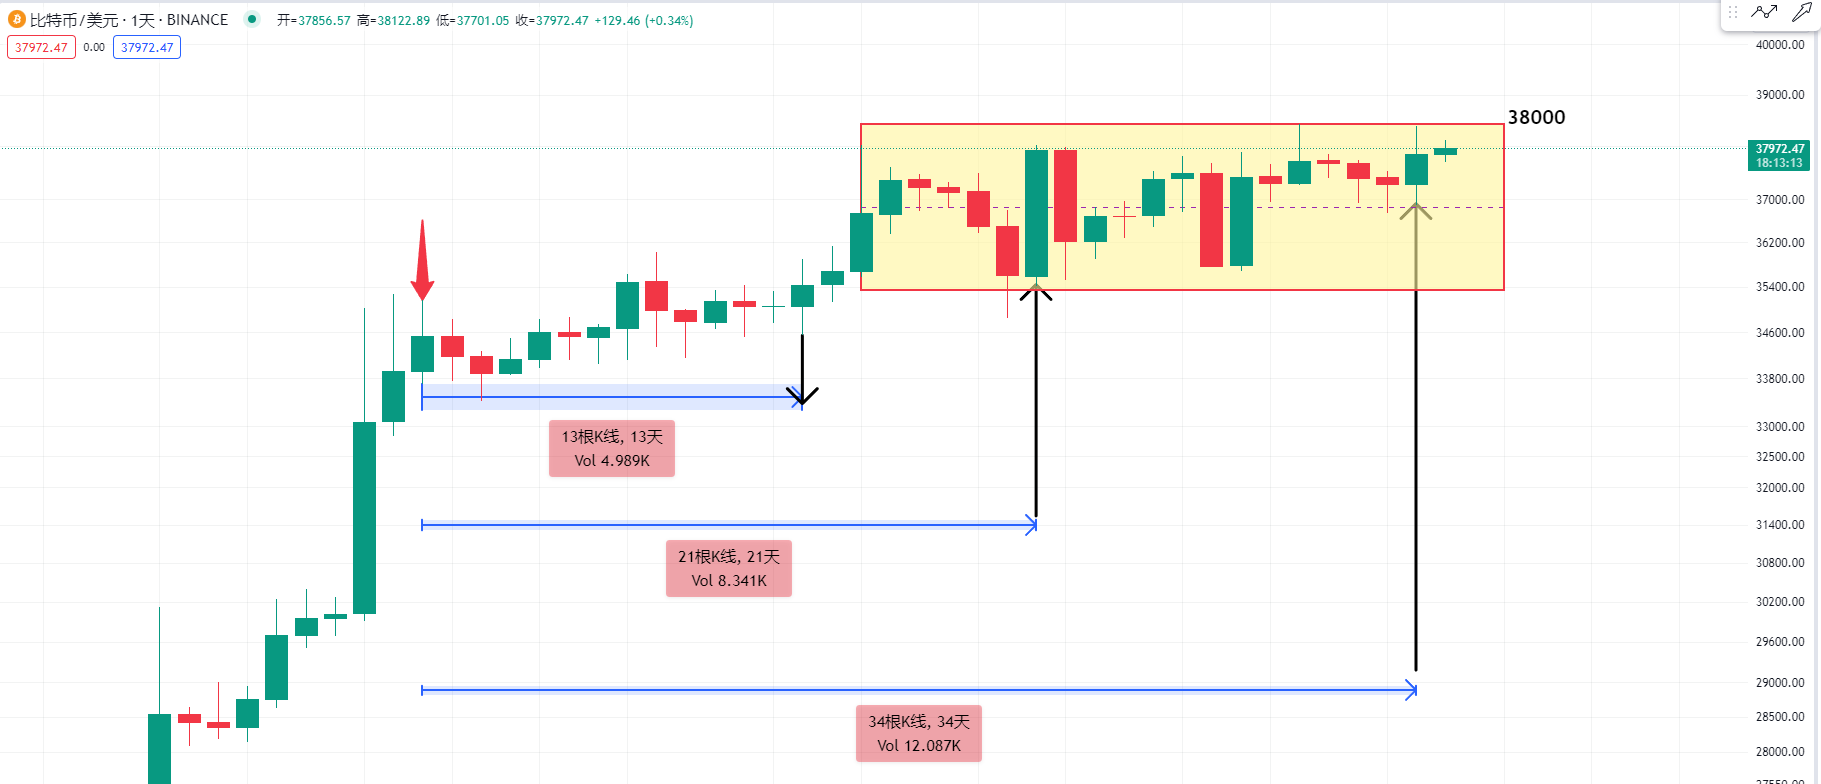
First, let's take a look at the daily chart of Bitcoin. The time window is quite interesting. From this candle to this one, the Fibonacci sequence shows a reversal at 13, indicating an upward trend. Similarly, from this candle to this one, there is a reversal at 24, and yesterday's candle indicates a reversal at 34.
So, the short-term trend continues to rise, and I am not overly bearish on Bitcoin. However, trading futures recently has been challenging because the closing price has not effectively stayed above 38,000. Therefore, you should pay attention to whether the main force is still clearing out retail investors. In my opinion, when there is a short-term support during a decline in the intraday session, you can consider taking a long position.

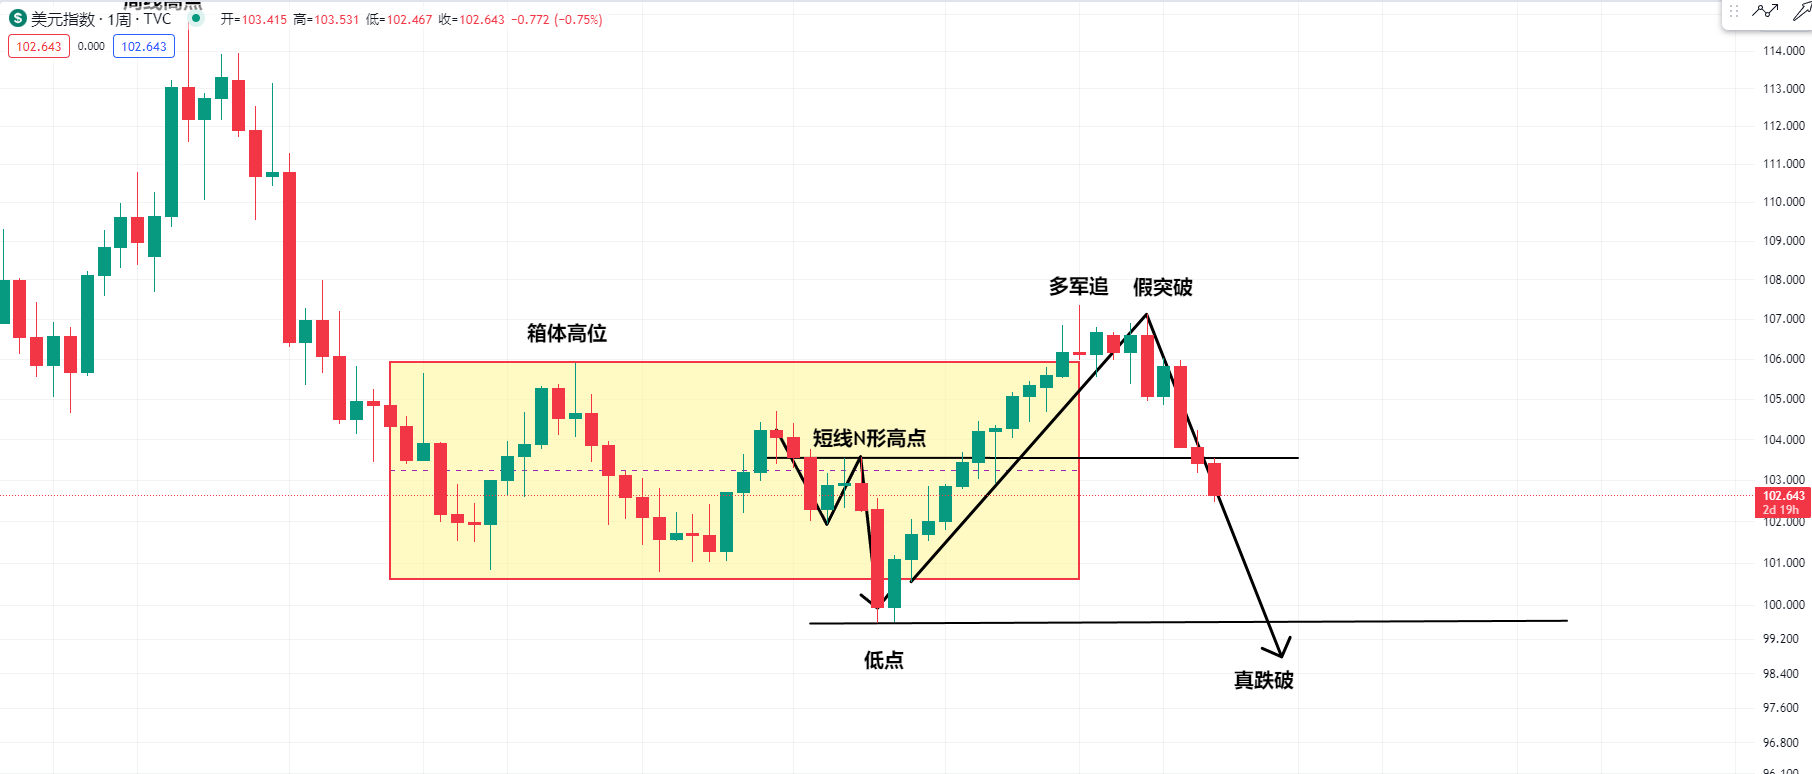
Next, let's look at the US dollar index. Sometimes we often see the formation of candlestick patterns, such as the box pattern. It's common to see the main force setting traps, such as false breakdowns, true breakthroughs, or false breakthroughs, true breakdowns. In yesterday's video, I also mentioned several types of trends in morphology. One is a direct breakthrough, and another is a breakthrough followed by a re-breakthrough.
Another type of trend is a breakthrough that may be a true breakdown. In my personal understanding, the theory of morphology is like distinguishing between reality and illusion. We need to see its false side, especially when the main force pushes the price to certain high levels. When there are many consecutive weekly candles with upper shadows, you should refer to some basic knowledge of the fundamentals or the situation where the CPI is declining, including the fact that the Fed's interest rates are so high that they are definitely going to be cut in the future.
Therefore, this has a significant impact on the US dollar index. At such high levels, it is likely to be false, and the main force can break through the high point of this box, causing some bulls to chase at these high levels. So, you need to be careful that the main force is playing tricks, and their real purpose may be to decline. Since we have seen this box pattern, according to historical experience, if there is a breakthrough, there should not be a retracement. A retracement will definitely lead to a break below the low point.
So, for some time, I believe that the US dollar index is definitely going to break below 100 USD. Now, we observe that the short-term high points have already been broken, so my view is that the US dollar index is even more bearish. Is it possible for Bitcoin to reach a historical high? I will also share my thoughts on this later.

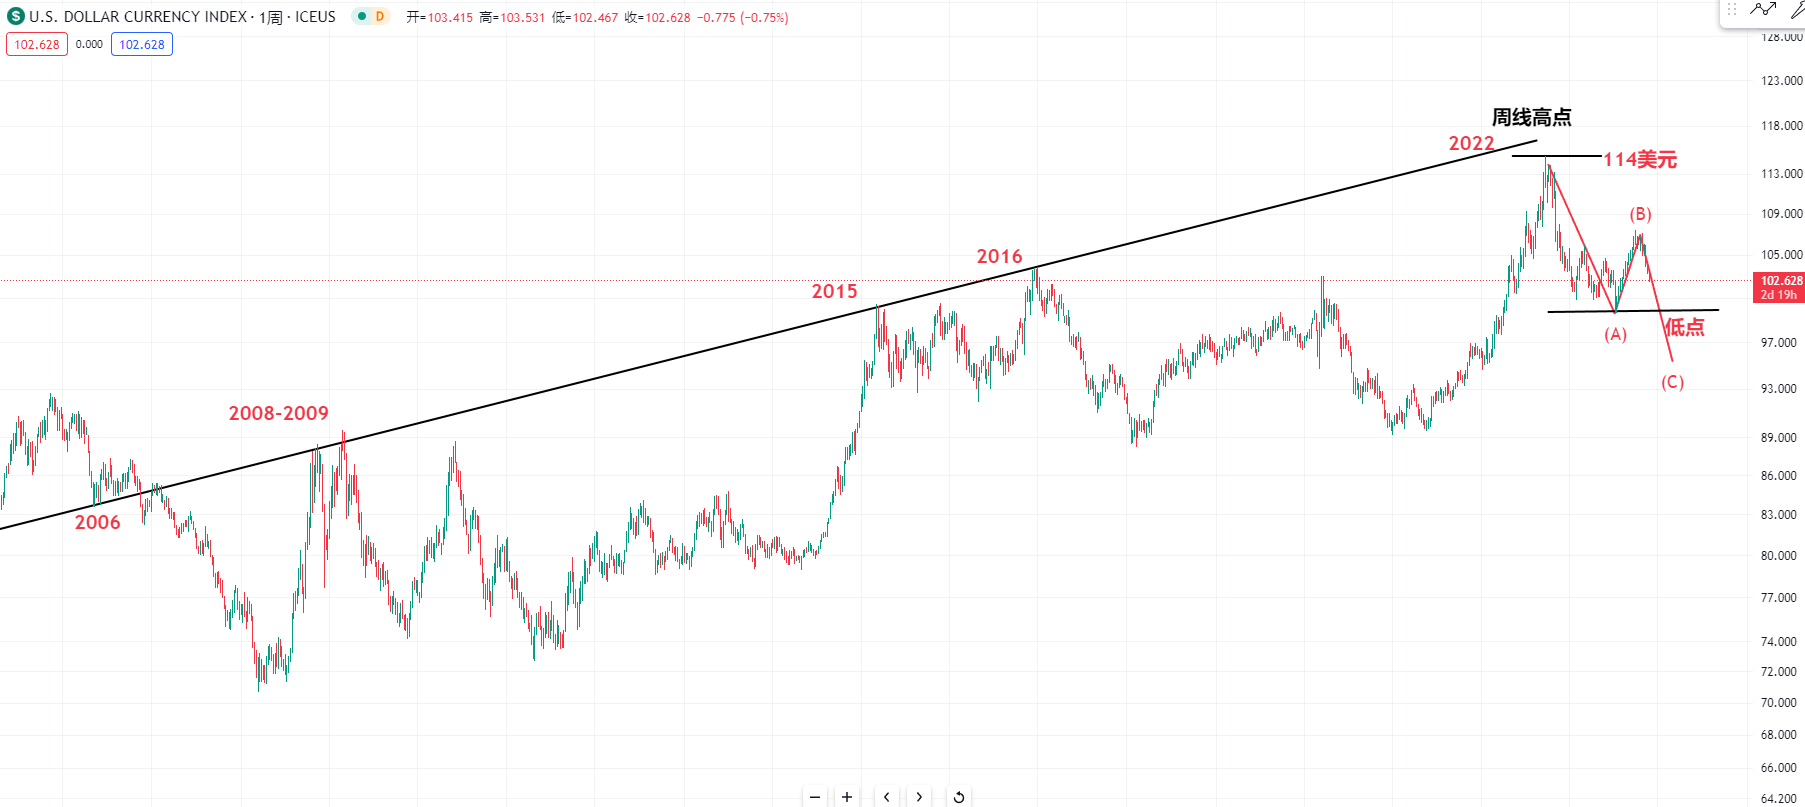
Now, let's take a look at the upper shadow in the weekly chart of the US dollar index. We can see several turning points in the history of the US dollar index. Especially last year, I mentioned the position to buy Bitcoin at the bottom. At the same time, I also speculated that the US dollar index might rise to this high point, which is a very weak position. Because I believe that if the interest rate of a certain country is raised to above 4%, it is considered very high.
Or according to the theory of candlestick charts and support and resistance, we can see the low points in 2004 and 2005, and in 2006, I often mentioned that the two resistances in 2008 and 2009 were not broken through. Then in 2015 and 2016, there were also two resistances that were not broken through, and later collapsed around 114 USD. My view is that it is likely to be in a very large ABC decline now, and it will definitely break below this low point.

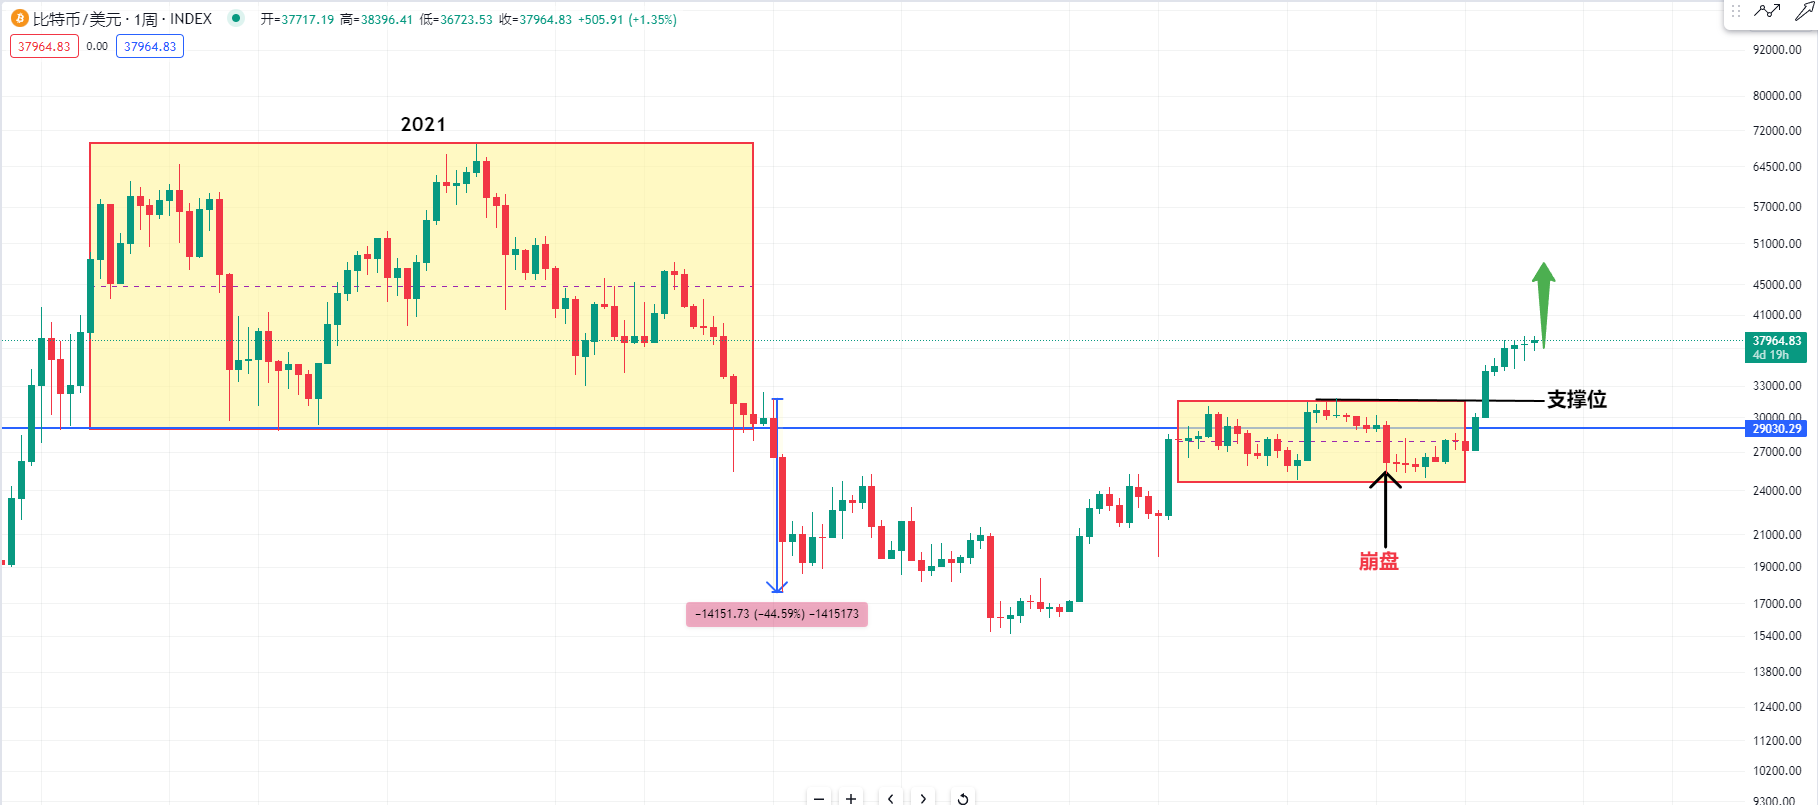
Now let's take a look at the large box pattern of Bitcoin in 2021. Currently, it's the opposite of reality. We need to see that the main force below 30,000 is just to deceive the chips, including what I mentioned in yesterday's video. If there is a drop of more than 40% in two weeks in the weekly chart, these low points are very important panic bottoms.
Of course, we cannot predict whether the main force will dig another pit and create a black swan event. However, at present, everything below is virtual, and the main force is just deceiving retail investors' chips. Now, looking at the box pattern of 2021, the price has risen. In yesterday's video, I also reminded everyone that it may not necessarily fall back to the support level.
Because I believe that historically, such box pattern consolidations are rare. At such a major collapse position, it may have been tested in advance at this position, and there may not be a significant retracement. After consolidating at this level, it may continue to attack upwards.
For more strategies, you can join the live trading.
Candlesticks are king, trends are emperor. I am Master Chen, focusing on BTC, ETH spot and futures contracts for many years. There is no 100% method, only 100% following the trend. I update macro analysis articles and technical analysis review videos daily across the entire network! Image Friendly reminder: Only the public account of the column (as shown in the image above) is written by Master Chen. The advertisements at the end of the article and in the comments section are not related to the author. Please be cautious in distinguishing between true and false. Thank you for reading.
免责声明:本文章仅代表作者个人观点,不代表本平台的立场和观点。本文章仅供信息分享,不构成对任何人的任何投资建议。用户与作者之间的任何争议,与本平台无关。如网页中刊载的文章或图片涉及侵权,请提供相关的权利证明和身份证明发送邮件到support@aicoin.com,本平台相关工作人员将会进行核查。


